HAL Id: hal-00316832
https://hal.archives-ouvertes.fr/hal-00316832
Submitted on 1 Jan 2000
HAL is a multi-disciplinary open access
archive for the deposit and dissemination of sci-entific research documents, whether they are pub-lished or not. The documents may come from teaching and research institutions in France or abroad, or from public or private research centers.
L’archive ouverte pluridisciplinaire HAL, est destinée au dépôt et à la diffusion de documents scientifiques de niveau recherche, publiés ou non, émanant des établissements d’enseignement et de recherche français ou étrangers, des laboratoires publics ou privés.
The effect of magnetic substorms on near-ground
atmospheric current
E. Belova, S. Kirkwood, H. Tammet
To cite this version:
E. Belova, S. Kirkwood, H. Tammet. The effect of magnetic substorms on near-ground atmospheric current. Annales Geophysicae, European Geosciences Union, 2000, 18 (12), pp.1623-1629. �hal-00316832�
The eect of magnetic substorms on near-ground atmospheric current
E. Belova1, S. Kirkwood1, H. Tammet2
1MRI Atmospheric Research Programme, Swedish Institute of Space Physics, Box 812, Kiruna 98128, Sweden 2Institute of Environmental Physics, University of Tartu, 18 UÈlikooli Street, Tartu, 50090, Estonia
Received: 9March 2000 / Revised: 13 September 2000 / Accepted: 5 October 2000 Abstract. Ionosphere-magnetosphere disturbances at
high latitudes, e.g. magnetic substorms, are accompa-nied by energetic particle precipitation and strong variations of the ionospheric electric ®elds and currents. These might reasonably be expected to modify the local atmospheric electric circuit. We have analysed air±earth vertical currents (AECs) measured by a long wire antenna at Esrange, northern Sweden during 35 geo-magnetic substorms. Using superposed epoch analysis we compare the air-earth current variations during the 3 h before and after the time of the magnetic X-component minimum with those for corresponding local times on 35 days without substorms. After elimination of the average daily variation we can conclude that the eect of substorms on AEC is small but distinguishable. It is speculated that the AEC increases observed during about 2 h prior to the geomagnetic X-component minimum, are due to enhancement of the ionospheric electric ®eld. During the subsequent 2 h of the substorm recovery phase, the dierence between ``substorm'' and ``quiet'' atmospheric currents decreases. The amplitude of this ``substorm'' variation of AEC is estimated to be less than 50% of the amplitude of the diurnal variation in AEC during the same time interval. The statistical signi®cance of this result was con®rmed using the Van der Waerden X-test. This method was further used to show that the average air-earth current and its ¯uctu-ations increase during late expansion and early recovery phases of substorms.
Key words: Ionosphere (electric ®elds and currents) ± Magnetospheric physics (storms and substorms) ± Meteorology and atmospheric dynamics (atmospheric electricity)
1 Introduction
The global electric circuit, in which atmospheric currents ¯ow from the ground to the ionosphere in low-latitude regions, and then spread all over the globe and return to the ground through the fair weather regions, has been widely studied over the last 30 years. A review on the topic was recently published by Bering et al. (1998). The three main generators, or energy sources, of this circuit are believed to be thunderstorms, the ionospheric dynamo (tides) and the solar wind/magnetosphere dynamo (Roble and Tzur, 1986). Thunderstorms, which occur mostly at equatorial and subequatorial latitudes maintain the potential dierence of 150±600 kV (Muhl-eisen, 1977) between the ground and the ionosphere. Tides in the ionosphere lead to the appearance of a horizontal potential dierence of 5±15 kV between high and low latitudes at ionospheric heights (Richmond, 1986). Solar wind-magnetosphere coupling results in an additional ionospheric potential drop of 40±100 kV across the polar caps.
After the discovery of the latter two generators, the question arose of how and to what extent the atmo-spheric currents near the ground are in¯uenced by the ionospheric horizontal electric ®eld. There are many papers devoted to the theoretical problem of mapping the ionospheric electric ®eld to the ground and solving it for dierent cases and approaches (e.g., BostroÈm and Fahleson, 1974; Dejnakarintra et al., 1985; Roble and Hays, 1979). In general, downward mapping of a horizontal electric ®eld leads to a decrease of the horizontal component with decreasing height and its conversion to vertical electric ®eld near ground. Calcu-lations by Park (1976) and Roble and Hays (1979) showed that the magnetospheric generator could pro-duce perturbations of 20% in the air-earth current (AEC) at high latitudes. Recently Tinsley et al. (1998) have reported a signature of large-scale ionospheric electric potential in the vertical electric ®eld data from Correspondence to: E. Belova
the South Pole reaching at times 30% of the usual low-latitude electric ®eld.
The geomagnetic substorm is a common phenome-non at high latitudes, occurring near local magnetic midnight. It can be detected as a variation of the horizontal component of the geomagnetic ®eld recorded on the ground. The signature is in the form of a magnetic bay generally lasting several hours (Rostoker et al., 1980). The distribution of the ionospheric electric ®eld and conductivity are known to change in charac-teristic ways during substorms, so substorms could provide an additional ionospheric source of large enough horizontal scale to contribute to the local atmospheric electric current.
In a series of papers, Tinsley and Heelis (1993) and Tinsley et al. (1994) have suggested that the global electric circuit may provide a link between solar variability and climate changes. They considered, as one example, the eect of solar wind magnetic sector crossings on tropospheric vertical electric ®eld. Magnet-ic substorms may also be associated with changes in the interplanetary magnetic ®eld, i.e. with a change to southward direction (Rostoker et al., 1980). Hence, an in¯uence of geomagnetic substorms on air-earth current could provide one more channel for solar-atmospheric interaction.
Ruhnke (1969) and Ruhnke et al. (1983) have discussed the advantages of using a long wire horizontal antenna to collect AEC to detect the global variations of atmospheric electricity. Our goal is to study the eect of the ionospheric substorm generator on the AEC using measurements carried out at ground level in northern Sweden with this type of antenna.
2 Experimental setup
Observations of the fair weather current were made using a long wire antenna (100 m long) located near the top of a hill at Esrange (68°N, 21°E), Sweden. The diameter of the antenna wire is 2 mm and the antenna is placed at about 2 m height parallel to the ground surface. It collects the atmospheric vertical currents ¯owing above it from an eective area of about 200 m2
(Ruhnke, 1969; Tammet et al., 1996). The current is fed to an ampli®er and recorded via an analogue-to-digital converter by a computer. During 1998 and early 1999 only 1-min averaged data were recorded. Measurements have been made since August 1998. The measurement of total current collected by the antenna can be used to estimate the atmospheric current density by dividing the current by the eective area of the antenna as, for instance, described by Tammet et al. (1996).
3 Geomagnetic substorm eect
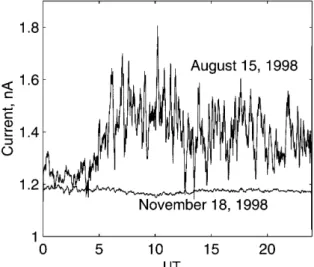
Usually the air-earth currents show rather strong variability. We discuss the reasons for this later. To illustrate, we show the daily variations of AEC for August 15, and November 18, both 1998 (in Fig. 1). The
time variations of the signal dier greatly and change from day to day and from hour to hour.
We measure the local air-earth current, which is determined by the potential dierence between the ground and the ionosphere as well as the pro®le of atmospheric conductivity. The conductivity increases approximately exponentially with altitude, which means that the atmospheric resistance resides mainly at trop-ospheric heights and near the ground. As a consequence the AEC is very sensitive to variations in local wind, cloudiness and other local meteorological conditions. Other reasons for local variations can include cell-structured convection, mechanical vibration of the antenna and other instrumental and recording factors (Tammet, 1991). As a result there is great variability in current amplitude.
The redistribution of the ionospheric electric ®eld during a magnetic substorm generally occurs in a region near magnetic midnight but extending over roughly 60° in longitude, and between 57°±70° of latitude (Weimer, 1999), i.e. in a small part of the auroral oval. We expect that the eect of a substorm should be much less than that due to the solar/magnetosphere generator (around 25% from the undisturbed level for low latitudes) and, of course, much less than that due to the thunderstorm generator. From Fig. 1 it can be concluded that we have to separate such small variations from the strong disturbances caused by many other reasons before we can identify the eects of substorms. The method we use, appropriate for such a kind of separation, is superposed epoch analysis (SEA).
The signature of a magnetic substorm on the ground is generally a decrease of the horizontal component of the magnetic ®eld in a ``bay'' form. As key times (t = 0) for superposed epoch analysis we used the times when the north-south component of the geomagnetic ®eld detected by the Kiruna magnetometer (35 km west of Esrange) reached a minimum during the substorm. We included only substorms occurring near local magnetic midnight at 2115 UT (within an interval from 3 h before Fig. 1. Daily variations of air-earth current measured at Esrange for two days: August 15, and November 18, 1998
to 4 h after midnight) and with magnetic variations exceeding 300 nT. In addition, we restricted the events to isolated magnetic bays, i.e. there were no new substorm intensi®cations for at least the next 2.5 h. We summed the values of AECs for all substorm events during an interval of 3 h before and 3 h after the key time. Before summing, the AECs show substantial scattering in the data values. The AEC mean values can vary essentially from one event to another due mostly to meteorological factors or seasonal variability. Therefore to apply SEA we have to eliminate this eect. For each event we subtracted the mean values calculated over the 6-h interval. It is also important to exclude from the analysis non-fair weather days when AEC's ¯uctuations can be so large that they completely mask the substorm eect. By doing this in a similar manner to Frank-Kamenetsky et al. (1999) we kept cases for analysis that showed no AEC deviation from the mean AEC level over the 6 h interval of more than 30%. The substorm intensity is variable from one substorm to another and this can lead to dierent eects in AECs. We excluded from consideration weak substorms (with magnetic disturbances less than 300 nT), and by making SEA for several substorms we obtain the averaged eect of a substorm on AEC.
One more point should be taken in to account. The atmospheric electric ®eld over the ocean is known to show a pronounced daily variation (Carnegie curve) when averaged over a long period. During the interval from 1900 to 0400 UT (when most of our substorms occur) the daily variation shows a decrease in vertical electric ®eld by about 20% (Parkinson and Torrenson, 1931). This is believed to be due to variations of the global thunderstorm activity and their distribution. In a recent paper by FuÈllekrug et al. (1999) the mean diurnal variations of the atmospheric electric ®eld at the South Pole were presented and were estimated to reach 25%. Atmospheric currents measured at the ground in fair weather regions are expected to re¯ect the daily varia-tions of both the thunderstorm generator and the atmospheric conductivity. Substorms occur near mid-night; the key times for our 35 events are distributed between 1830 UT and 0200 UT, and we took into consideration intervals of 3 h around the key times. This means that our currents during this interval can show pronounced eects due to daily variations, which we should remove to obtain a substorm eect. For this reason we have chosen an additional set of AECs for 35 cases with low geomagnetic activity, i.e. under quiet conditions without substorms. We have selected days close to the days when the substorms occurred, and with magnetic q-indices of 0±3 during the 6 h interval of interest. We have made the same superposition of these currents as for the cases with substorms using the same set of key times as for the substorm events.
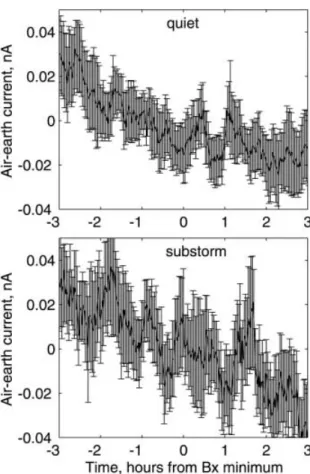
In Fig. 2 the results of the superposed epoch analysis for air-earth currents both under the quiet conditions and during the substorms are presented. The currents still show rather high variability but it is lower than before the SEA. Now we can distinguish a trend that was not clear for individual cases. A similar trend is
present in both data sets, namely a decrease in current during the interval being considered. But there are also dierences in the behaviour of currents with and without the substorms. During the ®rst 5 h approximately, the current under substorm conditions decreases more slowly than during quiet conditions, and the dierence is more than the uncertainties. The level of ¯uctuations is larger for the substorm case.
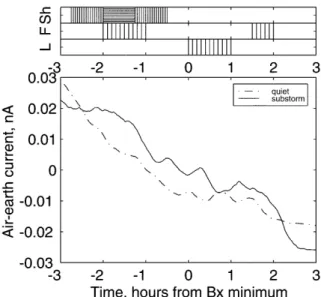
To emphasise this eect against the background of rather variable currents we have made a running average of currents over 65 min. The averaged currents under the quiet and under the disturbed geophysical conditions are shown in Fig. 3. The disturbed ``sub-storm'' current is larger than the undisturbed one during approximately 2 h before and 2 h after the time of the magnetic X-component minimum. At the times after t = 0 the dierence between ``substorm'' and ``quiet'' current decreases. We can estimate the magni-tude of the substorm eect only qualitatively or semi-quantitatively because of the large scatter in the data. The variations in AEC due to the substorms are less than half those due to ordinary daily variation over the same time interval.
Although the graphical presentation of the data allows us to follow and describe the eects of substorms in the antenna current, there is still open a question Fig. 2. Mean air±earth currents obtained using superposed epoch analysis during 3 h before and 3 h after the time of geomagnetic X-component minimum. Upper panel for 35 cases under quiet geomagnetic conditions, lower panel for 35 cases during geomagnetic substorms. The error bars indicate standard deviations
about statistical reliability of our conclusions. As the antenna current has strong random ¯uctuations, some dierences between the average curves for the two groups of time intervals might appear even when all measurements are made under non-substorm condi-tions. The reliability of the conclusions about the dissimilarity between two data subsets can be tested using methods of statistical inference. A traditional approach using mathematical statistics is to de®ne a quantitative index and compare its values as calculated for dierent data subsets using an established statistical method. There are no formal rules as to how to construct the index that should measure the dierence between two data subsets. Usually, the index is proposed on basis of the visual analysis of the data. Clearly there is some arbitrariness in the choice of indices used which, moreover, aects the result of the statistical inference. We therefore will proceed from geophysical considerations and construct three dierent and independent indices ylevel, y¯uct, and yshape as explained
later.
First, the substorm could aect the mean current. According to geophysical considerations, which we discuss in the next section, an increase is expected, i.e. the current should be bigger after the key time. Thus the index ylevel is chosen as the average antenna current
during the one-hour time subinterval starting with the key time. The speci®ed beginning and the end of this subinterval is made on the basis of the visual inspection of the data. In the same way, all time intervals used in de®nitions of the two other indices are formally volun-tary and based on informal geophysical considerations and inspection of data.
Moreover, the ¯uctuations of the current may be expected to increase during the substorm, and we see this in Fig. 2. Thus the second index is de®ned as the ¯uctuation index:
yfluctss2 1 1 ;
where s1is the estimate of the standard deviation of the
current in the one-hour time subinterval between 2 and 1 h before the key time and s2 is the estimate of the
standard deviation of the current in the half-hour time subinterval between 1.5 and 2 h after the key time. Since the absolute value of the standard deviation could be increased due to an increase in absolute values of the current, the ratio of standard deviations is chosen instead so that the second index is independent of the ®rst. The third index is suggested by the results of the superposed epoch analysis, which show a change in the shape of the curve of diurnal variation of the air-earth current. The change seems to aect the second derivative rather the ®rst. Thus the third index is the shape index de®ned as
yshapemm1 2m2 m3 1 m2 m3 ;
where m1, m2, and m3 are the average currents during
three subsequent 45-min subintervals where the second interval starts 2 h before the key time. The shape index is independent of the ®rst two indices.
It is expected, that the substorm could increase the values of the level index and the ¯uctuation index, and decrease the value of the shape index.
Values of the indices for 35 substorm time intervals and 35 non-substorm time intervals are shown in Fig. 4. An arbitrary scale with arbitrary zero point is used as the absolute values of the indices are not essential in the following discussion. Figure 4 shows that the distribu-tion of index values is not Gaussian. Therefore we choose the Van der Waerden X-test (Van der Waerden, Fig. 3. The same air±earth currents as in Fig. 2 but with running
averaging over 65 min. Top panel shows time intervals used for the calculations of the level (L sign), ¯uctuation (F) and shape (Sh) indices. The description of the indices is in the text
Fig. 4. Values of the three indices for substorm (S) and non-substorm (N) time intervals. Horizontal dashes indicate the quartiles, vertical arrows indicate the out-of-scale values
1957) as a method of statistical inference, because it is applicable independent of the distribution law and has the same maximum power as the well-known t-test for Gaussian distribution (Hajek, 1962). (The Van der Waerden X-test is one of the non-parametric tests. Simple tests of this type are described in standard textbooks such as Wilks, 1995).
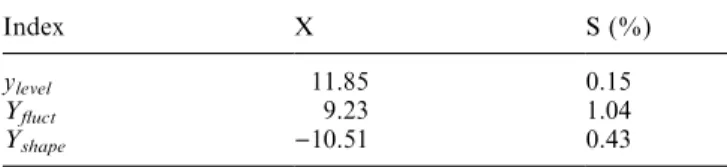
The null hypothesis states that substorm does not aect the value of the selected index. To prove the eect, the null hypothesis should be rejected. The results of the X-test are presented in Table 1.
The value of X is a measure of the dierence in locations of the substorm and non-substorm distribu-tions for the dierent indices. The positive X-values for the level and ¯uctuation indices indicate that these are higher in the substorm case. This result for current level could not be obtained by superposed epoch analysis because of the procedure used in that analysis. The substorm in¯uence on the shape index (a decrease in X) corresponds to an increase of vertical current in the substorm growth phase, relative to the expansion phase, as was found by the superposed epoch analysis. The parameter S means that there is a risk of S% that the eect we have detected does not really exist. The high values of X and low values of S for all three indices imply that we can assert that an eect of substorms on average air-earth current, its ¯uctuations and behaviour really exists. A level of S of about 1% is considered low enough that we can proceed to discuss the properties of the eect. Our risk is in practice lower than this limit, as we have the same inference according to three indepen-dent indices.
4 Discussion
To interpret the results we have obtained one needs to consider ®rst what is happening in the ionosphere during a geomagnetic substorm. It is beyond our scope to describe in detail this complicated and so far not completely understood phenomenon. We refer to the monograph by Akasofu (1977). In general terms, the substorm is characterised by a number of ionospheric signatures such as changes in the ionospheric potential pattern, hydro-magnetic waves, precipitation of ener-getic particles, aurora and many others. There are three phases of a substorm: growth, expansion and recovery. The time when the minimum in magnetic X-component is reached marks the beginning of the ®nal, recovery, phase of a substorm. For atmospheric currents the variations of the large-scale ionospheric electric ®eld and conductivity during a substorm are likely to be most
important. The reason for this is that the large-scale horizontal electric ®eld can be converted eciently to a vertical one near the ground (Park, 1976) and contribute to the air-earth current. The changes in ionospheric conductivity in the auroral zone could lead to redistri-bution of the global atmospheric electric current in fair weather regions between high and lower latitudes. The latter mechanism is not likely to be so eective as the former, because the local vertical current is controlled by local column atmospheric resistance, the ionospheric part of which is very small.
By superposed epoch analysis we obtained that the AEC is increased during the interval roughly corre-sponding to the growth and expansion phases, com-pared with that during the recovery phase. This would be the expected result of increased anticlockwise con-vection (southward electric ®eld) in the ionosphere over the measurement site (Park, 1976). This is at ®rst sight rather surprising since, if our site is close to the longitude of substorm onset, we would expect it to lie under the clockwise dusk convection cell during the substorm growth phase. An enhanced convection in this cell would map to increased upward vertical electric ®eld at the ground and reduced AEC.
However there is a possible explanation for our results. The growth phase of a substorm is accompanied by an enhanced convection electric ®eld (Pellinen and Heikkila, 1984). Mapped to the ionosphere this leads to increases in both eastward and westward electrojets (clock- and anti-clockwise convections). The substorm onset occurs at the localised region where the electrojet changes direction but there are enhanced auroral elec-trojets over a large longitude interval on either side of this. Our site might frequently be far east of the onset region but we can still detect the depression of the magnetic X-component if we are not too far from the westward auroral electrojet. In this case we might have enhanced southward electric ®eld overhead at our site even during substorm growth and onset phase, which could lead to the observed increase of vertical downward atmospheric current. We could con®rm or reject this explanation if we had information about an ionospheric electric ®eld for all 35 cases under consideration. Preliminary analysis of the ionospheric electric ®eld distribution has been done using STARE data (for description of the STARE measurements see Zi and Nielsen 1982). In most cases for which the data are available the southward electric ®eld increase was observed 1±2 h before the zero time used for the SEA. Study of the electric ®eld in detail as well as modelling of its mapping to the ground will be presented in a future work.
Alternatively, we note that during growth phase the electric conductivity in the D-region at midnight-sector sites can increase due to precipitation of high-energy particles from the outer edge of the ring current (Kirkwood and Eliasson, 1990). This could lead to ampli®cation of downward atmospheric current at auroral latitudes compared with lower latitudes.
Using the Van der Waerden X-test we showed also that the average air-earth current is enhanced during Table 1. Values of the X-statistics and minimal values of the
signi®cance level that allow us to reject the zero hypothesis in favour of the one-sided alternative
Index X S (%)
ylevel 11.85 0.15
Y¯uct 9.23 1.04
late expansion and early recovery phases of substorm, compared with days without substorms. There are two factors that could increase the current: an increase of local ionospheric potential in the dawn convection cell or an increase of air ionisation rate. If our observation point is near or eastward of the onset region then we could expect an increase of downward electric current and hence of the average value of AEC after the key time. The same eect in AEC could result from an ionospheric conductivity enhancement, as described above. However, since we analyse only the average current, we cannot determine the role of individual factors.
As with the average current, the relative ¯uctuations of the current are enhanced during substorms. The absolute ¯uctuations are enhanced even more due to the multiplication with enhanced average current. The two factors, ionospheric potential and ionisation rate, have dierent eects on ¯uctuations. The ¯uctuating compo-nent of air-earth current is mostly the displacement current induced by variations of electric ®eld. A change of electric ®eld by about 1 V m)1 s)1 gives rise to a
current of the same magnitude as the average current. The ¯uctuations of ionospheric potential follow the ¯uctuations of electric ®eld and the eect of ionospheric potential is enhanced in ¯uctuations of antenna current when compared with the eect of ¯uctuations in ionisation rate.
Generally speaking we do not have enough informa-tion about the real distribuinforma-tion of the electric ®eld during the dierent substorm phases, we know well only the behaviour of the magnetic ®eld on the ground. Models have been developed of the distribution of electric potential in the polar ionosphere during sub-storms (based on satellite measurements) for instance, by Weimer (1999). However, these give an average large-scale picture of potential for the whole polar cap and oval. Distributions of ionospheric electric ®eld during substorms have been measured by the EISCAT radar (e.g. Kirkwood et al., 1988; Sandahl et al., 1990) but only for a limited number of particular events. In practice, as mentioned, we need to analyse the behaviour of the ionospheric electric ®eld above our AEC obser-vation point during the substorms which we used to obtain our results. Electric ®eld measurements from the EISCAT system could be used in future, when the number of joint observations with our AEC system becomes large enough for meaningful statistics.
It should also be mentioned that our results show dierences between the currents at the beginning and the end of the time interval considered (see Fig. 3). One of the reasons might be that we chose substorms for analysis, which had no intensi®cation for at least 2.5 h after the Bx minimum. In practice, very often there is a series of substorms and after 2.5±3 h new substorm activation can occur. Further, we have identi®ed a magnetic disturbance as a substorm only if it exceeded 300 nT so we cannot be sure that there is no previous substorm, which was less intensive than this.
Finally, we should mention a little more about the reliability of our result obtained with the superposed
epoch analysis. The eect of substorms is clearly rather weak and the data scatter large. We have checked the persistence of the result by dividing the data set in two, and making superposed epoch analysis of the two subsets separately. The result is less clear, but the same tendency is still seen. We have also tested the eect of using another key time, i.e. the substorm onset as indicated by Pi2 pulsations. Again, the superposed epoch analysis shows an increase in AEC during the growth and the expansion phases. The last, and perhaps most convincing argument, is that we checked and con®rmed the signi®cance of our result with standard statistical methods.
5 Summary
We have investigated by means of superposed epoch analysis the in¯uence of geomagnetic substorms on fair weather air-earth currents measured near the ground. For the ®rst time we showed that the eect of substorms can be detected in these currents against the background of daily variations. This eect is manifested as a distinguishing increase of air-earth current for about 2 h before the time of magnetic X-component minimum. Possible explanations include enhanced vertical electric ®eld at the ground due to enhancement of the iono-spheric southward electric ®eld during substorm growth and expansion phases and redistribution of downward atmospheric electric currents due to an increase of the atmospheric conductivity in the local D-region. Using statistical methods we also showed that average air-earth current and its ¯uctuations increase during substorms. Further work including data on the iono-spheric electric ®elds during substorms is needed to con®rm the observed current increase and determine its cause.
Acknowledgements. We would like to thank Les Hale, Sven Israelsson, and the sta of Esrange for invaluable help in establishing the AEC measurements in Kiruna. We are also grateful to Ingemar HaÈggstroÈm for assistance when working with Kiruna magnetic data. We thank Erling Nielsen, PI of the STARE project, for the useful remarks on an ionospheric electric ®eld issue. The work of SK is supported by the Swedish Natural Sciences Research Council.
Topical Editor Mark Lester thanks B.A. Tinsley and A.J. Smith for their help in evaluating this paper.
References
Akasofu, S.-I., Physics of magnetospheric substorms, in Astro-physics and space science library series, vol 47, D. Reidel, Dordrecht 1977.
Bering, E. A., A. A. Few, and J. R. Benbrook, The global electric circuit, Phys. Today 51(10), 24±30, 1998.
BoÈstrom, R., and U. Fahleson, Vertical propagation of time dependent electric ®elds in the atmosphere and ionosphere, paper presented at Fifty-First International Conference on Atmospheric Electricity; Garmisch-Partenkirchen, Germany, Sept. 2±7, 1974.
Dejnakarintra, M., U. S. Inan, and D. L. Carpenter, Transient tropospheric electric ®elds resulting from sudden changes in
ionospheric conductivity, J. Geophys. Res., 90, 12 271±12 281, 1985.
Frank-Kamenetsky, A. V., G. B. Burns, O. A. Troshichev, V. O. Papitashvili, E. A. Bering, and W. J. R. French, The geoelectric ®eld at Vostok, Antarctica: its relation to the interplanetary magnetic ®eld and the cross polar cap potential dierence, J. Atmos. Terr. Phys., 61, 1347±1356, 1999.
FuÈllekrug, M., A. C. Fraser-Smith, E. A. Bering, and A. A. Few, On the hourly contribution of global cloud-to ground lightning activity to the atmospheric electric ®eld in the Antarctic during December 1992, J. Atmos. Solar-Ter. Phys., 61, 745±750, 1999. Hajek, J., Asymptotically most powerful rank-order tests, Ann.
Math. Stat., 33, 1124±1147, 1962.
Kirkwood, S., and L. Eliasson, Energetic particle precipitation in the substorm growth phase measured by EISCAT and Viking, J. Geophys. Res., 95, 6025±6037, 1990.
Kirkwood, S., H. Opgenoorth, and J. S. Murphree, Ionospheric conductivities, electric ®elds and currents associated with auroral substorms measured by the EISCAT radar, Planet. Space Sci., 36, 1359±1380, 1988.
Muhleisen, R., The global circuit and its parameters, in Electrical processes in atmosphere, Eds. Dolezalek, H., and R. Reiter Steinkop, Darmstadt, 467±476, 1977.
Park, C. G., Downward mapping of high-latitude ionospheric electric ®elds to the ground, J. Geophys. Res., 81, 168±174, 1976. Parkinson, W. L., and O. W. Torrenson, The diurnal variation of the electric potential of the atmosphere over the oceans, Compt. Rend. De l'Assemblee de Stockholm, 1930; IUGG (Sect. Terrest. Magn. Electr) Bull., 8, 340±345, 1931.
Pellinen, R. J., and W. J. Heikkila, Inductive electric ®elds in the magnetotail and their relation to auroral and substorm phenomena, Space Sci. Rev., 37, 1, 1985
Richmond, A. D., Upper-atmosphere electric-®eld sources, in The Earth's electrical environment (studies in geophysics), Washing-ton, 195±205, 1986
Roble, R. G., and R. B. Hays, A quasi-static model of global atmospheric electricity 2. Electrical coupling between the upper and lower atmosphere, J. Geophys. Res., 84, 7247±7256, 1979. Roble, R. G., and I. Tzur, The global atmospheric-electrical circuit,
in The Earth's electrical environment (studies in geophysics), Washington, 206±231, 1986.
Rostoker, G., S.-I. Akasofu, J. Foster, R. A. Greenwald, Y. Kamide, K. Kawasaki, A. T. Y. Lui, R. L. McPherron, and C. T. Russel, Magnetospheric substorms ± de®nition and signatures, J. Geophys. Res., 85, 1663±1668, 1980.
Ruhnke, L. H., Area averaging of atmospheric electric currents, J. Geomagn. Geoelectr., 21, 453±462, 1969.
Ruhnke, L. H., H. F. Tammet, and M. Arold, Atmospheric electric currents at widely spaced stations, Proceedings in atmospheric electricity, Eds. Ruhnke, L. H., and J. Latham, A. Deepak Hampton, 76±78, 1983.
Sandahl, I., L. Eliasson, A. Pellinen-Wannberg, G. Rostoker, L. P. Block, R. E. Erlandson, E. Friis-Christensen, B. Jacobsen, H. Luehr, and J. S. Murphree, J. Geophys. Res., 95, 6051± 6072, 1990.
Tammet, H., Technical notes on simultaneous measurements of atmospheric electric currents, Institute of Geophysics Polish Academy of Science D-35(238), 1991.
Tammet, H., S. Israelsson, E. Knudsen, and T. J. Tuomi, Eective area of a horizontal long-wire antenna collecting the atmo-spheric electric vertical current, J. Geophys. Res., 101, 29671± 29 677, 1996.
Tinsley, B. A., and R. A. Heelis, Correlations of atmospheric dynamic with solar activity. Evidence for a connection via the solar wind, atmospheric electricity, and cloud microphysics, J. Geophys. Res., 98, 10 375±10 384, 1993.
Tinsley, B. A., J. T. Hoeksema, and D. N. Baker, Stratospheric volcanic aerosols and changes in air-earth current density at solar wind magnetic sector boundaries as conditions for the Wilcox tropospheric vorticity eect, J. Geophys. Res., 99, 16 805±16 813, 1994.
Tinsley, B. A., Weiping Liu, and R. P. Rohrbaugh, South Pole electric ®eld responses to overhead ionospheric convection, J. Geophys. Res., 103, 26 137±26 146, 1998.
Van der Waerden, B. L., Matematische Statistik, Springer, Berlin Heidelberg Newyork, 1957.
Weimer, D. R., Substorm in¯uence on the ionospheric electric potentials and currents, J. Geophys. Res., 104, 185±197, 1999. Wilks, D. S., Statistical methods in the atmospheric sciences,
Academic California, 1995.
Zi, M., and E. Nielsen, Spatial variation of electric ®elds in the high-latitude ionosphere, J. Geophys. Res., 87, 5202±5206, 1982.