EcoGRAFI
2nd International Conference on Bio-based Building Materials & 1st Conference on ECOlogicalvalorisation of GRAnular and FIbrous materials
June 21th - 23th 2017
Clermont-Ferrand, France
ACOUSTIC PROPERTIES OF LIME/HEMP CONCRETE PRODUCED BY
COMPRESSION MOLDING
E. R. Fotsing1*, T. Lecompte2, A. Ross1
1École Polytechnique de Montréal, Laboratoire d’Analyse Vibratoire et Acoustique (LAVA), 2500
Chemin de Polytechnique. H3T1J4, Montréal, Québec.
2Université Bretagne Sud, Laboratoire d’ingénierie des Matériaux de Bretagne, 56100 Lorient,
France.
*Corresponding author; edith-roland.fotsing@polymtl.ca
Abstract
The present study deals with the acoustic properties of lime/hemp concrete manufactured by compression molding. In order to efficiently contribute to sustainable development, building materials must consider energy consumption, environmental impact of the chosen materials as well as indoor comfort of the construction. Lime/hemp concrete, a mixture of plant based aggregates and hydraulic aerated binder, has proven to have good mechanical, hygrothermal and thermal isolation properties. Additionally, given the porous nature of hemp particles, lime/hemp concrete can be used as an acoustic absorption material for domestic buildings. For these reasons, lime/hemp concrete has been increasingly used as an environmentally friendly construction material. In this study, acoustic absorption and impedance are characterized for a given lime/hemp mass ratio. The influence of particle orientation (anisotropy), density, thickness, and gradient of density is investigated. While anisotropy does not affect acoustic properties, a gradient of density tends to broaden the frequency range for acoustic absorption. Impedance and absorption coefficient of the material with a density gradient are evaluated experimentally and compared using a model based on the multilayered fluid approach. Finally, it is also shown that the absorption coefficient of lime/hemp concrete can be effectively modeled using the multi-scale approach given a double multi-scale porosity of the hemp particles. The outcome of the present study will help establishing optimal molding parameters to obtain advantageous properties concrete, both for mechanical and acoustical purposes.
Keywords: Lime hemp concrete, compression molding, acoustic absorption, acoustic transmission loss
1 INTRODUCTION
Reducing carbon dioxide emissions is one of the most important steps to protect our environment. One way of achieving this goal is the use of environmental friendly construction materials instead of traditional materials. However, sustainable development requires ecological materials to have good mechanical, thermal and acoustical properties [Samri 2008]. As a mixture of plant based aggregates and hydraulic aerated binder, lime/hemp concrete has proven to be a viable alternative [Cerezo 2005]. Lime/hemp concrete can be used in different ways including filling material for walls, bricks, or floor and roof insulation. This construction material is porous and therefore brings thermal efficiency and reduced unwanted noise. Several studies focusing on the acoustical behavior of lime/hemp have already been published. The influence of a binder (lime) as well as the impact of density, pore size distribution and water content have been analyzed [Gle 2011]. Given the range of porosity and shape of hemp particles, models taking into account the double
porosity were used to characterize the acoustic performance of the material [Gle 2012].
In the present work, a comparative experimental investigation of the influence of anisotropy, gradient of density and thickness is made for lime/hemp concrete produced by compression molding. The acoustic properties including absorption coefficient and transmission loss are measured and discussed. Using the transfer matrix method, the transmission loss of a multilayered lime/hemp concrete material is evaluated and compared to experimental values. Finally, we showed that acoustic behavior can be effectively modeled using a multiscale approach given the distributions of pore size in inter-particle pores, intra-particle pores and intra-binder pores.
2 EXPERIMENTAL PROCEDURES 2.1 Specimens
Using a constant binder to hemp weight ratio, samples were manufactured by compression molding. The mold
consists of a cylindrical steel hollow tube with an internal diameter of 30mm and a 29.8mm diameter piston to apply pressure. The molding was made at ambient temperature using a mechanical testing system (MTS) equipped with a displacement sensor. Samples were classified in different categories: bulk lime-coated particles without compaction, low density, medium and high density samples. The density is evaluated from the compaction level of the concrete: (𝑀ℎ𝑒𝑚𝑝⁄𝜌ℎ𝑒𝑚𝑝+ 𝑀𝑙𝑖𝑚𝑒⁄𝜌𝑙𝑖𝑚𝑒+𝑀𝑤𝑎𝑡𝑒𝑟⁄𝜌𝑤𝑎𝑡𝑒𝑟)/𝑉𝑂,
where M is mass, ρ is density, and VO is the volume of
the sample. Moreover, in order to assess the impact of the hemp particle orientation, samples with particles oriented either parallel or perpendicular to the axis of the cylindrical mold were fabricated. Fig. 1 shows an example of low and high density materials produced by compression molding. Fig. 1 highlights the obvious difference of porosity and density between the two samples. Low, medium, and high density samples were fabricated in 30 mm, 60 mm and 90 mm
thickness to evaluate the impact of thickness on acoustic properties. Samples were also manufactured with a variation of density along the axis; these samples are 60 mm and 90 mm thick. The dimensions and characteristics of all samples are summarized in Table 1.
Fig.1: Example of low-density (a) and high-density (b) lime/concrete samples
Tab. 1: Samples characteristics
Sample Weight (g) Thickness (mm)
Porosity (%) (theoretical)
Compaction level
Density level Particle
orientation
RB 4.4 30.5 88.6 0.114 Low Orth. to axis
ZB 4.4 32.7 89.4 0.106 Low Parallel to axis
RM 8.6 33.5 79.7 0.203 Medium Ortho. to axis
ZM 7.6 33 81.8 0.182 Medium Parallel to axis
RH 13 30.5 66.4 0.336 High Orth. to axis
RM2 15.9 56.8 78.7 0.220 Medium Orth. to axis
RM3 24.9 94 79.1 0.209 Medium Orth. to axis
RBMH 27.36 94.8 77.2 0.228 Gradient of density (discrete) Orth. to axis RG 26.62 87.2 75.9 0.241 Gradient of density (continuous) Orth. to axis
Loose 4.5 30 88.2 0.118 Low Random
RH3 40.5 92.1 65.3 0.347 High Orth. to axis
RH2 27.4 61.6 64.9 0.353 High Ortho to axis
shivB 1.8 30 94 0.058 No compaction Random
2.2 Apparatus
All acoustic tests were performed in a 30 mm diameter impedance tube equipped with two microphones (Fig.2) in absorption configuration [ASTM 2012], to measure the absorption coefficient. Alternatively, the tube was equipped with four microphones (Fig.3) in transmission configuration [ASTM 2009], to measure the transmission loss (TL) of the material. The sample diameter of 30 mm ensures tight fitting in the tube and reduces the risk of sound leakage. All tests were made in the 100Hz-6400Hz frequency range.
Fig. 2: Impedance tube in absorption configuration
Fig. 3: Impedance tube in transmission configuration
3 EXPERIMENTAL RESULTS
As an incident sound wave impinges on a medium, part of the wave can be reflected back, another part is absorbed by the medium, and the rest is transmitted through the medium. Thus, depending on the application sought, sound insulation can be achieved either by absorption and/or by barrier efficiency of the medium. Acoustic absorption is defined by the proportion of incident sound energy that is being transformed into heat due to viscous losses inside the
material. It ranges between 0 and 1, and is more effective in porous and fibrous materials than in single-phase materials. The transmission loss (TL) corresponds to the proportion of incident sound wave energy that does not propagate all the way through a material wall. The acoustic transmission is given in decibels (dB) and is correlated to the thickness and the weight of the material used.
3.1 Absorption coefficient
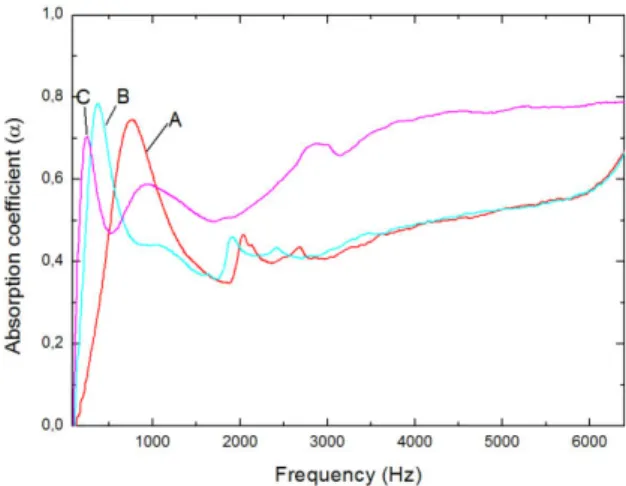
Fig. 4 shows the frequency-dependent coefficient of absorption for samples with low, medium and high density as well as samples with lime–coated randomly distributed hemp particles. For these results, all samples have a thickness around 30 mm. Three samples were tested for each configuration. It can be seen that the maximum acoustic absorption (0.8-1.0) is reached around 1000-1500Hz for samples with loose (curve A), low-density (curve B) and medium density (curve C) mixtures. This is followed by a minimum (0.4-0.6) at mid frequencies. The coefficient stabilizes around 0.7 to 0.9 at high frequencies.
The absorption coefficient decreases while density increases from curve A to curve C (Fig. 4). This result can be explained by the reduction of porosity and increase of air resistivity with increasing compaction pressure. In fact, energy loss due to viscous friction is significantly reduced with increasing density of the sample. This conclusion is confirmed by the high-density samples (curve D) showing a very low absorption coefficient (around 0.25) over the whole frequency range, suggesting that only a fraction of the sound wave is absorbed in the porous concrete, the remaining portion being reflected back to the sound source.
Fig.4: Impact of density on the acoustic absorption; A- Loose (low density), B-RB (low-density),C-RM
(medium density), D-RH (high density).
Fig.5 reveals that the orientation of hemp particles does not have a significant impact on the acoustic absorption coefficient. For instance, low density samples with particles oriented either perpendicular (curve A and curve C) or parallel (curve B and curve D) to the axis of the mold exhibit the same absorption for low and mid frequencies.
Another interesting outcome of this experimental investigation is the expected shift of the maximum absorption towards lower frequencies as the thickness of the sample increases. In Fig.6, the peak shifts from about 760 Hz to 240 Hz for 30 mm samples to 90 mm samples, respectively. In addition, it can be seen that the peak absorption level remains the same during the shift (Fig.6). This suggests that, the thickness of the
lime/hemp concrete can be tailored to target specific frequency range.
Fig. 5: Impact of the orientation of Hemp particles; A-RB (orthogonal to axis, low density), B-ZB(parallel to axis, low density), C-RM(orthogonal to axis, medium
density), D-ZM(parallel to axis, medium density)
Fig.6: Impact of thickness on the acoustic absorption; A-RM (medium density, 33.5mm), B-RM2 (medium density, 60.5mm), C-RM3 (medium density, 94mm).
3.2 Graded materials
Compression molding enables the production of samples with a variation of density through the thickness. In order to assess the impact of this gradient, two types of samples were tested in the impedance tube. The first test was made by inserting three 30mm-thick samples of different densities, with the low density sample nearest to the speaker of the impedance tube. The second test was made on a 90mm-thick sample with implemented increasing density produced by a variation in the compaction pressure. Each variation in the sample was about 30mm thick.
Fig.7 represents the acoustic absorption obtained. It can be observed that either by stacking samples with different density (curve A) or by having a continuous sample with a variation of density (curve B), the absorption frequency range is clearly broadened. In fact, the frequency range corresponding to maximal absorption is larger (curves A and B) than any of the single density samples (curves C, D and E). The minimum absorption is 0.7 (curve A) and 0.6 (curve B), which remains higher than the minima observed for single density samples (curves C, D and E). Finally,
the overall absorption at high frequencies is higher for samples with variation of density.
Fig. 7: Impact of the gradient of density; A-RG (continuous variation), B-RBMH (stacked samples),
C-RH (high density), D-RB (low density), E-RM(medium density).
A close observation reveals that the high density part of the gradient contributes the least to the absorption especially a low frequencies (Fig.7, curve C) whereas the low and medium portion of samples contributes the most in the whole frequency range. The first two maxima of the sample with variation of density correspond roughly to the maxima of the single density sample with low and medium density, respectively. These conclusions suggest that the lime/hemp concrete can be efficiently used as absorbing material by controlling the compaction pressure and thickness of the composite [Glé 2012]. Moreover, frequency range for maximum acoustic absorption can be widened by adjusting the through-the-thickness density of the concrete.
3.3 Transmission Loss
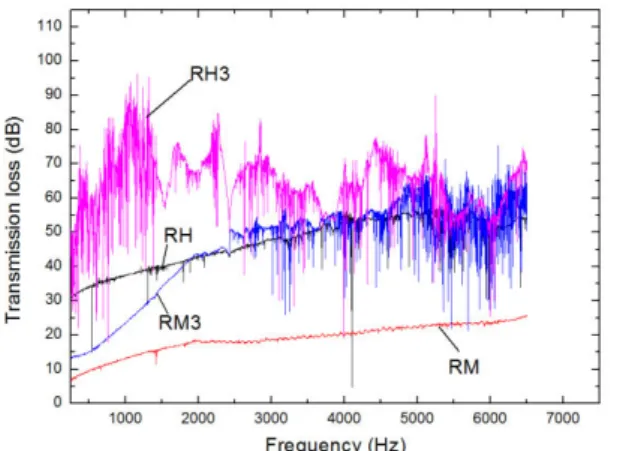
The second sound insulation mechanism is sound barrier, which is characterized by the transmission loss (TL). In this work, analysis involving transmission loss was made using samples with medium and high density. Average TL range roughly from 15 dB to 80 dB for each different sample types, as can be seen on Fig. 8.
Fig. 8: Transmission loss of lime/hemp concrete; RH (high density, 30.5mm), RM (medium density, 33.5mm), RM3 (medium density, 94mm), RH3 (high
density, 92.1mm)
An increase of transmission loss from 20 dB for a medium density sample (RM) to 45 dB for a high density sample (RH) is visible on Fig.8. This is
expected, given the fact that RH samples are heavier than RM samples.
This figure also reveals that the influence of density might be predominant over mass and thickness of the material. In the frequency range between 500 Hz and 2000 Hz, it can be observed that a medium-density sample RM3 with a thickness of 94 mm and a weight of 25 g has a transmission loss lower compared to the high-density sample (RH) with a thickness of 30.5 mm and a mass of 13 g. Finally, the high-density sample RH3 with 92.1 mm in thickness has the highest TL of all samples (around 80dB at 1500Hz). By comparing RM3 with a mass of 24g to RH3 with a mass of 40.5g, it comes out that, although the weight of sample RH3 is only 1.7 times higher than the weight of sample RM3, an increase of almost 60dB is observed at 1000Hz. Given that a doubling of the weight leads to an increase of 6dB of the TL according to the mass law, the result suggests that the acoustic transmission in lime/hemp concrete is influenced not only by the masses, but also by the compaction of the material. Transmission loss seems to stabilize around 50 dB for frequencies above 2500Hz for samples RM3, RH and RH3 suggesting that the impact of the thickness and the density might be less significant at high frequencies.
4 MODELLING
4.1 Transfer Matrix method
The measurement of the normal incidence sound transmission can be made on an impedance tube equipped with four microphones as specified in the ASTM standard E2611 [ASTM 2009]. In this method, the 2X2 transfer matrix of the sample is given by
𝑇 = [𝑇11 𝑇12
𝑇21 𝑇22]. (1) The components of the transfer matrix represent the relationship between sound pressures and particle velocities on the front and back surfaces of the sample. For a multilayer material, the transfer matrix is given by 𝑇 = 𝐴1∗ 𝐴2∗ 𝐴3… ∗ 𝐴𝑛 (2) where Aj is the transfer matrix of each layer
From the transfer matrix, the normal transmission loss of the multilayer material can be calculated by
𝑇𝐿𝑛= 20𝑙𝑜𝑔10|𝑇11+(𝑇12/𝜌0𝑐)+𝜌0𝑐𝑇21+𝑇22
2𝑒𝑗𝑘𝑑 | (3)
where 𝜌0 and c are the density of the air and the speed of sound, respectively, k is the sound wave number in air and d is the thickness of the multilayer material.
In this work, the transfer matrix method was used to assess the transmission loss of configurations that could not be manufactured. Moreover this method enables the prediction of the transmission loss of different configurations and their application potential. Using the transfer matrix obtained experimentally for the 30mm-thick samples of medium (RM) and high density (RH); the transmission loss of 60mm and 90mm-thick samples of different combinations was evaluated.
In this analysis, the transmission loss of HMH, MHM, and HMM multilayer concrete was determined. HMH corresponds to 90mm-thick sample with medium density material sandwiched between two high density materials. MHM is the opposite of the HMH with the
high density material in the middle. HMM consists of two layers of medium density and one layer of high density. Moreover configurations MH, HH and MM were analyzed and compared to the experimental value of the sample RH2 and RM2. MH is 60mm-thick double layer material made of high and medium density materials and HH and MM are 60mm-thick double layer material with high density and medium density materials, respectively.
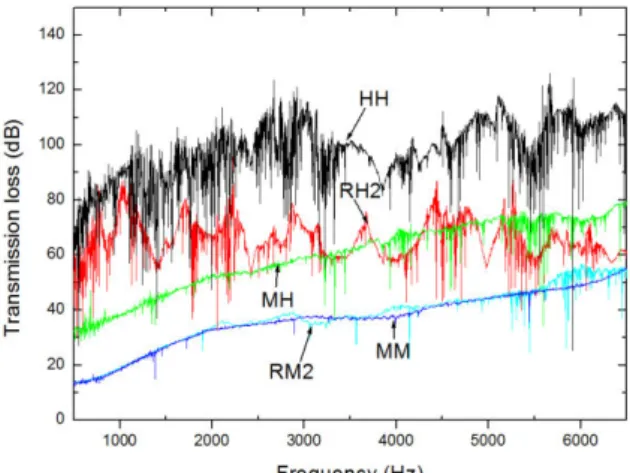
It can be seen on Fig.9 that the TL of the HMM and MHM configurations is practically the same, which means that changing the stacking order of the different layers has little effect on the transmission loss. The HMH configuration, on the other hand, is approximately 20 dB higher than the two other configurations over the whole frequency range, suggesting that the density is the predominant factor.
Fig. 9: Comparison of transmission loss generated by the transfer matrix method and the measured values
for sample with a thickness of 90mm
On Fig. 10, it can be observed that the TL of the generated configuration MM and measured TL for RH2 are similar over the whole frequency range. This result validates the transfer matrix approach used for this study. However, the difference observed between the TL of HH configuration and the measured TL of RH2 is due to the variability in the measurement of the transfer matrix of the individual layer. This suggests that the accuracy of the transfer matrix method relies on the accuracy of the measurement of the single layer properties.
Fig. 10: Comparison of transmission loss generated by the transfer matrix method and the measured values
for sample with a thickness of 60mm
The comparison of samples RH2 and RM2 in Fig. 10 leads to the same conclusion that transmission loss
does not follow the mass law but is controlled by both mass and density. This is particularly true at middle and low frequencies, where the TL of sample RH2 is generally between 20-40 dB higher than the TL of the RM2 sample. This finding is in line with the evolution of the TL for the MH configuration which remains between the TL of samples RM2 and RH2 over the whole frequency range (Fig.10).
4.2 Analytical acoustic model
Past investigations using 3D tomography and a porosimeter showed that hemp can be considered as a granular material and presents two types of porosities: intra-particle porosity and inter-particle porosity [Ceyte 2008] [Beranek 1942]. Intra-particle porosity is characterized by a size ranging between 70 microns and 400 microns whereas inter-particle has an average size of 1 mm. After mixing the hemp with the binder (mixture of aerated and hydraulic lime) the resulting concrete has an additional level of porosity characterized by the intra-binder porosity of about 1 micron. Thus, the acoustic modeling of lime/hemp concrete requires to take into account at least three scales of porosity and the standard Johnson– Champoux-Allard (JCA) [Johnson 1987], [Champoux 1991], [Allard1993] model which assumes a homogeneous distribution of the porosity cannot fully describe such material. Considering that the contribution of intra-binder porosity to the acoustic energy dissipation is negligible [Gle2011], only two porosity levels remain, namely the inter-particle and the intra-particle porosity. Thus, the double porosity model proposed by Olny and Boutin can be applied to the lime/hemp concrete composite.
Only and Boutin [Olny 2003] proposed a model based on equivalent fluid to describe porous medium made of two characteristic sizes, which are in this case: microscopic and mesoscopic. With this approach, the equivalent density 𝜌𝑒𝑞 and the equivalent bulk modulus 𝐾𝑒𝑞 at the macroscopic level can be given by
𝜌𝑒𝑞= (𝜌1 𝑝+ 1−𝜙𝑝 𝜌𝑚 ) −1 (4) where 𝜌𝑝, 𝜌𝑚 are the density in the mesoscopic and microscopic level, and
𝐾𝑒𝑞 = (𝐾1 𝑝+ (1−𝜙𝑝)𝐹𝑑 𝐾𝑚 ) −1 (5) where 𝐾𝑝 𝐾𝑚 are respectively, the bulk modulus in the mesoscopic and microscopic level,
Fd is the diffusion function which equals unity when all
pores take part into the acoustical dissipation and is zero when micro pores do not participate in the dissipation.
𝜙𝑝 is the porosity at the mesoscopic level.
For every level of porosity (i=p, m), the density can be defined following the model proposed by Allard [Allard 1990], [Champoux 1992] and the bulk modulus can be given by the model proposed by Zwikker and Kosten [Zwikker 1949]. 𝜌𝑖=𝜌0𝜙𝛼𝑖∞𝑖−𝑗𝜎𝜔𝑖𝐹(𝜆𝑖) (6) 𝐾𝑖=𝛾𝑃0 𝜙𝑖 (1 + 2(𝛾 − 1) 𝑇(√𝑃𝑟𝜆𝑖√−𝑗) √𝑃𝑟𝜆𝑖√−𝑗 ) −1 (7) where F is a function accounting for the viscosity correction introduced by Biot and is given by
𝐹(𝜆𝑖) = −14𝜆𝑖√−𝑗𝑇(𝜆𝑖√−𝑗)
1−2𝑇(𝜆𝑖√−𝑗)
𝜆𝑖√−𝑗
(8)
𝜆𝑖= 𝑠√8𝛼𝜎∞𝑖𝑖𝜙𝜌𝑖0𝜔 (9) In these equations, T is the ratio between the Bessel function of the first and zero order, 𝜎𝑖 is the airflow resistivity, 𝛼∞𝑖 is the tortuosity, 𝜙𝑖 is the porosity, 𝜌0 is the density of the air, 𝛾 the ratio of specific heats of the air, 𝑃0 the static pressure of the air, 𝑃𝑟 is the Prandtl number of the air, 𝜔 is the pulsation and s is the form factor.
Considering hemp as granular material, empirical models correlating airflow resistivity, porosity and particle size was used. An airflow resistivity model was proposed by Du Plessis and Woudberg [Du Plessis 1987] and Boutin proposed a model for tortuosity [Boutin 2008]. The two analytical models are given by 𝜎𝑖= 𝐴𝜂(1−𝜙𝑖) 2 (34𝜋)3/2𝑅𝑝𝑎𝑟𝑡2 𝜙 𝑖3 (10) 𝛼∞𝑖 =3−𝜙𝑖 2 (11) with 𝐴 = 25.4𝜙𝑖3 (1−𝜙𝑖) 3 2(1−(1−𝜙𝑖) 1 3)(1−(1−𝜙𝑖)2/3)2 (12) 𝝶 is dynamic viscosity of the air and Rpart is equivalent
size of the particles.
The sound absorption can be calculated using the following equation
𝛼 = |𝑍−𝜌0𝑐
𝑍+𝜌0𝑐| (13)
Z is the surface impedance of the sample. In the case of a hard backing of the sample in the impedance tube, Z can be expressed as
𝑍 = −𝑗𝑍𝑐cot (𝑘𝑒) (14) where 𝑍𝑐 is the characteristic impedance of the media and k the wave number of the medium are given by the following expressions:
𝑍𝑐= √𝜌𝑒𝑞𝐾𝑒𝑞 (15)
𝑘 = 𝜔√𝜌𝑒𝑞
𝐾𝑒𝑞 (16)
The modeling procedure was done as follows. The values of density and bulk modulus for each level of porosity were computed from equations (6) and (7) using an analytical relationships for airflow resistivity and tortuosity. These values were used to calculate the equivalent density and bulk modulus (Eqs (4) and (5)) from which the absorption coefficient was determined using equation (13). A fit procedure was made by imposing an average size Rpart of the particle and
varying the diffusion function (Fd) and total porosity. This model was first applied on the hemp particles without binder and without compaction. Fig. 11 shows that an excellent fit of the experimental values of absorption coefficient with numerical values is obtained in the 500-5500 Hz range. The best fit was obtained with an average size particle of 0.5 mm and total porosity of 50% with a diffusion function Fd of 0.2. The small value of the diffusion function indicates that only inter-particle porosity contributes significantly to the dissipation. This finding is in agreement with the conclusion from Glé [Gle 2012] who showed that intra-particle porosity could be neglected. This conclusion
was also motivated by a ratio of nearly 10-3 of the size
of micro-porosity over the size of meso-porosity.
Fig. 11: Comparison between measured and modeled sound absorption for hemp particles without binder
Fig. 12 represents the absorption coefficient for a medium density sample (RM) with a thickness of 33.5 mm. In the same figure, the corresponding absorption obtained from the model is shown as well. The best fit of the model corresponds to an average particle size of 0.5 mm. Diffusion function Fd is close to unity and total porosity is 55%. A value of the diffusion function close to unity suggests that all pores contribute to acoustical dissipation. The fit is considered excellent up to 2700 Hz.
Fig. 12: Comparison between measured and modeled sound absorption for medium-density lime/hemp
concrete
It can be seen on Fig. 11 and Fig. 12 that the proposed model does not fit with experimental values at high frequencies. In both cases, the model underestimate the total porosity. Using the experimental compaction level, porosity of samples was evaluated. For the medium-density sample and the hemp particles sample, the porosity was 80% and 95%, respectively. Discrepancy between modeled and measured values can be explained by the empirical models of airflow resistivity and tortuosity [Venegas 2011]. These models were derived from granular material with spherical or cylindrical particles which does not fully represent the platelet-like geometry of the hemp particles. In the lime/hemp concrete, the low porosity obtained from the model might be due to the presence of a binder that hinders intra-particle porosity and reduces interconnection between pores. Moreover, variability in the experimental measurement also
contributes to differences between the model and experimental values.
Although the proposed model does not yet fully captured the actual evolution of the acoustical absorption coefficient of lime/hemp concrete with respect to frequency, it highlights the importance of the porosity size. More investigation needs to be done to develop analytical models that take into account the exact geometry of hemp particles.
5 SUMMARY
The acoustical absorption and transmission of lime/hemp concrete has been investigated. The influence of orientation of hemp particles, the through- the-thickness variation of density were analyzed and discussed. The following main results were obtained: • Acoustical absorption increases with increasing
density of the concrete.
• Materials with variation of density through the thickness widens the maximum absorption frequency range.
• Increase of transmission loss is due to the combined influence of mass and density. Although transmission loss exhibits a linear behavior over the whole frequency range, it does not follow mass law.
• Acoustical model with double porosity media can be used to characterize the acoustical behavior of lime/hemp concrete if the platelet-like geometry of hemp particles is well defined.
This work is an additional indication that lime/hemp concrete can be used both for acoustic absorption and acoustic insulation. Manufacturing parameters including water content, compaction pressure and orientation of particles can be controlled to produce materials with specific acoustical properties.
6 REFERENCES
[Samri 2008] D. Samri, Analyse physique et caractérisation hygrothermique des matériaux
de construction: approche expérimentale et modélisation numérique. Ph.D. thesis, Ecole doctorale MEGA, Lyon; 2008
[Cerezo 2005] V. Cerezo, Propriétés mécaniques, thermiques et acoustiques d’un matériau a base de particules végétales: approche expérimentale et modélisation théorique. Ph.D. thesis, Ecole doctorale MEGA, Lyon; 2005
[Gle 2012] P. Gle, E. Gourdon, L. Arnaud, Modelling of the acoustical properties of Hemp particles, Construction and building materials, 2012,37,801-811.
[Gle 2011] P. Glé , E. Gourdon, L. Arnaud, Acoustical properties of materials made of vegetable particles with several scales of porosity. Appl. Acoust. 2011,72: 249–59.
[ASTM 2012] Standard Test Method for Impedance and Absorption of Acoustical Materials Using a Tube, Two Microphones and a Digital Frequency Analysis System, ASTM 1050-12, ASTM international, 2012. [ASTM 2009] Standard Test Method for Measurement of Normal Incidence Sound Transmission of Acoustical Materials Based on the Transfer Matrix Method. ASTM E 2611-09. ASTM International, 2009.
[Ceyte 2008] I. Ceyte, Béton de chanvre, définition des caractéristiques mécaniques de la chènevotte. Travail de Fin d’Études, ENTPE 2008:155.
[Beranek 1942] L. Beranek, Acoustic impedance of porous materials. J Acoust Soc Am 1942;13:248–60. [Johnson 1987] D.L. Johnson, J. Koplik,R. Dashen, Theory of dynamic permeability and tortuosity in fluid-saturated porous media. Fluid Mech 1987;176:379– 402.
[Champoux 1991] Y. Champoux, J-F. Allard, Dynamic tortuosity and bulk modulus in air-saturated porous media. Appl Phys 1991;70:1975–9.
[Allard1993] J-F.Allard, Propagation of sound in porous media. Appl Sci 1993:284.
[Olny 2003] X. Olny, C. Boutin, Acoustic wave propagation in double porosity media. J Acoust Soc Am 2003;114(1):73–89.
[Allard 1990] J-F. Allard,C. Depollier, J. Nicolas, W. Lauriks, A. Cops. Propriétés acoustiques des matériaux poreux saturés d’air et théorie de Biot. J Acoust 1990;3:28–30.
[Champoux 1992] Y. Champoux, M-R. Stinson, On acoustical models for sound propagation in rigid frame porous materials and the influence of shape factors. J Acoust Soc Am 1992;92(2):1120–31.
[Zwikker 1949] C. Zwikker, C-W. Kosten, Sound absorbing materials. New-York: Elsevier; 1949. [Du Plessis 1987] J.P. Du Plessis, S. Woudberg, Pore-scale derivation of the Ergun equation to enhance its adaptability and generalization. Chem Eng Sci 2008;63(9):2576–86.
[Boutin 2008] C. Boutin, C. Geindreau, Estimates and bounds of dynamic permeability of granular media. J Acoust Soc Am 2008;124(6):3576–93.
[Venegas 2011] R. Venegas, O. Umnova, Acoustical properties of double porosity granular materials. J. Acoust Soc Am 2011;130(5):2765-76.