HAL Id: hal-00304719
https://hal.archives-ouvertes.fr/hal-00304719
Submitted on 1 Jan 2002
HAL is a multi-disciplinary open access archive for the deposit and dissemination of sci-entific research documents, whether they are pub-lished or not. The documents may come from teaching and research institutions in France or abroad, or from public or private research centers.
L’archive ouverte pluridisciplinaire HAL, est destinée au dépôt et à la diffusion de documents scientifiques de niveau recherche, publiés ou non, émanant des établissements d’enseignement et de recherche français ou étrangers, des laboratoires publics ou privés.
regionalisation of hydrological variables
M. J. Hall, A. W. Minns, A. K. M. Ashrafuzzaman
To cite this version:
M. J. Hall, A. W. Minns, A. K. M. Ashrafuzzaman. The application of data mining techniques for the regionalisation of hydrological variables. Hydrology and Earth System Sciences Discussions, European Geosciences Union, 2002, 6 (4), pp.685-694. �hal-00304719�
The application of data mining techniques for the regionalisation of hydrological variables Hydrology and Earth System Sciences, 6(4), 685–694 (2002) © EGS
The application of data mining techniques for the regionalisation
of hydrological variables
¶M.J. Hall
1, A.W. Minns
2and A.K.M. Ashrafuzzaman
31International Institute for Infrastructural, Hydraulic and Environmental Engineering, PO Box 3015, 2601 DA Delft, The Netherlands 2School of Geoscience,Minerals and Civil Engineering, University of South Australia, Mawson Lakes 5095, Australia
3River Research Institute, Faridpur - 7800, Bangladesh Email for corresponding author: mjh@ihe.nl
Abstract
Flood quantile estimation for ungauged catchment areas continues to be a routine problem faced by the practising Engineering Hydrologist, yet the hydrometric networks in many countries are reducing rather than expanding. The result is an increasing reliance on methods for regionalising hydrological variables. Among the most widely applied techniques is the Method of Residuals, an iterative method of classifying catchment areas by their geographical proximity based upon the application of Multiple Linear Regression Analysis (MLRA). Alternative classification techniques, such as cluster analysis, have also been applied but not on a routine basis. However, hydrological regionalisation can also be regarded as a problem in data mining — a search for useful knowledge and models embedded within large data sets. In particular, Artificial Neural Networks (ANNs) can be applied both to classify catchments according to their geomorphological and climatic characteristics and to relate flow quantiles to those characteristics. This approach has been applied to three data sets from the south-west of England and Wales; to England, Wales and Scotland (EWS); and to the islands of Java and Sumatra in Indonesia. The results demonstrated that hydrologically plausible clusters can be obtained under contrasting conditions of climate. The four classes of catchment found in the EWS data set were found to be compatible with the three classes identified in the earlier study of a smaller data set from south-west England and Wales. Relationships for the parameters of the at-site distribution of annual floods can be developed that are superior to those based upon MLRA in terms of root mean square errors of validation data sets. Indeed, the results from Java and Sumatra demonstrate a clear advantage in reduced root mean square error of the dependent flow variable through recognising the presence of three classes of catchment. Wider evaluation of this methodology is recommended.
Keywords: regionalisation, floods, catchment characteristics, data mining, artificial neural networks
Introduction
Much of the work undertaken by the Engineering Hydrologist is dependent upon the interpretation and manipulation of recorded data. In general, the longer the period of record, the smaller the standard errors of estimate of hydrological design variables, such as flow quantiles. Hydrologists could therefore be said to have a vested interest in maintaining, if not expanding, the size and scope of hydrometric networks. Unfortunately, the attention to hydrometric activities, stimulated by the International
Hydrological Decade from 1965-1974, has not been maintained, and the densities of measuring networks in many countries have decreased owing to a variety of causes, ranging from cost-saving measures to civil unrest. The general deterioration has been such that the World Bank
Policy Paper on Water Resources Management (World
Bank, 1993) observed that inadequate and unreliable data now pose a serious constraint to efficient water management in many countries. The problem is not simply confined to the developing world. According to Lanfear and Hirsch (1999), every year more than 100 US Geological Survey stream gauging stations with more than 30 years of record are being discontinued owing to shortfalls in funding. ¶ Expanded version of a paper presented to the 7th National Hydrology Symposium
of the British Hydrological Society held in Newcastle-upon-Tyne, 4-6 September, 2000.
Hydrologists have responded to this situation of sparse (or even reducing) gauging networks by developing increasingly sophisticated methods for the regionalisation of hydrological variables. In the modern informatic sense of the term, regionalisation provides a ready example of
data mining, which may be broadly defined as the process
of extracting useful knowledge and models from raw data stores. Data mining approaches encompass techniques of regression, classification, clustering, and change and deviation detection, each of which has already been applied in some form in hydrological regionalisation. However, to date, the potential of informatic tools, such as Artificial Neural Networks (ANNs), has not been fully explored. ANNs can be applied both to classify catchments according to their characteristics and to relate the ‘pattern’ of those characteristics to hydrological variables.
In this paper, the experience gained in two recent studies in which ANNs were applied for the regionalisation of flood quantiles is summarised and the results extended. Following a brief discussion of the type of data typically available for regionalisation studies, the configurations of ANNs that can be applied for the purposes of classification of catchments and the development of relationships between flood quantiles and catchment characteristics are described. The results obtained from three case studies relating to the south-west of England and Wales; England, Wales and Scotland; and the islands of Java and Sumatra in Indonesia are then summarised and compared with those obtained from a widely-used approach to hydrological regionalisation based upon Multiple Linear Regression Analysis (MLRA). The concluding section emphasises the advantages of applying ANNs and indicates the possible scope for further refinement.
Regionalisation
In attempting to regionalise a given set of hydrological variables, the engineering hydrologist is faced with a diversity of data. The required outputs of the regionalisation procedure are the values of the dependent variables as computed from the available records at the gauged sites within the region of interest. The inputs are those catchment and rainfall characteristics that are deemed to be influential in determining the magnitude of the desired outputs. The latter are usually confined to variables that can be derived from topographic maps of a consistent scale and date, or meteorological variables that are similarly mapped for climatological or engineering design purposes. The former may be further subdivided into those variables that describe the geomorphology of the catchment and those that pertain to its land use. The latter is most frequently described in
terms of indices of the form
+ = Area Total Activity of Area INDEX 1 (1)
Dating of the mapping employed is obviously critical, bearing in mind the rapidity of such processes as urbanisation, deforestation or the intensification of agriculture. The potential use of satellite imagery for this purpose has yet to be explored fully, but depends upon the further development of the appropriate tools and algorithms for converting emitted and reflected radiances into hydrologically relevant products. The scope of such indices is very broad, and their relative hydrological importance varies from climate to climate. Their choice is often heavily dependent upon the personal intuition of the analyst.
In contrast, the geomorphological descriptors of a catchment are widely known, but their inter-relationships are perhaps less well appreciated. The high explained variance of area, AREA, as a predictor of main stream length, MSL, (Hack’s Law) calls into question the intrinsic value of derived variables, such as catchment form factor or SHAPE (the quotient of AREA and the square of MSL). There are many different ways of defining certain variables, such as main channel slope, but consistency in methods of extraction is possibly more important than selection of one particular form over another. The bifurcation, area and length ratios of the channel network are considered only infrequently, perhaps because of the time and effort required to compute their values for a large number of catchments. This constraint can, of course, be avoided if the analyses can be carried out using automated procedures on a digital elevation model.
In summary, the data forming the basis of a regionalisation study can be messy in the sense of variety of origin and method of computation. The hydrological variables themselves will often have been derived from different lengths of record, and maps to a common (relatively large) scale are not always available. However, the studies reported herein have been based upon published data from previous work (NERC, 1975; Institute of Hydrology and Direktorat Penyelidikan Masalah Air, 1983; Gustard et al., 1989; the current FRIEND European Water Archive) in which a high degree of quality control has been exercised. The questions to be answered by the analysis of these data are essentially two-fold:
(1) Are the catchments to be analysed hydrologically homogeneous in the sense of belonging to one “region”? (2) Can some form of relationship be developed between the hydrological variables of interest and the (mapped) catchment and rainfall characteristics?
The application of data mining techniques for the regionalisation of hydrological variables
Question (1) is a matter of classification, whereas (2) requires the modelling of dependencies. Perhaps the most widely-applied procedure for hydrological regionalisation applied to date has been the so-called Method of Residuals, in which the classification and modelling are carried out simultaneously, with the appropriate models being developed by application of MLRA. Introduced by the US Geological Survey (see Dalrymple, 1960; Benson, 1962), this methodology has been widely adopted, most notably in the development of estimation procedures for ungauged catchments in the UK Flood Studies Report (FSR) (NERC, 1975). In brief:
i. the hydrological index variable (quantile) is regressed upon catchment and rainfall characteristics for the whole data set;
ii. the residuals, i.e. the differences between the observed and computed values of the index variable, are plotted geographically in order to identify groups of these differences that are similar in both magnitude and sign and can therefore be regarded as a sub-region; and iii. the regression analysis is repeated for the sub-regions
identified and then generalised across the whole region. The heavy dependence on geographical proximity in defining the sub-regions has often been criticised, and many authors have turned to the use of multivariate techniques, such as cluster analysis to define homogeneous regions and
discriminant analysis to allocate an ungauged catchment to
an appropriate region. However, any group of variables is capable of yielding clusters, and different groupings can be
obtained if different algorithms and distance measures are adopted (see Nathan and McMahon, 1990, for a more detailed discussion). Nevertheless, the possibility that sites do not have to be geographically contiguous to form a sub-region remains intuitively appealing. Furthermore, MLRA is constrained by the linearity assumption, which the transformation of variables can mitigate but not entirely eliminate. A possible alternative approach can be found in the pattern classification and feature detection capabilities of modern informatic tools, such as ANNs.
Artificial neural networks
An ANN consists of layers of processing units (to invoke the biological analogy, representing neurons) where each processing unit, or node, in each layer is connected to all nodes in the adjacent layers (representing biological synapses and dendrites). The selection of an appropriate architecture for the ANN depends upon the problem in hand and the type of learning algorithm (i.e. calibration procedure) to be applied. For example, a Kohonen network is commonly used for the classification of patterns in data sets. Since no outputs are provided for training purposes, the process of determining the weights is referred to as
unsupervised learning. More generally, ANNs can be trained (i.e. calibrated) to provide the correct output
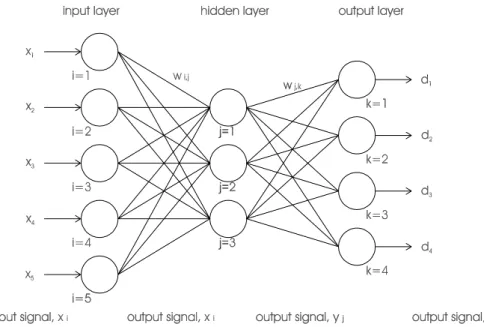
response to a given input stimulus (supervised learning). For this purpose, a multi-layer, feed-forward, perceptron-type ANN (MLP) has been found particularly suitable. Figure 1 illustrates the schematisation of a typical, three-layer MLP network of this type.
The functioning of an ANN is perhaps best described by following the sequence of operations involved during training and implementation of the MLP network shown in Fig. 1. The vector of inputs is introduced at the nodes of the input layer. Each of these input nodes is connected directly to all nodes in the second, or hidden layer, and the signals carried along these connections can either be amplified or inhibited by application of weights. Each of the hidden nodes in this second layer acts as a summation device for the incoming (weighted) signals. The total signal is then transformed into an output signal using an activation
function, typically a sigmoidal function, which restricts the
range of the output signal to a zero-to-one interval. The output signals from the hidden nodes in the hidden layer are in turn carried along weighted connections to the nodes in the output layer. If the ANN is to be trained to learn the relationship between a given set of inputs and outputs, then the weights must be adjusted iteratively until the computed and observed outputs agree within a predetermined level of accuracy using a standard algorithm. Although back
propagation is one of the most widely-used algorithms, there
are several different methods for weight optimisation, some of which have better generalisation abilities than others (see Maier and Dandy, 2000, for a comprehensive discussion).
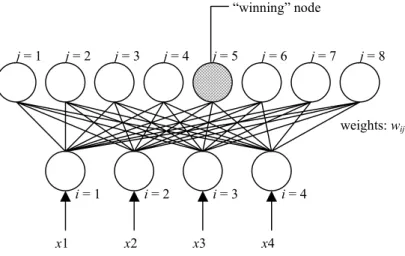
In contrast to the MLP network of Fig. 1, the Kohonen network, also referred to as a self-organising feature map (SOFM), requires no outputs for training purposes. This ANN is a classifying device that has only one layer of input nodes, one of output nodes and a set of weighted connections (Fig. 2). The network has to ‘decide’ which of the output nodes (i.e. the ‘winner’) is associated with a given input pattern, based upon a measure of similarity, such as Euclidean distance. In brief, the weight vectors are initialised with randomly selected values, and the first input pattern is
presented to the network. The input pattern is compared to all the weight vectors using Euclidean distance, and the most similar vector and its output unit are selected. The ‘winner’ and its neighbours have their weight vectors updated so that they are moved closer to the input pattern. This pattern is repeatedly presented until the change in the weight vectors is smaller than a predefined threshold. A new input pattern is then presented, and the procedure is repeated. Similar input patterns ‘fire’ output nodes that are close together. In effect, each frequently-fired node defines a ‘class’ (although a group of adjacent nodes is usually the preferred choice for an individual class), and the input vectors that fire that node are the members of that class.
The neural network software employed in this work for both MLPs and SOFMs was the NeuroSolutions simulation environment developed by NeuroDimensions Inc. of Florida.
Regionalisation with ANNs
CLASSIFICATION OF CATCHMENTS
Hall and Minns (1999) applied a Kohonen network to classify 101 catchments in the south-west of England and Wales using five catchment characteristics listed in Volume II of the FREND Study (Gustard et al., 1989), supplemented by Volume IV of the FSR (NERC, 1975). The five characteristics were AREA in km2, MSL in km, main stream
slope in m km–1 (S1085), mean annual rainfall in mm (AAR)
and a soil index (SOIL). Values for the urbanisation index, URBAN, were also available, but were not included owing to the small range of values involved. Initially, the values were standardised to range between zero and one prior to analysis. However, in later work, the values were
j = 2 i = 2 i = 3 i = 4 x1 x2 x3 x4 j = 3 j = 4 j = 5 j = 6 j = 7 j = 8 j = 1 weights: wij “winning” node i = 1
The application of data mining techniques for the regionalisation of hydrological variables
standardised to zero mean and unit standard deviation, as recommended by Kohonen (1995). Euclidean distance was used as the similarity measure. As noted above, the procedure for training a Kohonen network also involves the repeated presentation of the input data (catchment characteristics) until the output response has stabilised and the changes in the weights are negligible.
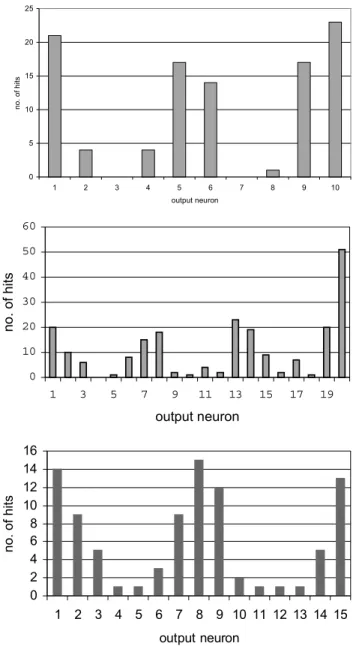
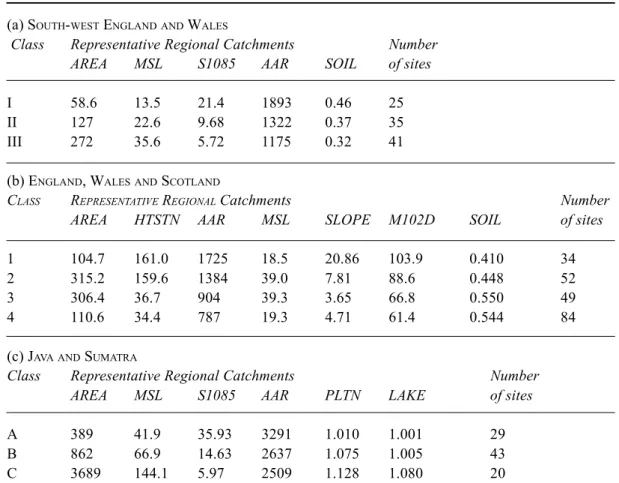
In this application, with 101 input patterns and two or more classes to be expected, the number of output nodes should be at least three times the number of classes anticipated. Ten output nodes were therefore adopted in a linear Kohonen network. The results are summarised in Fig. 3(a), which reveals a distinct clustering around three sets of adjacent output nodes. These ‘classes’ contain 25, 35 and 41 members, respectively. Of particular interest are the standardised cluster centres in Euclidean space for each grouping, which define what might be termed Representative
Regional Catchments (RRCs). The de-standardised
catchment characteristics for each of the three RRCs are summarised in Table 1(a), which shows that the variations between classes are essentially monotonic. In effect, Class I is composed of relatively small, steep catchments with approaching 2000 mm of average annual rainfall and a high SOIL index, and Class III represents larger, relatively flat areas with about 1100 mm of average annual rainfall and a notably smaller SOIL index. The Class II characteristics are intermediate between those of Classes I and III. Such groupings, and especially Classes I and III, are supportable from the hydrological viewpoint, i.e. small, steep catchments are expected to possess different response characteristics to large, flat drainage areas, which is a gratifying result for an unsupervised learning technique.
This division of the 101 catchments into three classes, each of which contained representatives from both south-west England and Wales may be compared with the regionalisation of the same areas adopted in the FSR. (NERC, 1975). In the Report, south-west England and Wales are two distinct regions divided at the Bristol Channel, each of which has both a different equation for the estimation of the mean annual flood and a different growth curve connecting the ratio of the T-year flood to the mean annual flood to the return period, T.
Divergence between the SOFM and FSR classifications, the latter based upon the Method of Residuals, prompted a further study in which a new data set was compiled for the whole of England, Wales and Scotland. These new data were obtained from the catalogue of the FRIEND European Water Archive, from which seven catchment characteristics could be extracted for 219 catchments. These characteristics included AREA (km2), MSL (km), AAR (mm), SLOPE (m
km–1), station height (HTSTN, m), a soil index (SOIL) and
the 10-year, 2-day rainfall depth (M102D, mm). For the classification of this data set, 20 output nodes and seven input nodes were employed for the linear Kohonen network. Again, Euclidean distance was used as the similarity measure. The results are summarised in the count map of Fig. 3(b), and indicate the existence of four classes. The RRCs corresponding to each of these classes are summarised in Table 1(b), which shows that small, steep catchments are now divided into two classes: one with low soil index and high AAR in the uplands, and the second with high soil index and low AAR in the lowlands. In addition, the larger catchments are divided between two classes, representing
0 5 10 15 20 25 1 2 3 4 5 6 7 8 9 10 output neuron no. of hits 0 10 20 30 40 50 60 1 3 5 7 9 11 13 15 17 19 output neuron no. of hits 0 2 4 6 8 10 12 14 16 1 2 3 4 5 6 7 8 9 10 11 12 13 14 15 output neuron no. of hits
Fig. 3. Count maps for linear Kohonen networks for (a) five
catchment characteristics from south-west England and Wales; (b) seven catchment characteristics for England, Wales and Scotland; and (c) six catchment characteristics for Java and Sumatra.
Table 1. Classification of catchments by Kohonen network, with numbers allocated and the characteristics of the Representative Regional catchments for each class
(a) SOUTH-WEST ENGLANDAND WALES
Class Representative Regional Catchments Number
AREA MSL S1085 AAR SOIL of sites
I 58.6 13.5 21.4 1893 0.46 25
II 127 22.6 9.68 1322 0.37 35
III 272 35.6 5.72 1175 0.32 41
(b) ENGLAND, WALESAND SCOTLAND
CLASS REPRESENTATIVE REGIONAL Catchments Number
AREA HTSTN AAR MSL SLOPE M102D SOIL of sites
1 104.7 161.0 1725 18.5 20.86 103.9 0.410 34
2 315.2 159.6 1384 39.0 7.81 88.6 0.448 52
3 306.4 36.7 904 39.3 3.65 66.8 0.550 49
4 110.6 34.4 787 19.3 4.71 61.4 0.544 84
(c) JAVAAND SUMATRA
Class Representative Regional Catchments Number
AREA MSL S1085 AAR PLTN LAKE of sites
A 389 41.9 35.93 3291 1.010 1.001 29
B 862 66.9 14.63 2637 1.075 1.005 43
C 3689 144.1 5.97 2509 1.128 1.080 20
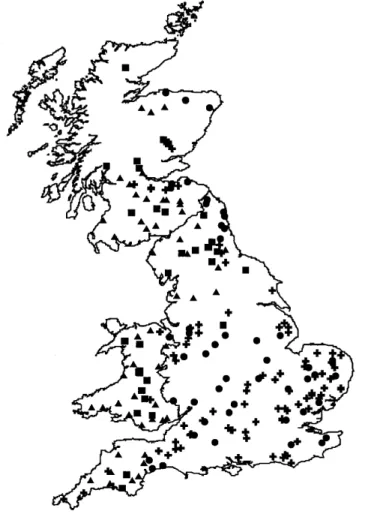
similar sizes and slopes of lowland catchments but distinct AAR and M102D values and SOIL indices. A geographical plot of the classes, presented in Fig. 4, shows that the Midlands and the south-east of England contain only two classes of catchment, compared with four geographical FSR regions. Of further interest is the occurrence of three classes in south-west England and Wales, thereby confirming the results of the previous study.
Additional support for the spatial distribution of the classes shown in Fig. 4 can be found in the attempts to define coherent precipitation regions for the British Isles. For example, Gregory (1975) applied a variety of methods based on linkage analysis and factor analysis techniques, but found that the results obtained depended upon the technique applied. The direct solution of a principal component analysis gave regions with a distinct north-south orientation, whereas an obliquely-rotated solution provided boundaries running predominantly south-west to north-east and to a lesser extent from west to east. Regions of coherent precipitation variability have also been defined by Jones et
al. (1997). Their nine regions are depicted in Fig. 5, which
shows that indeed south-west England and Wales form one
region designated SWE. Those authors also presented the correlations, one region at a time, for all nine areas. Their results indicated that western regions correlate most closely with western regions, and similarly for eastern regions, emphasising once again a north-south orientation of boundaries that relates to the frontal nature of the majority of precipitation in the British Isles. The Scottish regions are only weakly correlated with the regions in England and Wales, with northern Scotland (NS) showing the least correlation with all other regions. In contrast, north-west England (NW) provided the highest correlations with the other eight regions.
A third study (Hall et al., 2000) has recently been carried out on data from the contrasting climate of Java and Sumatra, obtained from the Flood Design Manual for Java and
Sumatra (Institute of Hydrology and Direktorat
Penyelidikan Masalah Air, 1983). The Data Appendix to the Manual provides information on the floods recorded at 50 sites in Java and 83 in Sumatra, along with 11 catchment characteristics for each site. These data represent the situation typical of a developing country, with the majority of records being over a short time span. For this exercise,
The application of data mining techniques for the regionalisation of hydrological variables
attention was concentrated on the 48 sites in Java and the 44 in Sumatra suitable for annual flood analysis. Only six catchment characteristics (AREA, MSL, S1085, AAR along with lake and plantation indices) were retained for classification purposes. Euclidean distance was used as the distance measure and the data were mapped on to 15 output neurons in a linear Kohonen network. The most consistent and stable groupings obtained are summarised as a count map in Fig. 3(c), and the characteristics of the RRCs are shown in Table 1(c). The ‘small’ and ‘large’ groupings of catchments are again evident, but the annual rainfall totals are notably larger than in the previous case. Each class contains representatives from both Java and Sumatra. When the Method of Residuals was applied to the same data set, a four-variable equation for the mean annual flood (MAF, m3s–1) was obtained:
(2)
where PLTN and LAKE are plantation and lake indices respectively, defined as in Eqn. (1). When the residuals from Eqn. (2) were mapped, no discernable pattern emerged, in agreement with Institute of Hydrology and Direktorat Penyelidikan Masalah Air, (1983).
RELATION OF FLOOD QUANTILES TO CATCHMENT CHARACTERISTICS
In the Method of Residuals, the magnitude of an index flood is often related to selected catchment characteristics using MLRA. An MLP can also be used to relate the same sets of variables. For example, Muttiah et al., (1997) developed neural network models to relate the magnitude of the two-year flood to catchment area, average annual precipitation and mean basin elevation, all variables being transformed logarithmically. A similar approach was applied by Hall and Minns (1998) to relate the location and scale parameters of the Extreme Value Type I (EVI or Gumbel) distribution to six catchment characteristics (AREA, MSL, S1085, AAR, SOIL, URBAN) for the data from the south-west of England and Wales. The three-layer MLPs were trained by back Fig. 4. Classification of 219 catchments in England Wales and
Scotland by Kohonen network. The squares represent Class I, the triangles Class II; the circles Class III; and the upright crosses Class IV (see Table 1(b) for the corresponding Representative
Regional Catchments). 241 . 1 78 . 0 00013 . 0 = AREA AAR MAF 282 . 2 769 . 1 (1 ) ) 1 ( +PLTN − +LAKE −
Fig. 5. Regions of coherent precipitation variability for the British
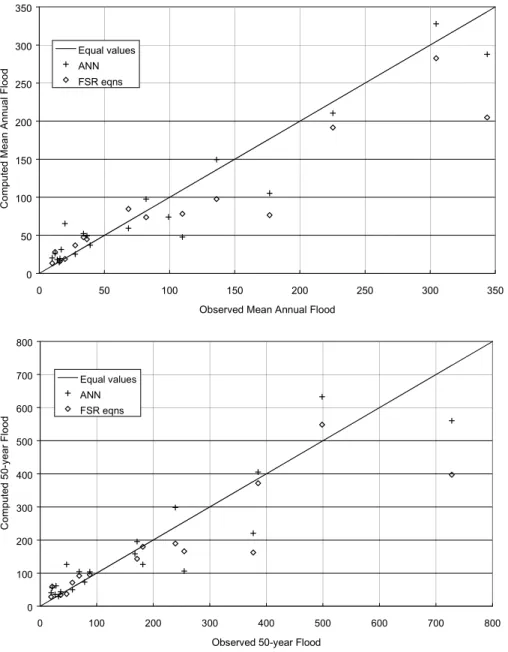
propagation on 81 sites, with another 20 sites reserved for testing purposes. Since the data set was relatively small, no records were reserved specifically for cross-validation, but care was taken in determining the appropriate number of nodes in the hidden layer to avoid over-training. For 15 of the 20 verification sites, mean annual and 50-year floods could also be estimated using the FSR ‘mean annual flood plus growth curve approach’ (NERC, 1975). The results showed that the root mean square error (RMSE) of the ANN estimates were 39 per cent lower for the mean annual flood and 30 per cent lower for the 50-year flood than the FSR estimates. The results are reproduced in Figs. 6(a) and 6(b) for the mean annual flood and the 50-year flood respectively. A similar approach was applied to the data for Java and
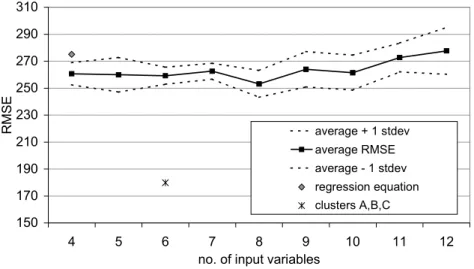
Sumatra (Hall et al., 2000), training ANNs on 66 sites with another 25 used for verification purposes, with between 4 and 12 input catchment characteristics and the same two EVI parameters as outputs. The results are summarised in Fig. 7, which shows the variation of RMSE with number of independent variables. Each MLP was trained ten times with different randomised starting values for the weights, and some indication of the scatter is given by the band denoting plus and minus one standard deviation about the average RMSE. The best result in terms of the RMSE of the mean annual floods for the verification data set was obtained with eight catchment characteristics, but the improvement in RMSE over the regression equation (Eqn. (2) above) derived for 92 catchments was only marginal. However, when the
0 50 100 150 200 250 300 350 0 50 100 150 200 250 300 350
Observed Mean Annual Flood
Computed Mean Annual Flood
Equal values ANN FSR eqns 0 100 200 300 400 500 600 700 800 0 100 200 300 400 500 600 700 800
Observed 50-year Flood
Computed 50-year Flood
Equal values ANN FSR eqns
Fig. 6. Plots of computed versus observed floods for selected sites in FSR Regions 8 and 9:
The application of data mining techniques for the regionalisation of hydrological variables
data set was divided into the three classes as indicated by the Kohonen network analysis summarised above, retaining the same catchments for training and verification, the RMSE for the mean annual flood was reduced to 65 per cent of that obtained by applying the regression equation. There are therefore considerable benefits to be gained from pursuing the sub-division of the original data set according to the results of the SOFM classification, in contrast to the absence of discernable sub-regions in the results from applying the Method of Residuals. Further confirmation of the benefits of classification could be obtained by repeating the analysis with random selections of catchments forming the regions, but at the time of writing this exercise has not been undertaken.
Concluding remarks
The FSR (NERC, 1975; Vol I, Section 4.3.10), provided a simple method for evaluating the ‘worth’ in terms of the equivalent number of years of record, N, of a regression estimate of a flow quantile. Using this approach, in which the standard error of the (log) estimate is equated to the quotient of the (regional) coefficient of variation of annual floods and the square root of N, the equivalent record length is usually of the order of only one year. There is therefore considerable scope for improvement in the precision of regionalised flood quantile estimates. Such improvements can be sought in the two distinct steps of demarcating regions of similar flood behaviour and then relating catchment and rainfall characteristics to index flood magnitudes. In the widely used Method of Residuals, the two steps are applied iteratively, with the purpose of identifying geographical clusters of sites with similar magnitudes and signs of the
differences between observed and estimated index floods. For the data sets from Indonesia, this approach failed to provide any evidence of such sub-regions, even when the islands of Java and Sumatra were considered separately.
In contrast, when the data sets were analysed using a data mining technique involving unsupervised learning, three classes of catchment were identified for both Indonesia and south-west England and Wales, and four for England Scotland and Wales. The technique applied was the Kohonen network, which in practice is more of a data sorting algorithm than a data classification tool (see Kohonen, 1995). The results obtained therefore often display distinct monotonic changes in the magnitude of the input variables between classes (see Table 1). In hydrological terms, the groupings separated the small, steep, high rainfall catchments from the large, flat, lower rainfall drainage basins. Similar sub-divisions (but with obviously different RRCs) were observed in the two contrasting climates of the British Isles and Indonesia. With a sample of the order of 50–100 catchments, a third intermediate class of drainage area consistently emerges with characteristics that are intermediate between the first two. When a data set of over 200 catchments for England, Wales and Scotland was analysed, the intermediate classes were better differentiated. Seemingly, the pooling of larger regional data sets leads to more supportable classifications of catchments.
In the analyses reported above, the input catchment descriptors were limited to those for which data were either already available or could be analysed with a reasonable expenditure of time and effort. The possibility remains that other descriptors might be introduced that would assist in defining the intermediate class more clearly. The application of a fuzzy classification technique to south-west England
150 170 190 210 230 250 270 290 310 4 5 6 7 8 9 10 11 12
no. of input variables
RMSE average + 1 stdev
average RMSE average - 1 stdev regression equation clusters A,B,C
Fig. 7. Root mean square error for mean annual floods for Java and Sumatra computed from
and Wales (Hall and Minns, 1999) demonstrated similar groupings of sites to the Kohonen network, but provided additional evidence of shared membership when three classes were postulated.
The properties of MLP-type ANNs as universal function approximators are well known (see, for example, Hornik et
al., 1989), and therefore the extra ‘worth’ in the
improvement in RSMEs of flood quantiles from verification data sets obtained with ANNs when compared with multiple linear regression equations is not unexpected. However, a particular advantage of the ANN approach is that the parameters of a specified form of frequency distribution can be chosen as network outputs in preference to the magnitude of a single flood quantile, thereby avoiding the additional complication of developing a regional growth curve.
References
Benson, M.A., 1962. Factors influencing the occurrence of floods
in a humid region of diverse terrain. US Geol. Survey,
Water-Supply Paper 1580-B, 64 pp.
Dalrymple, T., 1960. Flood frequency analysis. US Geol. Survey, Water-Supply Paper 1543-A, 80 pp.
Gregory, S., 1975. On the delimitation of regional patterns of recent climatic fluctuations. Weather, 30, 276–287.
Gustard, A., Roald, L.A., Demuth, S., Lumadjeng, H.S. and Gross, R., 1989. Flow regimes from experimental and network data
(FREND), Vol. II Hydrological data. Institute of Hydrology,
Wallingford, UK.
Hall, M.J. and Minns, A.W., 1998. Regional flood frequency analysis using artificial neural networks. In: Proc. 3rd Int. Conf. on Hydroinformatics (Copenhagen, Denmark), V. Babovic and
L.C. Larsen (Eds.). Balkema, Rotterdam, Vol. 2, 759–763.
Hall, M.J. and Minns, A.W., 1999. The classification of hydrologically homogeneous regions. Hydrolog. Sci. J., 44, 693–704.
Hall, M.J., Minns, A.W. and Ashrafuzzaman, A.K.M., 2000. Regional flood frequency analysis using artificial neural networks: a case study. In: Proc. 4th Int. Conf. on
Hydroinformatics (Cedar Rapids, USA).
Hornik, K., Stinchcombe, M. and White, H., 1989. Multilayer feedforward networks are universal approximators. Neural
Networks, 2, 359–366.
Institute of Hydrology and Direktorat Penyelidikan Masalah Air, 1983. Flood Design Manual for Java and Sumatra. Institute of Hydrology, Wallingford, UK and DPMA, Bandung, 2 Vols. Jones, P.D., Conway, D. and Briffa, K.R., 1997. Precipitation
variability and drought. In: Climates of the British Isles. Present,
past and future, M. Hulme and E. Barrow (Eds.). Routledge,
London, 197–219.
Kohonen, T., 1995. Self Organising Maps. Springer, Berlin. Lanfear, K.J. and Hirsch, R.M., 1999. USGS study reveals a
decline in long-record streamgauges. EOS, Trans. Amer.
Geophys. Union, 80, 605–607.
Maier, H.R. and Dandy, G.C., 2000. Neural networks for the prediction and forecasting of water resources variables: a review of modelling issues and applications. J. Environ. Model.
Software, 15, 101–124.
Muttiah, R.S., Srinivasan, R. and Allen, P.M., 1997. Prediction of two-year peak stream discharges using neural networks. J. Amer.
Water Resour. Assoc., 33, 625–630.
Nathan, R.J. and McMahon, T.A., 1990. Identification of homogeneous regions for the purposes of regionalisation. J.
Hydrol., 121, 217–238.
NERC, 1975. Flood studies report, 5 Vols. NERC, London, UK. World Bank, 1993. Water Resources Management. A World Bank
