HAL Id: hal-00330268
https://hal.archives-ouvertes.fr/hal-00330268
Submitted on 17 Sep 2007HAL is a multi-disciplinary open access
archive for the deposit and dissemination of sci-entific research documents, whether they are pub-lished or not. The documents may come from teaching and research institutions in France or abroad, or from public or private research centers.
L’archive ouverte pluridisciplinaire HAL, est destinée au dépôt et à la diffusion de documents scientifiques de niveau recherche, publiés ou non, émanant des établissements d’enseignement et de recherche français ou étrangers, des laboratoires publics ou privés.
Calcite production by Coccolithophores in the South
East Pacific Ocean: from desert to jungle
L. Beaufort, M. Couapel, N. Buchet, Hervé Claustre
To cite this version:
L. Beaufort, M. Couapel, N. Buchet, Hervé Claustre. Calcite production by Coccolithophores in the South East Pacific Ocean: from desert to jungle. Biogeosciences Discussions, European Geosciences Union, 2007, 4 (5), pp.3267-3299. �hal-00330268�
BGD
4, 3267–3299, 2007 Coccolithophores calcite production L. Beaufort et al. Title Page Abstract Introduction Conclusions References Tables Figures ◭ ◮ ◭ ◮ Back CloseFull Screen / Esc
Printer-friendly Version Interactive Discussion
EGU
Biogeosciences Discuss., 4, 3267–3299, 2007 www.biogeosciences-discuss.net/4/3267/2007/ © Author(s) 2007. This work is licensed
under a Creative Commons License.
Biogeosciences Discussions
Biogeosciences Discussions is the access reviewed discussion forum of Biogeosciences
Calcite production by Coccolithophores
in the South East Pacific Ocean: from
desert to jungle
L. Beaufort1, M. Couapel1, N. Buchet1, and H. Claustre2
1
CEREGE, Universit ´es Aix-Marseille- CNRS, BP80 cedex 4, 13545 Aix en Provence, France 2
Laboratoire d’oc ´eanographie de Villefranche, CNRS – Universit ´e Pierre et Marie Curie-Paris 6, 06230 Villefranche-sur-Mer, France
Received: 5 September 2007 – Accepted: 5 September 2007 – Published: 17 September 2007
BGD
4, 3267–3299, 2007 Coccolithophores calcite production L. Beaufort et al. Title Page Abstract Introduction Conclusions References Tables Figures ◭ ◮ ◭ ◮ Back CloseFull Screen / Esc
Printer-friendly Version Interactive Discussion
EGU
Abstract
BIOSOPE cruise achieved an oceanographic transect from the Marquise Islands to the Peru-Chili upwelling (PCU) via the centre of the South Pacific Gyre (SPG). Water samples from 6 depths in the euphotic zone were collected at 20 stations. The concen-trations of suspended calcite particles, coccolithophores cells and detached coccoliths 5
were estimated together with size and weight using an automatic polarizing micro-scope, a digital camera, and a collection of softwares performing morphometry and pattern recognition. Some of these softwares are new and described here for the first time. The coccolithophores standing stocks are usually low and reach maxima west of the PCU. The coccoliths of Emiliania huxleyi, Gephyrocapsa spp. and Crenalithus 10
spp. (Order Isochrysidales) represent 50% of all the suspended calcite particles de-tected in the size range 0.1–46µm (21% of PIC in term of the calcite weight). The
latter species are found to grow preferentially in the Chlorophyll maximum zone. In the SPG their maximum concentrations was found to occur between 150 and 200 m, which is very deep for these taxa. The weight and size of coccoliths and coccospheres are 15
correlated. Large and heavy coccoliths and coccospheres are found in the regions with relative higher fertility in the Marquises Island and in the PCU. Small and light coccol-iths and coccospheres are found west of the PCU. This distribution may correspond to that of the concentration of calcium and carbonate ions.
1 Introduction
20
The coccolithophores represent an important group of unicellular algae. They are found in abundance from high latitudes where they form large blooms which are detected by satellites (Balch et al., 2007; Brown and Yoder, 1994), at low latitudes both in olig-otrophic (e.g. Okada and McIntyre, 1979) and upwelling (e.g. Giraudeau and Bailley, 1995) zones. They are responsible for about half of the total oceanic carbonate pro-25
aggre-BGD
4, 3267–3299, 2007 Coccolithophores calcite production L. Beaufort et al. Title Page Abstract Introduction Conclusions References Tables Figures ◭ ◮ ◭ ◮ Back CloseFull Screen / Esc
Printer-friendly Version Interactive Discussion
EGU
gates containing organic mater), burial, and dissolution are key processes for charac-terizing the oceanic carbon cycle (e.g., Archer et al., 2000). Yet, despite their major role in the CO2cycle, many aspects of calcite production by the coccolithophores are
poorly known. In particular the environmental effects on the secretion of coccoliths are poorly understood because of the small number of direct field observations (Balch 5
and Kilpatrick, 1996). Several laboratory and mesocosms experiments have shown a decrease in the production of calcium carbonate by the coccolithophores under in-creasing CO2(e.g. Engel et al., 2005; Riebesell et al., 2000). The increase of CO2 in the atmosphere will results in a decrease of the pH of oceanic waters, which may have dramatic consequences on oceanic calcifiers (Felly et al., 2004; Orr et al., 2005). It 10
is therefore urgent to analyse in greater detail how coccolithophores are calcifying in Today’s Ocean.
The South Pacific Gyre (SPG) is the most oligotrophic zone in Today’s Ocean, and it is one of sparsely sampled open ocean area (Claustre and Maritorena, 2003), in par-ticular for coccolithophores. The primary objective of BIOSOPE was to study the South 15
Pacific Gyre along a transect through the central part of the SPG to the Peru-Chili Up-welling (PCU). We document here the variations of the coccolithophore standing stock along this transect, as well as the absolute abundance of detached coccoliths and of other small suspended calcite particles. We also study their size and weight, in order to describe how coccolithophore are calcifying in opposite natural trophic environments. 20
We use methods we developed recently based both on the microscopy automation and the polarizing characteristics of calcite mineral. Some of the softwares used are described here for the first time.
BGD
4, 3267–3299, 2007 Coccolithophores calcite production L. Beaufort et al. Title Page Abstract Introduction Conclusions References Tables Figures ◭ ◮ ◭ ◮ Back CloseFull Screen / Esc
Printer-friendly Version Interactive Discussion
EGU
2 Material and methods
2.1 Setting
The BIOSOPE cruise in the southern Pacific, on board the French Research Vessel l’Atalante (26 October to 11 December 2004) completed a transect of about 8000 km that began in the mesotrophic waters west of the Marquises archipelago and ended in 5
the eutrophic waters off the coastal waters of Chile (Fig. 1). This represents the largest possible trophic gradient that can be investigated in today’s world ocean. The South Pacific Gyre (SPG) is the most oligotrophic region of the world’s ocean. Two features may explain why this broad geographic area possess the lowest surface chlorophyll concentration estimated through satellite imagery (0.019 mg Chlam−3): First, it has the
10
largest pycnocline depth recorded in the world ocean hydrological database (>200 m);
second the flux of atmospheric dust (e.g. iron) is extremely low (Claustre et al., 20071). In contrast, the PCU system and the Marquise area (Equatorial ocean upwelling) are bathed by nutrient richer waters.
The sea surface temperature and salinity recorded during the cruise varied from 13 15
to 28◦C and from 34 to 36.5 PSU, respectively, with higher values toward the West and
lower values toward the East. 2.2 Sampling
Twenty stations were sampled for biogeochemical parameters (Claustre et al., 20071). Samples for the study of the coccolithophorids were taken according to the Depth of the 20
Chlorophyll Maximum (DCM) at every station. At most stations, water samples were taken at 6 water depths: at the surface (actually 5 m), between the surface and the DCM, at the DCM and two samples below the DCM. In most cases 4 litres of sea-water
1
Claustre, H., Sciandra, A., and Vaulot, D.: Introduction to the special section: bio-optical and biogeochemical conditions in the South East Pacific in late 2004 – the BIOSOPE cruise, Biogeosciences Discuss., in preparation, 2007.
BGD
4, 3267–3299, 2007 Coccolithophores calcite production L. Beaufort et al. Title Page Abstract Introduction Conclusions References Tables Figures ◭ ◮ ◭ ◮ Back CloseFull Screen / Esc
Printer-friendly Version Interactive Discussion
EGU
were filtered on a nitrate cellulose membrane with a diameter of 47 mm and a pore size of 0.45µm. At the last 4 stations of the transect (in the PCU) the diameter of the
membrane was 23 mm and four litres of water was filtered. In consequence the quan-tity of particles in these filtrats was extremely high and often the coccoliths could have remained hidden during subsequent analysis. The absolute number given for those 5
stations have therefore large chance to have been underestimated. The membranes were quickly dried and stored at room temperature. Once in the laboratory, a quarter of each membrane was mounted between slide and cover-slip and fixed with Canada Balsam which has the property to render the membrane optically transparent. Addi-tionally a small fragment of the filter was examined using a Hitachi 3000N Scanning 10
Electron Microscope (SEM). 2.3 Grabbing frames
A Polarizing Optical Microscope (LEICA DMRBE) with a 50X oil immersion objective was used for automatic scanning of slides in cross-polarized light. Microscope stage motions and focus were computer-controlled. For each sample, forty fields of view 15
were grabbed by a 2 Megapixel Spot Insight camera. Each frame is 240×180 µm2 with a pixel area of 0.0225µm2. The amount of light going through the sample was precisely controlled.
2.4 Analyzing calcite particles
We developed a new software using LabView (National Instruments) which automat-20
ically detects and measures all birefringent particles from grabbed frames, hereafter called “Particle Analyser VI”. It takes advantage of the fact that only birefringent crys-tals are illuminated in cross-polarized light; the other cryscrys-tals and the background re-mains dark. There is a relation between the thickness and the brightness of crystals, and this can been calibrated for a transfer function (Beaufort, 2005). The Particle Anal-25
BGD
4, 3267–3299, 2007 Coccolithophores calcite production L. Beaufort et al. Title Page Abstract Introduction Conclusions References Tables Figures ◭ ◮ ◭ ◮ Back CloseFull Screen / Esc
Printer-friendly Version Interactive Discussion
EGU
than background, and measures their surface. We placed a lower threshold at 3 pixels (0.07µm2) to get rid off background noise; and an arbitrarily chosen upper threshold at 74 000 pixels (1683µm2equivalent to circular particles having a 46µm diameter as
for example foraminifera). This upper-threshold is large enough to analyse all particles in the nannoplankton size range including aggregates. Knowing the volume filtered in 5
millilitre (Vf), the surface of the membrane (Sm), the number (Nf) and the surface (Sf) of the frames grabbed, and the total number of particle analysed by sample (Nt), the number of particles per millilitre N is:
N = Nt × Sm/(Nf × Sf × V f )
The Particle Analyser VI automatically measures the “lightness” (L) of all the frames 10
as the sum of all Grey Levels pixel values. A transfer function has been established following the protocol established in (Beaufort, 2005), but applied to samples prepared with cellulosic membranes instead of smear slides. In recalibrating we poured different amounts (precisely weighted) of pure calcite powder into known volumes of water. These suspensions were filtered on membranes of the same type as used during the 15
BIOSOPE transect, and processed as described above. The relation between Grey Levels and weight on the membrane now may serve as a transfer function (Fig. 2).
w = 0.0013 × GL
where w is the weight in pg per pixel (0.0225µm2); GL is the Grey Level measured per pixel (average of all the frames divided by the number of pixel per frame)
20
The calcite weight per millilitre (W) is calculated as following:
W = w × Np × Sm/(Nf × Sf × V f )
Where Np is the number of pixel per frame (=2×10⁶). The values are given in pg ml−1.
Particulate Inorganic Carbon (PIC) is often given in mmol CaCO3m−3. PIC values for
the fraction smaller than 46µm (PIC<46 µ) in this unit are obtained by dividing W by 105.
BGD
4, 3267–3299, 2007 Coccolithophores calcite production L. Beaufort et al. Title Page Abstract Introduction Conclusions References Tables Figures ◭ ◮ ◭ ◮ Back CloseFull Screen / Esc
Printer-friendly Version Interactive Discussion
EGU
2.5 Automated analysis of coccoliths and coccospheres: taxonomic recognition and size analysis
Coccoliths and coccospheres were automatically detected by SYRACO, a software de-veloped in C++ at CEREGE (Beaufort and Dollfus, 2004; Dollfus and Beaufort, 1999). Based on Artificial Neural Network (ANN) SYRACO is adapted to pattern recognition. 5
In this study the ANN has been trained by the SYRACO learning algorithm, on a train-ing set composed of two classes: (1) elliptical placoliths (essentially Emiliania huxleyi and Gephyrocapsa oceanica), and (2) spherical coccospheres smaller than 10µm in
diameter. The training set is a sample from the Southern Indian Ocean in which all the coccospheres are of E. huxleyi, but because of the large generalisation capability of the 10
ANN the coccosphere recognition used here is not species specific. But coccospheres from other orders (Syracosphaerales, Zygodiscales and Coccolithales) are generally not recognised by this ANN.
All the frames have been computed with SYRACO; when an object belonging to one of the 2 classes is detected, its image is saved in a class specific output frame. 15
These output frames are used to perform morphometry and to check the reliability of the recognition. We verified the reproducibility of our technique by counting manually the number of coccospheres in all the frames in 20 samples. The results obtained by the automated and the manual approaches are extremely similar and often identi-cal. In only two samples the number of coccospheres was higher as determined by 20
manual counts. This was due the presence of aggregates of coccospheres in densely populated membranes.
For the coccolith however the number specimen recognized by SYRACO was lower than those determined by human counts. This is not the case when sample are pre-pare on smear slides (Beaufort and Dollfus, 2004). In the present case, the samples 25
were prepared with membranes that cannot be mounted absolutely flat on the slides, and thus significant portions of the fields of view are out of focus (e.g. Fig. 3a), also coccoliths are often tilted on the mesh of the membrane, often coccoliths are in contact,
BGD
4, 3267–3299, 2007 Coccolithophores calcite production L. Beaufort et al. Title Page Abstract Introduction Conclusions References Tables Figures ◭ ◮ ◭ ◮ Back CloseFull Screen / Esc
Printer-friendly Version Interactive Discussion
EGU
or forming small aggregates which are not recognized by SYRACO.
Because of the large generalisation capability of the ANN, a significant amount of objects that more or less resemble the targeted pattern are included in the specific output frames. In the case of coccospheres, these “invading” objects are “manually” erased from the frame. For the coccoliths, they are automatically withdrawn from the 5
analysis by another new software developed in LabView.
This software, hereafter called “Coccolith Analyser VI”, automatically measures coc-coliths and coccospheres. It reads the specific output frames and analyses all objects. In the case of coccoliths it first looks for four landmarks characteristic of the coccoliths. If these are not found, the analysis of this object ends. This pre-processing elimi-10
nates all non-coccoliths objects that were wrongly recognized by SYRACO. However we found that this process withdraws from the analysis up to 25% of the coccoliths. In the case of coccospheres, all the objects are analysed (incorrectly identified cocco-spheres were erase manually, see above). The Coccolith Analyser VI measures the grey level of the objects, their diameter and their surface, and tabulates the results. 15
There is a bias in the measurement of the diameter of the small and dim objects, such as coccolith of −0.6 µm. This due to the fact that we apply a Grey Level threshold below which is defined background. This threshold erodes 2 pixels in the periphery of the dim objects. The pixel size being 0.15µm and 4 pixels being eroded in total when
the length is measured, we added 0.6µm to the coccolith length results. By comparing
20
optical measurement with SEM measurement, it appears that for small placolith like E.
huxleyi the entire distal shield is not detected in cross-polarized light. The measures
have to be multiplied by a 1.25 factor. When these corrections are applied the corre-spondence between SEM and optical measurements on small placoliths are in good agreement. No correction was applied to coccospheres for which SEM and optical 25
measurements are matching.
It should be noted that in a theoretical case of a pure E. huxleyi sample, the size distribution estimated by SYRACO and the Coccolith Analyser VI will narrower that that estimated with the Calcite Analyser VI because SYRACO detects only well preserved,
BGD
4, 3267–3299, 2007 Coccolithophores calcite production L. Beaufort et al. Title Page Abstract Introduction Conclusions References Tables Figures ◭ ◮ ◭ ◮ Back CloseFull Screen / Esc
Printer-friendly Version Interactive Discussion
EGU
well oriented and isolated coccoliths whereas the Calcite Analyser VI will measure all particles, including aggregated, broken, out of focus and tilted coccoliths.
2.6 Importance and composition of the Isochrysidales
Emiliania huxleyi and several species belonging to the genus Gephyrocapsa and Cre-nalithus represent all the calcifying taxa of the marine Isochrysidales Order (de Vargas
5
et al. in press). We will call this complex “EGC” (for Emiliania, Gephyrocapsa and
Crenalithus ranked in order of abundance). SYRACO has been trained to recognize
the EGC complex and is therefore the focus of this paper. The specific composition of EGC varied significantly in the BIOSPE sample. We therefore analyse with a Scan-ning Electron Microscope the samples. This analysis reveals that East of Easter Island 10
(about 110◦W) the EGC dominates the coccolithophore community with relative
abun-dance ranging from 60 to 100%. West of Easter Island the coccolithophore concen-tration diminishes and EGC represents 40% on average of the coccolithophore com-munity. Gephyrocapsa oceanica dominates in the Marquises area. Between 130◦W
and 100◦W the relative abundances of Gephyrocapsa and Emiliania are variable with
15
a low dominance of Emiliania. From 100◦ to the CPU, Emiliania and Crenalithus spp
dominate the communities. Emiliania represent in some samples about 100% of the coccolithophores. A complete analysis of the species distribution in BIOSOPE cruise is in preparation (Couapel et al., 20072).
2
Couapel, M. and Beaufort, L.: Variations of Coccolithophores assemblages along a strong nutrient gradients in the Southeast Pacific, in preparation, 2007.
BGD
4, 3267–3299, 2007 Coccolithophores calcite production L. Beaufort et al. Title Page Abstract Introduction Conclusions References Tables Figures ◭ ◮ ◭ ◮ Back CloseFull Screen / Esc
Printer-friendly Version Interactive Discussion
EGU
3 Results
3.1 Spatial distribution of calcite particles
The concentrations of suspended calcite particles, detached coccoliths and cocco-spheres show very similar patterns of distribution in the BIOSOPE transect (Fig. 4): Maximum concentrations are found between 80◦ and 100◦W, associated with the
sub-5
tropical front (Claustre et al., 20071).
The concentration in coccospheres is generally very low (average of 9/ml with a maximum of 150/ml). That of detached coccoliths ranges from 11 to 1200 coccoliths per millilitre with an average of 150. The amount of suspended calcite particles and the total weight of calcite per millilitre were in average 733 particles/ml and 11 200 pg/ml 10
(or PIC<46 µ=0.11 mmol CaCO3 m−3) respectively. The corrected total weight of the
EGC detached coccoliths and coccospheres is 2431 pg/ml (or 0.024 mmol CaCO3/m3), which represent 21% of the PIC<46 µ. Large aggregates that may be rich in coccoliths composed a large part of remaining 79%.
The spatial distributions of detached coccoliths and suspended calcite particles 15
present two larger scatters of higher concentrations around 95◦W (between 50 and
100 m depth) and around 85◦W at about 30 m depth. Coccospheres are found in great
abundance only in the second scatter. SEM examination of samples in the former scatter confirms the presence of numerous coccoliths of E. huxleyi, with very rare coc-cospheres. This “cloud” of detached coccoliths may correspond to a recent bloom of 20
E. huxleyi.
The observed pattern of density distribution of calcite particles is confirmed by the study of in situ optical properties described in Twardowski et al. (2007a)3(i.e. the ratio of backscattering to scattering) is dependant on size distribution of particle assemblage
3
Twardowski, M. S., Claustre, H., Freeman, S. A., Babin, M., Sciandra, A., Beaufort, L., Groundwater, H., and Stramski, D.: Optical scattering and its relationship with particle biogeo chemistry in the Southeast Pacific, Biogeosciences Discuss., in preparation, 2007a.
BGD
4, 3267–3299, 2007 Coccolithophores calcite production L. Beaufort et al. Title Page Abstract Introduction Conclusions References Tables Figures ◭ ◮ ◭ ◮ Back CloseFull Screen / Esc
Printer-friendly Version Interactive Discussion
EGU
(high when dominated by small particles and reciprocally) and on refractive index (high for particles with high refractive index, like calcite). for particle density. This ratio ap-proximately scales with the number of suspended calcite particle and the PIC estimated by the “Calcite Analyser VI” (Twardowski et al., 2007a3); more particularly it exhibits the two prominent scatters of coccoliths at the exact same position than the present 5
analysis and confirms the relative “patchy” distribution of these biogenic particles. 3.2 Grain size distribution of suspended calcite particles, detached coccoliths and
coccospheres
Ninety five percent of the 416 000 suspended calcite particles analysed in the BIOSOPE samples have a surface inferior to 20µm2or a diameter inferior to 5µm (in
10
the 0.1–46µm range). The distribution is unimodal and slightly skewed toward larger
particles, with a mode at 3.2µm2(Fig. 5a). The distribution of detached coccoliths and coccospheres are unimodals with modes at 3.2µm2and 40µm2, respectively (Fig. 5a). Interestingly, the mode of the suspended calcite particles is the same than that of the detached EGC coccoliths. The number of detached coccoliths (mostly E. huxleyi plus 15
some Gephyrocapsa) represents 1/5 of all suspended calcitic particles.
Sample ST18 at 30 m is almost monospecific (E. huxleyi represents more 95% of the coccolith assemblage). In the size range (1–10µm2) of E. huxleyi, we observed very few particles in the view fields that were not of this species (e.g. Figs. 3a, b). The number of coccoliths detected by SYRACO and the Coccolith Analyser VI represents 20
only 40% of the suspended calcite particles in the same size range (Fig. 5b). That means our system missed 60% of coccolith because they were out of focus, tilted, broken or aggregated. Applying a correcting factor of 2.5 to the entire suite of samples, we can now estimates that the EGC coccoliths represent 50% of all the suspended calcite particles detected in the range 0.1–46µm.
25
The correlation of r=0.93 (Fig. 6) existing between the numbers of calcite particles detected by the Calcite Analyser VI and the number of coccoliths detected and mea-sured by SYRACO and the Coccolith Analyser VI shows the importance of the EGC
BGD
4, 3267–3299, 2007 Coccolithophores calcite production L. Beaufort et al. Title Page Abstract Introduction Conclusions References Tables Figures ◭ ◮ ◭ ◮ Back CloseFull Screen / Esc
Printer-friendly Version Interactive Discussion
EGU
cocolithophores as calcite producers in the Pacific. The correlation indicates that E.
huxleyi is the main source of fine suspended calcite particles in the open ocean (E. huxleyi dominates assemblages where the coccolith density is high).
3.3 Size and weight distribution
The diameter and weight of the coccoliths and coccospheres show the same spa-5
tial distribution (Fig. 4). These parameters have in general higher values in eutrophic (PCU) or mesotrophic (Marquesas) zones and lowest values between 80 and 100◦W
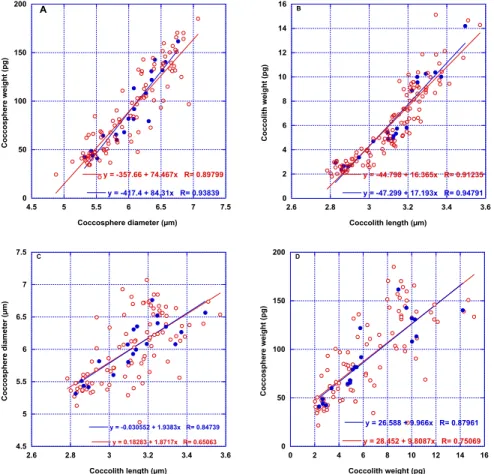
(Fig. 7). In oligotrophic area, these values are larger in the deep photic zone. There are significant correlations (Fig. 8) between the station average diameter of coccoliths and coccospheres (r=0.87). The same is true for their weights (r=0.88). Also there are 10
significant correlation between station average of the weight and the diameter of the coccoliths (r=0.97) and of the coccopshere (r=0.94).
3.4 Depth profiles
Morphometric and abundance data show depth profiles which are similar to that of the chlorophyll concentration (Fig. 9), implying that maxima of the coccolithophores 15
parameters are found most often at the chlorophyll maximum. In consequence, the concentrations in coccolithophores and coccoliths, their weight and their size, are high-est at shallow depth in the upwelling area, and deep in oligotrophic area. For example in the centre of the gyre E. huxleyi is most abundant between 150 and 200 m.
3.5 Number of coccoliths per coccosphere 20
Assuming that, the detached coccoliths have the same morphological characteristic than the coccoliths in situ on the coccosphere, then the number of coccoliths per coc-cosphere is obtained by dividing the average weight of coccoc-cospheres by the average weight of the coccoliths. Doing so, we found an average of 15 coccoliths per coc-cospheres with standard deviation of 5. No clear pattern was found in the spatial 25
BGD
4, 3267–3299, 2007 Coccolithophores calcite production L. Beaufort et al. Title Page Abstract Introduction Conclusions References Tables Figures ◭ ◮ ◭ ◮ Back CloseFull Screen / Esc
Printer-friendly Version Interactive Discussion
EGU
distribution of that number.
4 Discussion
4.1 Abundance distribution
The EGC coccospheres stocks estimated in the South East Pacific are low with a me-dian value of 4000 cell per litre. The lowest values are found at Station GYR at the 5
centre of the South Pacific Gyre. However in the centre of the gyre at all stations coc-colithophores were continuously present down to 300 m. The average stock at Station GYR2 was 1250 cell per litres. This is equivalent to 375×106 cells m-2 in a 300 m thick water column and this represents only the stock of marine Isochrysidales (EGC) which represent only a small fraction (1/3) of the coccolithophores in that area. The 10
stocks of EGC estimated in this study are in the same range as previously reported for the tropical Pacific, 1–240 cell/ml (Hagino and Okada, 2006), 0–60 cell/ml (Balch and Kilpatrick, 1996), 1–100 cell/ml (Ohkouchi et al., 1999; Okada and Honjo, 1973). 0–60 cell/ml (Giraudeau and Beaufort, 2007). The highest cell density of E. huxleyi (240 cell/ml) in the South Equatorial Pacific was reported in the Peru Upwelling (∼85◦W–
15
∼2◦S) (Hagino and Okada, 2006). This is equivalent to what is found in BIOSOPE, where up to 150 cell/ml were observed west of the CPU. The E. huxleyi abundance drops from this 150 cell/ml outside the CPU to 9 cell/ml at maximum in the CPU. This is very different from what has been observed in other upwelling systems. For exam-ple higher numbers of coccospheres of E. huxleyi were observed at the centre rather 20
than outside the Benguela uwpelling (∼250 cell/ml) (Giraudeau and Bailley, 1995). In the case of BIOSOPE experiment, the abundance of coccospheres decreases sharply from the edge to the centre of PCU (a caution note should be given here because smaller filters has been used in the PCU; see the material and method section).
BGD
4, 3267–3299, 2007 Coccolithophores calcite production L. Beaufort et al. Title Page Abstract Introduction Conclusions References Tables Figures ◭ ◮ ◭ ◮ Back CloseFull Screen / Esc
Printer-friendly Version Interactive Discussion
EGU
4.2 Emiliania huxleyi: important calcite producer:
The BIOSOPE PIC values are in the same range (0.05–0.35 mmol/m3) than previously published for the Equatorial Pacific (Balch and Kilpatrick, 1996) if we exclude one value from the latter study of 1.33 mmol in the open ocean upwelling. One of the important finding of the present study is a strong relation between the numbers of coccoliths of E. 5
huxleyi and the number of suspended calcite particles (and therefore, the PIC). Emil-iania has been seen as one of the most important calcite producers (e.g. Westbroek et
al., 1993) or at the opposite, it has been considered to represent only an insignificant share of the oceanic calcite production (Paasche, 2002; Ziveri et al., 2007), because this species secrete one of the lightest coccoliths (Beaufort and Heussner, 1999; Young 10
and Ziveri, 2000). We show here that most of the fine calcite particles in the BIOSOPE transect have to be attributed to EGC coccoliths (essentially of E. huxleyi) production.
Calcification in the Tropical Pacific is very high, (equal the rate of photosynthesis) and the turnover times of calcite in the euphotic zone ranges from 3 to 10 days (Balch and Kilpatrick, 1996). These high turnover rates of calcite induce a high ballasting of or-15
ganic matter by carbonate particles and a high depletion of Ca++ ion in the euphotic zone (Balch et al., 2007). Because of the high abundance of detached coccoliths, and coccospheres, the ballasting due to E. huxleyi coccolith must have been particularly efficient around 90◦W–30◦S.
4.3 Weight and size relation between coccolith and coccosphere 20
An interesting aspect of this study, is the fact that there is a close (r=relationship be-tween the diameter of the coccoliths and of the coccospheres in the EGC complex. A factor of ∼1.9 can be used to estimate the diameter of a coccosphere from the length of a coccolith. Also the number of coccoliths per coccosphere is 15 in average without changes through the BIOSOPE transect. These values could be used in pa-25
leoceanographic studies for estimating the number and the size of the cells of marine Isochrysidales from the number and length of their coccoliths.
BGD
4, 3267–3299, 2007 Coccolithophores calcite production L. Beaufort et al. Title Page Abstract Introduction Conclusions References Tables Figures ◭ ◮ ◭ ◮ Back CloseFull Screen / Esc
Printer-friendly Version Interactive Discussion
EGU
4.4 Calcification, cell diameter and carbonate chemistry:
The most calcified EGC are found in the Marquises area and Peru-Chili Upwelling (PCU). This could results from the high fertility of these areas, if we rely on the recent culturing experiments showing that E. huxleyi is more calcified in waters rich in P and N in batch cultures (Beaufort et al., 2007) or after addition of nutriments in mesocosms 5
(Engel et al., 2005). The problem is that in these studies the number of cell was also el-evated. In BIOSOPE, the highest number of coccospheres was found between 80 and 100◦W and it is also in the same samples that the least calcified Isochrysidales were
found. The number of coccospheres in the PCU may have been underestimated, but not in the Marquise area. There is no relation between the number of coccospheres 10
and their weight of CaCO3. In a comparison of numerical simulation and observed
data from seasonal blooms in the Bering Sea, it has been shown that the E. huxleyi production benefits greatly from an increase in the concentration of carbonate ion in the surface water resulting from the increase in phytoplankton production (Merico et al., 2006). These authors hypothesised that in a zone of seasonal blooms, E. hux-15
leyi would calcify more after a spring bloom in response to the increase in carbonate
ion concentration. This hypothesis could explain why the heaviest coccospheres are observed in the eutrophic and mesotrophic areas of the BIOSOPE experiment. At the reverse, the least calcified Isochrysidales are found at the subtropical front in the highest coccosphere abundance zone of the BIOSOPE experiment. Because it is not a 20
highly productive area, the production of coccoliths may have decreased the carbonate ion concentration, making calcification more difficult for E. huxleyi. Also (Balch et al., 2007) recently suggested that high PIC turnover such as those recorded in the tropical Pacific, would induce a depletion of calcium ion in the photic zone as a response of losses of PIC ballasted particles.
25
Finally we observed a strong negative correlation between surface oxygen concen-tration recorded during the cruise (Goyet et al., 2007) and carbonate weight of the coccospheres (r=0.93). (Shiraiwa, 2003) described a negative effect of oxygen
con-BGD
4, 3267–3299, 2007 Coccolithophores calcite production L. Beaufort et al. Title Page Abstract Introduction Conclusions References Tables Figures ◭ ◮ ◭ ◮ Back CloseFull Screen / Esc
Printer-friendly Version Interactive Discussion
EGU
centration on calcification and photosynthesis of coccolithophores. But because of the high number of coccospheres in that zone, a direct relation with oxygen (Warburg ef-fect) is not considered here. The low oxygen content is seen as an oceanographic signature of the distinct ocean chemistry of this area which has a strong impact on the coccolithophore calcification. We did not find strong correlation between salinity (and 5
temperature) and any morphological parameter we measured on the coccolithophores. Recently some relation between the length of E. huxleyi coccoliths and salinity has been suggested (Bollmann and Herrle, 2007). We do not find this relation here (r<0.5):
Although the smallest coccoliths are found in relatively low salinity waters, the longest coccoliths were found in the CPU also with low salinity. Our data suggest that the 10
shape (size and weight) of coccoliths and coccospheres is dependant on the carbon-ate chemistry and productivity of the wcarbon-ater in which they are secreted.
4.5 Deep production of marine Isochrysidales
In the South Pacific Gyre, coccolithophores are growing at great depths. For example at Station STB11, Florisphaera profunda is found between 200 and 300 m (maximum 15
abundance at 250 m) (Fig. 10a) and at Station GYR2 it is found at 170 m and possibly bellow whereas the maximum abundances of Isochrysidales was found at 150–170 m (Fig. 10b). Station STB11 is one of the rare case in which maximum abundance of EGC was found above the Deep Chlorophyll Maximum (DCM) (Fig. 10a). Except at Station STB11, maximum abundance occurs at about 120 m, i.e., deeper than usually found 20
for coccoliths in oligotrophic area (e.g. Okada and Honjo, 1973; Okada and McIntyre, 1979). A possibility is that these coccospheres were not of living cells but the sinking remains of coccolithophores that grew at shallower depths. Several lines of evidence argue against this: 1) the maximum abundances of coccospheres are in the Deep Chlorophyll Maxima (DCM). 2) the production in the upper photic zone is too low to fuel 25
the coccosphere maxima where coccosphere abundance is 3 times larger than above. This is particularly true for Florisphaera profunda which is found only below 200 m. 3) the community vertical structure is typical of oligotrophic area, 4) It is interesting to note
BGD
4, 3267–3299, 2007 Coccolithophores calcite production L. Beaufort et al. Title Page Abstract Introduction Conclusions References Tables Figures ◭ ◮ ◭ ◮ Back CloseFull Screen / Esc
Printer-friendly Version Interactive Discussion
EGU
that the DCM is not only the place of maximum abundance of EGC, but also an area in which they secrete heavier coccoliths and have larger cells. If those morphological parameters are related to carbonate chemistry of the water as it has been proposed above, this could be the depletion carbonate and calcium ion would be more easily compensated by diffusion from deeper water through the thermocline. The “carbonate 5
stress” would be weaker at greater depth.
In conclusion, the system investigated can be considered as an endmember of olig-otrophic systems with the deepest chlorophyll maximum and the clearest waters ever reported (Morel et al., 2007). The cococlithophore assemblage is typically adapted to these conditions with maximum cell density being in general closely associated with 10
the deep Chlorophyll maximum. Furthermore from pigment signature is it very clear that below the chlorophyll maximum and up to depth of 250 and above, the dominating (sometime the only one) carotenoids is 19′-hexnoyloxyfucoxanthin, the marker of
prym-nesiophyceae (Ras et al., 20074). This observation had to be put in line with the layer of high backscattering ratio (the calcite marker) that is recorded at ∼240 m (Twardowski 15
et al., 2007b) at the GYR station.
4.6 Implication of deep production for alkenone paleothermometry and satellite cal-cite detection
When the temperature difference between the surface and the level of maximum abun-dance of the EGC, the represent of the marine Isochrysidales, is calculated, it appears 20
that for 1/3 of the stations, the difference is above 2◦C (Fig. 11). The Isochrysidales
are the producers of alkenones used in paleoceanography as sea surface tempera-ture (SST) proxy. Ohkouchi et al. (1999) described some discrepancies between SST estimates from North Pacific surface sediments and the observed SST at the same location, that could be attributed to the fact that alkenones were produced in the DCM. 25
4
Ras, J., Uitz, J., and Claustre, H.: Spatial variability of phytoplankton pigment distribution in the South East Pacific, Biogeosciences Discuss., submitted, 2007.
BGD
4, 3267–3299, 2007 Coccolithophores calcite production L. Beaufort et al. Title Page Abstract Introduction Conclusions References Tables Figures ◭ ◮ ◭ ◮ Back CloseFull Screen / Esc
Printer-friendly Version Interactive Discussion
EGU
Also Conte et al. (2006) found some differences between the alkenone calibration curve based on surface sediment (Muller et al., 1998) and their calibration based on mixed-layer water measurements. But those differences were essentially recorded in high latitudes in absence of DCM. Our results would indicate that it is may be excessive to infer SST from an alkenone record core taken below the South Pacific Gyre because 5
alkenone would have been produced far below the surface (there is no suitable sed-iments to establish such a record in the Central Southern Pacific, Rea et al., 2006). But it has been shown that alkenones are produced exclusively in the mix layer depth, and above the DCM in ALOHA Station in the oligotrophic North Pacific Gyre (Prahl et al., 2005). Either Station ALOHA was similar to Station STB11 where E. huxleyi was 10
abundant above DCM (Fig. 10), or the secretion of alkenones by E. huxleyi is light dependent. In that case the deep production of Isochrysidales observed in SPG would not temper the SST reconstruction based on alkenones.
From the 115 samples analysed in BIOSOPE, 62% of the coccoliths were found at depth below 30 m, and therefore undetectable by satellite. This indicates that a 15
large part of the calcite production from huge oceanic areas cannot be inferred by remote detection. It is interesting to note that coccolith blooms detected by satellite are always in regions of shallow organic production (high latitudes, continental shelves, and upwelling zones) (Balch et al., 2007; Brown and Yoder, 1994).
5 Conclusions
20
In the South Pacific Gyre coccolithophores grow in low abundance and calcify. The production is spread on a 300 m water column. When integrated to that entire depth, the stock of marine Isochrysidales, which represent a 1/3 of the coccolith community in that area, is 375 million cells per m2.
As found in other coccolithophores study of the Tropical Pacific, the stocks observed 25
during BIOSOPE are low. However, EGC coccoliths compose a significant fraction of Particulate Inorganic Carbone (PIC) (around 50% in term of number of particles and
BGD
4, 3267–3299, 2007 Coccolithophores calcite production L. Beaufort et al. Title Page Abstract Introduction Conclusions References Tables Figures ◭ ◮ ◭ ◮ Back CloseFull Screen / Esc
Printer-friendly Version Interactive Discussion
EGU
21% in term of weight). Broken coccoliths and aggregates of these same taxa may represent a large part of the remaining PIC.
Therefore a large amount of the fine calcite particles in the BIOSOPE transect have to be attributed to EGC coccoliths and essentially to E. huxleyi) production.
Calcifica-tion in the Tropical Pacific is very high, (equal the rate of photosynthesis) which induce 5
a high ballasting of organic matter by carbonate particles and a high depletion of Ca++ ion in the euphotic zone (Balch et al., 2007). Because of the high abundance of de-tached coccoliths, and coccospheres, the ballasting due to E. huxleyi coccolith must have been particularly efficient especially around 90◦W–30◦S where E. huxleyi is found
in great abundance. 10
There is a close relationship between the diameter of the coccoliths and of the coc-cospheres in the EGC complex. The most calcified EGC are found in the Marquises area and Peru-Chili Upwelling (PCU). This could results from the high fertility of these areas: high phytoplankton production can induce an increase in the concentration of carbonate ion in the surface water which will benefit for the coccosphere calcification. 15
At the reverse, the least calcified EGC are found west of the PCU in the highest coc-cosphere abundance zone of the BIOSOPE experiment. Because it is not a highly productive area, the production of coccoliths may have decreased the carbonate and calcium ion concentrations, making calcification more difficult for E. huxleyi.
In the South Pacific Gyre, coccolithophores are growing at great depths: the maxi-20
mum abundances of EGC were found between 150 and 170 m. The Deep Chlorophyll maximum is not only the place of maximum abundance of EGC, but also an area in which they secrete heavier coccoliths and have larger cells.
Acknowledgements. D. Tailliez and C. Bournot are warmly thanked for their efficient help in
CTD rosette management and data processing. We are thankful to D. Vaulot, M. Viprey, and
25
L. Garczarek for having filtered water samples for coccoliths during BIOSOPE cruise. We are thankful to M.-P. Aubry who made interesting comment on earlier version of this paper. This is a contribution of the BIOSOPE project of the LEFE-CYBER program. BIOSOPE cruise was funded by the Centre National de la Recherche Scientifique (CNRS), the Institut des Sciences de l’Univers (INSU), the Centre National d’Etudes Spatiales (CNES), the European Space
BGD
4, 3267–3299, 2007 Coccolithophores calcite production L. Beaufort et al. Title Page Abstract Introduction Conclusions References Tables Figures ◭ ◮ ◭ ◮ Back CloseFull Screen / Esc
Printer-friendly Version Interactive Discussion
EGU Agency (ESA), The National Aeronautics and Space Administration (NASA) and the Natural
Sciences and Engineering Research Council of Canada (NSERC). This work benefited from financial support from the ANR Biodiversity French program (BOOM project).
References
Archer, D., Winguth, A., Lea, D., and Mahowald, N.: What caused the Glacial/Interglacial
atmo-5
spheric pCO2 cycles. Rev. Geophys., 38, 159–189, 2000.
Balch, W. M. and Kilpatrick, K.: Calcification rates in the equatorial Pacific along 140◦W, Deep Sea Res. II, 43, 971–993, 1996.
Balch, W. M., Drapeau, D. T., Bowler, B. C., and Booth, E. S.: Prediction of pelagic calcification rates using satellite measurements, Deep Sea Res. II, 54, 478–495, 2007.
10
Beaufort, L.: Weight estimates of coccoliths using the optical properties (birefringence) of cal-cite, Micropaleontol., 51, 289–298, 2005.
Beaufort, L. and Heussner, S.: Coccolithophorids on the continental slope of the Bay of Biscay, I. Production, transport and contribution to mass fluxes, Deep Sea Res. II, 46, 2147–2174, 1999.
15
Beaufort, L. and Dollfus, D.: Automatic recognition of coccolith by dynamical neural network. Mar. Micropaleont, Marine Micropaleontology, 51(1–2), 57–73, 2004.
Beaufort, L., Probert, I., and Buchet, N.: Effects of acidification and primary production on coccolith weight: implications for carbonate transfer from the surface to the deep ocean, Geochem. Geophys. Geosyst., 8, doi:10.1029/2006GC001493, 2007.
20
Bollmann, J. and Herrle, J. O.: Morphological variation of Emiliania huxleyi and sea surface salinity, Earth Planet. Sci. Lett., 255, 273–288, 2007.
Brown, C. W. and Yoder, J. A.: Coccolithophorid blooms in the global ocean, J. Geophys. Res., 99(C4), 7467–7482, 1994.
Claustre, H. and Maritorena, S.: The many shades of ocean blue, Science, 302, 1514–1515,
25
2003.
Conte, M. H., Sicre, M. A., Ruhlemann, C., Weber, J. C., Schulte, S., Schulz-Bull, D., and Blanz, T.: Global temperature calibration of the alkenone unsaturation index (UK’37) in surface wa-ters and comparison with surface sediments, Geochem. Geophys. Geosystems, 7, Q02005, doi:10.1029/2005GC001054, 2006.
BGD
4, 3267–3299, 2007 Coccolithophores calcite production L. Beaufort et al. Title Page Abstract Introduction Conclusions References Tables Figures ◭ ◮ ◭ ◮ Back CloseFull Screen / Esc
Printer-friendly Version Interactive Discussion
EGU Dollfus, D. and Beaufort, L.: Fat neural network for recognition of position-normalised objects,
Neural Networks, Neural Networks, 12, 553–560, 1999.
Engel, A., Zondervan, I., Aerts, K., Beaufort, L., Benthien, A., Chou, L., Delille, D., Gattuso, J. P., Harlay, J., Heemann, C., Hoffmann, L., Jacquet, S., Nejstgaard, J., Pizay, M. D., Rochelle-Newall, E., Schneider, U., Terbrueggen, A., and Riebesell, U.: Testing the direct effect of
5
CO2 concentration on a bloom of the coccolithophorid Emiliania huxleyi in mesocosm exper-iments, Limnol. Oceanogr., 50, 493–507, 2005.
Felly, R. A., Sabine, C. L., Lee, K., Berelson, W., Kleypas, J., Fabry, V. J., and Millero, F. J.: Impact of Anthropogenic CO2 on the CaCO3 System in the Oceans, Science, 305, 362– 366, 2004.
10
Giraudeau, J. and Bailley, G. W.: Spatial dynamics of coccolithophore communities during an upwelling event in the Southern Benguela system, Continent. Shelf. Res., 15, 1825–1852, 1995.
Giraudeau, J. and Beaufort, L.: 10- Coccolithophorides. Proxies in late Cenozoic Paleoceanog-raphy, edited by: Hilaire-Marcel, C. and de Vernal, A., Elsevier, 409–439, 2007.
15
Hagino, K. and Okada, H.: Intra- and infra-specific morphological variation in selected coc-colithophore species in the equatorial and subequatorial Pacific Ocean. Mar. Micropaleont, Marine Micropaleontology, 58, 184–206, 2006.
Merico, A., Tyrrell, T., and Cokacar, T.: Is there any relationship between phytoplankton sea-sonal dynamics and the carbonate system?, J. Mar. Syst., 59, 120–142, 2006.
20
Milliman, J. D.: Production and accumulation of calcium carbonate in the ocean – budget of a nonsteady state, Global Biogeochem. Cycles, 7, 927–957, 1993.
Morel, A., Gentili, B., Claustre, H., Babin, M., Bricaud, A., Ras, J., and Tieche, F.: Optical properties of the “clearest” natural waters, Limnol. Oceanogr., 52, 217–229, 2007.
Muller, P. J., Kirst, G., Ruhland, G., von Storch, I., and Rossel-Mele, A.: Calibration of the
25
alkenone paleotemperature index UK’37 based on core-top from the eastern South Atlantic and the global ocean (60◦N–60◦S), Geochim. Cosmochim. Acta, 62, 1757–1722, 1998. Ohkouchi, N., Kawamura, K., Kawahata, H., and Okada, H.: Depth ranges of alkenone
produc-tion in the central Pacific Ocean, Global Biogeochem. Cycles, 13, 695–704, 1999.
Okada, H. and Honjo, S.: The distribution of oceanic coccolithophorids in the Pacific, Deep Sea
30
Res., 20, 355–374, 1973.
Okada, H. and McIntyre, A.: Modern coccolithophores of the Pacific and North Atlantic Oceans, Micropaleontol., 23, 1–55, 1979.
BGD
4, 3267–3299, 2007 Coccolithophores calcite production L. Beaufort et al. Title Page Abstract Introduction Conclusions References Tables Figures ◭ ◮ ◭ ◮ Back CloseFull Screen / Esc
Printer-friendly Version Interactive Discussion
EGU Orr, J. C., Fabry, V. J., Aumont, O., Bopp, L., Doney, S. C., Felly, R. A., Gananadesikan, A.,
Gruber, N., Ishida, A., Joos, F., Key, R., Lindsay, K., Maier-Reimer, E., Matear, R., Monfray, P., Mouchet, A., Najjar, R., Plattner, G.-K., Rodgers, K. B., Sabine, C. L., Sarmiento, J. L., Schlitzer, R., Slater, R. D., Totterdell, I. J., Weirig, M. F., Yamanaka, Y., and Yool, A.: Anthropogenic ocean acidification over the twenty-first century and its impact on calcifying
5
organisms, Nature, 437, 681–687, 2005.
Paasche, E.: A review of the coccolithophorid Emiliania huxleyi(Prymnesiophyceae), with par-ticular reference to growth, coccolith formation, and calcification–photosynthesis interactions, Phycologia, 40, 503–529, 2002.
Prahl, F. G., Popp, B. N., Karl, D. M., and Sparrow, M. A.: Ecology and biogeochemistry of
10
alkenone production at Station ALOHA, Deep Sea Res., 52, 699–719, 2005.
Rea, D., Lyle, M. W., Liberty, L. M., Hovan, S. A., Bolyn, M. P., Gleason, J. D., Hendy, I. L., Latimer, J. C., Murphy, B. M., Owen, R. M., Paul, C. F., Rea, T. H. C., Stancin, A. M., and Thomas, D. J.: Broad region of no sediment in the southwest Pacific Basin, Geology, 34, 873–876, 2006.
15
Riebesell, U., Zondervan, I., Rost, B., Tortell, P. D., Zeebe, R., and M., M. F. M.: Reduced calcification of marine plankton in response to increased atmospheric CO2, Nature, 407, 364–367, 2000.
Shiraiwa, Y.: Physiological regulation of carbon fixation in photosynthesis and calcification of coccolithophorids, Compartive Biochem. Physiolog., 136, 775-783, 2003.
20
Twardowski, M. S., Claustre, H., Freeman, S., Stramski, D., and Huot, Y.: Optical backscattering properties of the “clearest” natural waters, Biogeosciences Discuss., 4, 2441–2491, 2007b. Westbroek, P., Brown, C. W., Bleijswijk, J. v., Brownlee, C., Brummer, G. J., Conte, M., Egge,
J., Fernandez, E., Jordan, R., Knappertsbusch, M., Stefels, J., Veldhuis, M., Wal, P. v. d., and Young, J.: A model system approach to biological climate forcing. The example of Emiliania
25
huxleyi, Global Planetary Change, 8, 27–46, 1993.
Young, J. and Ziveri, P.: Calculation of coccolith volume and its use in calibration of carbonate flux estimates. Deep Sea Res., 47, 1679–1700, 2000.
Ziveri, P., de Bernardi, B., Baumann, K.-H., Stoll, H. M., and Mortyn, G. P.: Sinking of coccolith carbonate and potential contribution to organic carbon ballasting in the deep ocean, Deep
30
BGD
4, 3267–3299, 2007 Coccolithophores calcite production L. Beaufort et al. Title Page Abstract Introduction Conclusions References Tables Figures ◭ ◮ ◭ ◮ Back CloseFull Screen / Esc
Printer-friendly Version Interactive Discussion
EGU
Fig. 1. Map showing the position of the station and the ocean surface Chlorophyll concentration
BGD
4, 3267–3299, 2007 Coccolithophores calcite production L. Beaufort et al. Title Page Abstract Introduction Conclusions References Tables Figures ◭ ◮ ◭ ◮ Back CloseFull Screen / Esc
Printer-friendly Version Interactive Discussion
EGU
Fig. 2. Transfer function of Grey Levels into weight of calcite in picogram. The x-axis gives
the weight of calcite put onto the membrane per surface unit (here the area of one pixel). The y-axis represents the Grey Level value measure in average of one pixel. The line represent de best regression going through the origin.
BGD
4, 3267–3299, 2007 Coccolithophores calcite production L. Beaufort et al. Title Page Abstract Introduction Conclusions References Tables Figures ◭ ◮ ◭ ◮ Back CloseFull Screen / Esc
Printer-friendly Version Interactive Discussion
EGU
A
B
Fig. 3. Images of view field of sample taken at 30 m at Station 18 taken on a Polarizing
Mi-croscope (a) and a Scanning Electron MiMi-croscope (b). The upper right portion of (a) is not in focus. In (b), some not well oriented coccoliths are indicated by a red arrow, and some patches of coccoliths are encircled in blue. All coccoliths in these photos are E. huxleyi.
BGD
4, 3267–3299, 2007 Coccolithophores calcite production L. Beaufort et al. Title Page Abstract Introduction Conclusions References Tables Figures ◭ ◮ ◭ ◮ Back CloseFull Screen / Esc
Printer-friendly Version Interactive Discussion EGU Longitude (°W) a e j b c d f g h i Coccosphere / ml Coccolith / ml Calcite particles / ml Calcite pg / ml Coccolith length (µm) Coccolith weight (pm) Coccosphere diameter (µm) Coccosphere weight (pm)
Fig. 4. Density distribution of coccospheres per millilitre (a), detached coccoliths per millilitre (b), Suspended calcite particles per millilitre (c), Total weigh of suspended calcite particles
in pg/ml (d), attenuation coefficient, cp (m−1
) (e). The attenuation coefficient data have been processed as described in Claustre et al. (2007). Average length of detached coccolith (µm)
(f); Average weight of detached coccoliths (pg) (g); Average diameter of coccospheres (µm)
(h), Average weight of coccospheres (pg), and concentration in Chlorophyll a from Claustre et
BGD
4, 3267–3299, 2007 Coccolithophores calcite production L. Beaufort et al. Title Page Abstract Introduction Conclusions References Tables Figures ◭ ◮ ◭ ◮ Back CloseFull Screen / Esc
Printer-friendly Version Interactive Discussion EGU 0 5000 10000 15000 20000 25000 30000 35000 40000 0.1 1 10 100 1000 Coccoliths; N=84519 Calcite Particles; N=415874 Coccospheres; N=5122 N u m b e r p e r c la s s (a ll B IO SO PE Sa m p le s ) Surface (µm²) 0 200 400 600 800 1000 0.1 1 10 100 1000 Coccoliths; N=2562 Calcite particles; N=9181 Coccospheres; N=693 N u m b e r p e r c la s s (ST B 1 8 : 3 0 m ) Surface (µm²) (a) (b)
Fig. 5. Distribution of area of coccoliths (red), coccospheres (green) and calcite particles (blue)
BGD
4, 3267–3299, 2007 Coccolithophores calcite production L. Beaufort et al. Title Page Abstract Introduction Conclusions References Tables Figures ◭ ◮ ◭ ◮ Back CloseFull Screen / Esc
Printer-friendly Version Interactive Discussion EGU
100
1000
10
410
100
1000
10
4y = 286.27 + 2.8947x R= 0.93254
C
a
lc
ite
p
a
rti
c
le
/
m
l
Coccoliths / ml
Fig. 6. Correlation between concentrations of suspended calcite particules and of detached
BGD
4, 3267–3299, 2007 Coccolithophores calcite production L. Beaufort et al. Title Page Abstract Introduction Conclusions References Tables Figures ◭ ◮ ◭ ◮ Back CloseFull Screen / Esc
Printer-friendly Version Interactive Discussion EGU 40 60 80 100 120 140 160 180 2 4 6 8 10 12 14 16 70 80 90 100 110 120 130 140 150 C o c c o s p h e re w e ig h t (p g ) C o c c o lit h w e ig h t (p g ) Longitude (°W) Mar - 141°W ST18 – 84°W UPX2 – 72°W 3 µm 3 µm 3 µm 6.5 7 7.5 8 2.9 3 3.1 3.2 3.3 3.4 3.5 3.6 70 80 90 100 110 120 130 140 150 C o c c o s p h e re d ia m e te r (µ m ) C o c c o lit h le n g th ( µ m ) Longitude (°W)
Fig. 7. Bottom left: Variability of Isochrysidales coccosphere diameter (red) and coccolith
length (blue) inµm averaged for every BIOSOPE station (average weighted by the
concentra-tion at each depth). Bottom right: variability of coccosphere (red) and coccolith (blue) weight in pg averaged for every BIOSOPE station (average weighted by the concentration at each depth). Top: 6 SEM photos (scale bard represents 3µm: same scale in every photo) of typical
BGD
4, 3267–3299, 2007 Coccolithophores calcite production L. Beaufort et al. Title Page Abstract Introduction Conclusions References Tables Figures ◭ ◮ ◭ ◮ Back CloseFull Screen / Esc
Printer-friendly Version Interactive Discussion EGU 0 50 100 150 200 4.5 5 5.5 6 6.5 7 7.5 y = -357.66 + 74.467x R= 0.89799 y = -417.4 + 84.31x R= 0.93839 C o c c o s p h e re w e ig h t (p g ) Coccosphere diameter (µm) A 4.5 5 5.5 6 6.5 7 7.5 2.6 2.8 3 3.2 3.4 3.6 y = -0.030552 + 1.9383x R= 0.84739 y = 0.18283 + 1.8717x R= 0.65063 C o c c o s p h e re d ia m e te r (µ m ) Coccolith length (µm) C 0 50 100 150 200 0 2 4 6 8 10 12 14 16 y = 26.588 + 9.966x R= 0.87961 y = 28.452 + 9.8087x R= 0.75069 C o c c o s p h e re w e ig h t (p g ) Coccolith weight (pg) D 0 2 4 6 8 10 12 14 16 2.6 2.8 3 3.2 3.4 3.6 y = -44.798 + 16.365x R= 0.91235 y = -47.299 + 17.193x R= 0.94791 C o c c o li th w e ig h t (p g ) Coccolith length (µm) B
Fig. 8. Correlation between coccosphere diameter and weight (A), coccolith length and weight (B), coccolith length and coccosphere diameter (C) weight of coccolith and coccosphere (D)
of EGC (Isochrysidales) in BIOSOPE samples (open red circles) and weighted average in BIOSOPE stations (filled blue circles).
BGD
4, 3267–3299, 2007 Coccolithophores calcite production L. Beaufort et al. Title Page Abstract Introduction Conclusions References Tables Figures ◭ ◮ ◭ ◮ Back CloseFull Screen / Esc
Printer-friendly Version Interactive Discussion EGU 0 100 200 300 0 100 200 300 400 500 140°W 120°W 100°W 80°W Longitude D e p th (m ) D e p th (m )
MA1 HL1 ST1 ST2 ST3 ST4 ST7 GY2 ST11 ST13 ST14 ST15 EG2 ST17 ST18 ST20 ST21 UP1 UP2
Sphere /ml
Coccolith/ml
Sphere weight Lith weight
Fig. 9. Top Chlorophyll concentration (red) and EGC (Isochrysidales) coccosphere abundance
(blue). The scales have been adjusted at each station. Bottom on top of the chlorophyll a profile, a dot is plotted at the maximum depth of coccosphere density (red), detached coccolith density (blue), weight of coccosphere (green), weight of coccoliths (black).
BGD
4, 3267–3299, 2007 Coccolithophores calcite production L. Beaufort et al. Title Page Abstract Introduction Conclusions References Tables Figures ◭ ◮ ◭ ◮ Back CloseFull Screen / Esc
Printer-friendly Version Interactive Discussion EGU 0 1 2 3 4 5 0 50 100 150 200 BIOSOPE GYR2 (26°01 S - 114°01 W) Other coccolithophores Florisphaera profunda Isochrysidales Coccosphere / ml D e p th (m ) 0 5 10 15 0 50 100 150 200 250 300 350 BIOSOPE STB11 (27°45 S- 107°16 W Isochrysidales Florisphaera Other coccosphere Coccosphere / ml D e p th (m )
Fig. 10. Density in cells/ml of EGC (Isochrysidales) (red), Florisphaera profunda (blue) and
BGD
4, 3267–3299, 2007 Coccolithophores calcite production L. Beaufort et al. Title Page Abstract Introduction Conclusions References Tables Figures ◭ ◮ ◭ ◮ Back CloseFull Screen / Esc
Printer-friendly Version Interactive Discussion EGU
0
0.5
1
1.5
2
2.5
3
3.5
4
-200
-150
-100
-50
0
Temperature difference with surface (°C)
D
e
p
th
o
f
Is
o
c
h
ry
s
id
a
le
s
m
a
x
im
u
m
c
e
ll
d
e
n
s
ity
(m
)
Fig. 11. Temperature difference between the depth of the maximum EGC (Isochrysidales) cell