HAL Id: hal-00304759
https://hal.archives-ouvertes.fr/hal-00304759
Submitted on 1 Jan 2003HAL is a multi-disciplinary open access archive for the deposit and dissemination of sci-entific research documents, whether they are pub-lished or not. The documents may come from teaching and research institutions in France or abroad, or from public or private research centers.
L’archive ouverte pluridisciplinaire HAL, est destinée au dépôt et à la diffusion de documents scientifiques de niveau recherche, publiés ou non, émanant des établissements d’enseignement et de recherche français ou étrangers, des laboratoires publics ou privés.
impacts of the Diama dam on the Senegal River Delta
wetland (Mauritania), using a model based decision
support system
S. Duvail, O. Hamerlynck
To cite this version:
S. Duvail, O. Hamerlynck. Mitigation of negative ecological and socio-economic impacts of the Diama dam on the Senegal River Delta wetland (Mauritania), using a model based decision support system. Hydrology and Earth System Sciences Discussions, European Geosciences Union, 2003, 7 (1), pp.133-146. �hal-00304759�
Mitigation of negative ecological and socio-economic impacts of
the Diama dam on the Senegal River Delta wetland (Mauritania),
using a model based decision support system
S. Duvail
1and O. Hamerlynck
21Centre for Ecology and Hydrology, Crowmarsh Gifford, Wallingford, OX10 8BB, UK 2IUCN, 28 rue Mauverney, 1196 Gland, Switzerland
Email for corresponding author: sduv@ceh.ac.uk
Abstract
The delta of the River Senegal was modified substantially by the construction of the Diama dam in 1986 and the floodplain and estuarine areas on the Mauritanian bank were affected severely by the absence of floods. In 1994, managed flood releases were initiated in the Bell basin (4000 ha) of the Diawling National Park, as part of a rehabilitation effort. The basin was designated as a joint management area between traditional users and the Park authority and a revised management plan was developed through a participatory approach based on a t opographical, hydro-climatic, ecological and socio-economic data. Hydraulic modelling was developed as a tool to support stakeholder negotiations on the desired characteristics of the managed flood releases. Initially, a water balance model was developed. The data were then integrated into a one-dimensional hydraulic model, MIKE 11 (DHI, 2000). When associated with a Digital Elevation Model and a Geographic Information System, (Arc View), the model provided a dynamic description of floods. Flood extent, water depth and flood duration data were combined with ecological and socio-economic data. The water requirements of the different stakeholders were converted to flood scenarios and the benefits and constraints analysed. A consensus scenario was reached through a participatory process. The volume of flood release required to restore the delta does not affect hydro-power generation, navigation or intensive irrigation, for which the dams in the basin were constructed. Hydraulic modelling provided useful inputs to stakeholder discussions and allows investigation of untested flood scenarios. Keywords: wetland restoration, water use conflicts, equity, Senegal River delta, Mauritania, Diawling National Park
Introduction
Until the 1970s, large dams were promoted as an important means of meeting human needs for water and energy. The World Commission on Dams’ 2000 report, an independent assessment based on case studies from all over the world, has shown that many dams under-performed with respect to intended benefits and delivery of services. Also, the negative environmental and social impacts of large dams were largely unanticipated or under-estimated.
By storing or diverting water, dams alter the natural distribution and timing of stream flows. Downstream from a dam, the most common effect is a reduction of the flood peak and, therefore, a reduction of the frequency, extent and duration of floodplain inundation (McCartney et al.,
2000). This reduction in downstream annual flooding may reduce the natural productivity of floodplains and deltas (Bergkamp et al., 2000). The effects are particularly significant for strongly seasonal, flood-related ecosystems such as Saharo-sahelian wetlands. In these systems, where productivity is enhanced by annual flooding and the human uses are regulated by the natural flood calendar, cost-benefit analysis demonstrates that the natural system can be more efficient than the artificial one (Barbier et al., 1997). Furthermore, as these seasonal wetlands are often surrounded by vast low rainfall areas, the wetland production may support the human and animal populations of a much larger region (Adams, 1996).
social impacts are linked to issues of equity. In many cases, large dams are projects where the finance and motivation for their construction come from one group of stakeholders who benefits, while others pay the price in terms of low flows and reduced environmental quality (McCartney et al., 2000).
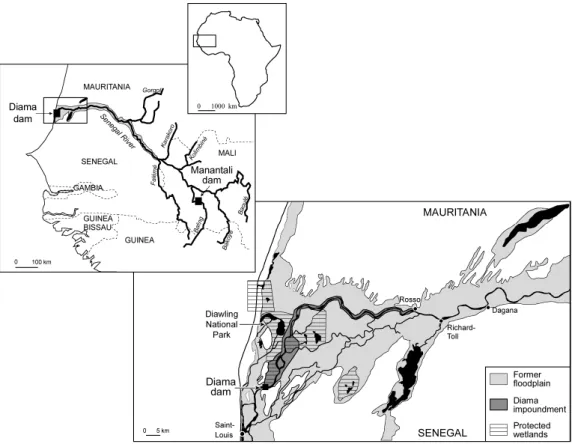
The Senegal iver basin management is an example of the complexity of environmental, economic and social issues linked to dam construction. In the 1970s, in a drought situation, the riparian countries of the Senegal river proposed to solve the food crisis by the introduction of intensive irrigated rice production. They created the “Organisation pour la Mise en Valeur du Fleuve Sénégal” (OMVS) and two major dams were built on the Senegal river (Fig. 1): the Diama dam (completed in 1985) in the delta was conceived to block the dry season influx of sea water into the lower valley. The Manantali dam (completed in 1989) controls the Bafing tributary, which drains high rainfall areas in the Fouta Djalon mountains in Guinea and contributes about 50% of th average runoff in the basin, but up to 70% in drought years (Lazenby and Sutcliffe, 1994). This multi-purpose dam was designed to store and subsequently release water for irrigation, navigation and hydropower production. The environmental and social consequences of the whole
project were underestimated (Cowan, 1999; Adams, A., 1999) while the results of the irrigated agriculture have been far below expectations (Crousse et al., 1991; OMVS et al., 1998). These impacts were particularly severe downstream of the dam in the Mauritanian part of the delta. Before the Diama dam was built, the delta was an estuarine ecosystem. Intense evaporation during the dry season (November to June) would cause an inversion of the estuarine gradient with higher salinities upstream, especially from March to June (Baillargeat, 1964). Local livelihoods were strongly dependent on natural productivity: fisheries (Bousso, 1997), livestock keeping and the production of artisanal mats (Hamerlynck et al., 1999). The local economy collapsed after the construction of the Diama dam and especially after the completion, in 1991, of the reservoir embankment, which isolated the former floodplain from the freshwater flood (Duvail, 2001).
Because irrigation was originally considered to be the priority, the management protocol of the dam was established without the involvement of the non-agricultural users and, therefore, without consideration of their specific water needs. Between 1990 and 2000, the main purpose of the Diama dam, initially designed as a salt wedge dam, evolved towards the supply of water to the irrigated rice
Fig. 1. Map of Africa, with as inset a map showing the Senegal River Basin with the location of the two large dams. The second inset map shows the Senegal River Delta with the former floodplain, the Diama dam impoundment and the various protected wetlands, including the
fields at minimal pumping cost. The water level of the Diama lake was, therefore, raised progressively (Duvail et al., 2002).
In the past ten years, efforts have been made to alleviate the negative impacts of dams (Bergkamp et al., 2000). Actually, some of these adverse impacts are reversible (Hamerlynck et al., 2002) and managed flood releases from the reservoirs can restore downstream productivity. In the Middle Valley of the Senegal River, research led by the Institute for Development Anthropology showed that many of the adverse affects of the upstream dam (Manantali) could be minimised, by maintaining an artificial flood in the Senegal River (Murdock et al., 1994; Salem-Murdock, 1996). Downstream of the second dam (Diama), the restoration project of the Mauritanian delta, had determined a water management scenario to rehabilitate the degraded estuarine and floodplain ecosystems and so reconcile the interests of a diversity of stakeholders.
The restoration project started in 1994 within the framework of the establishment of the Diawling National Park (Fig. 1). The project is based on an ecosystem approach, according to which healthy ecosystems are a fundamental requirement for sustainable development (Pirot et al., 2000). By establishing a hydraulic infrastructure, such as sluice gates and embankments, managed flood releases rehabilitated the former floodplain and restored the estuarine environment (Figs. 2 and 3) (Hamerlynck et al., 1999).
However, restoring the former floodplain is much more complex than just opening sluice gates. In such an artificial wetland, the managed flood releases have to take into consideration environmental sustainability, economic efficiency and social equity. Practically, the questions were:
z how much water to release and when,
z how to adapt the management to observed and perceived
impacts of the artificial flood releases,
z how to promote equitable access to the restored natural
resources and, at the same time, enhance biodiversity. The research objectives were therefore:
z to design, calibrate and validate a model to describe the revised hydraulic functioning of the system,
z to observe the ecological and socio-economic impacts
of the flood releases,
z to simulate several hydrological scenarios.
The paper describes how the hydraulic modelling was conducted and how the correlations between flood characteristics (flood extent, duration and maximum water levels) and resource abundance and resource use were drawn
on to explore various flood scenarios for one of the protected area’s sub-basins, in the context of joint management of the restored wetland by the Diawling National Park authority and the resource users.
Study area
The Bell basin covers approximately 4,000 ha in the centre of the Diawling National Park, a wetland of international importance listed under the Ramsar convention (Fig. 3). It was the first basin to be rehabilitated during the much larger enterprise to restore the floodplains on the Mauritanian bank of the Senegal river by managed flood releases which eventually covered over 40 000 ha (Hamerlynck and Duvail,
in press).
The basin consists of a low-lying plain of alluvial halomorphic soils which floods when water level exceeds 0.9 m IGN (French ‘Institut Géographique National’ datum which approximates Mean Sea Level) . The plain is criss-crossed by a number of channels, which are at about –0.2 m IGN. A saline groundwater layer exists near to the surface (Nicoud, 1974).
In the pre-dam era, the Mréau inflow channel (Fig. 2) connected the basin to the Senegal river and would start flowing with the arrival of the annual flood in August. Through a network of channels, fresh water would flow north, via Berbar to fill the Diawling depression and southwest through the Bell channel, diluting the hypersaline waters of the Ntiallakh. At flood peak, most of the basin would be under water and vast prairies of Sporobulus
robustus would develop. Towards the south-west of the
basin, the ‘Zait’ depression (Fig. 2), used to fill in years with good floods and supported floating rice Oryza barthii (Baillargeat, 1964). The north-western part of the basin, bordering the Ziré dune, was covered by dense stands of
Acacia nilotica (Diawara, 1997).
In the post-dam era, the basin became a virtually barren plain with some Tamarix along the former channels and
Chaenopodiacea colonising the higher ground (Diawara,
1997). In 1991, the basin was integrated into the newly-established Diawling National Park. In contrast with the two other basins in the Park (Diawling to the north and Gambar to the south) (Fig. 3), which were designated as purely conservation areas, management in the Bell basin was undertaken jointly with the local communities. Traditional extractive uses, such as fishing, grazing, gathering of
Sporobolus robustus and Acacia nilotica seedpods for mat
making, were allowed to continue and even encouraged. In 1994, the Lemer sluice gate, built in the Diama embankment (Fig. 3), became operational and a first managed flood release was tested. Flooding was
Fig. 2. Map of the pre-dam hydrology of the Lower Delta of the Senegal River.
supplemented from ‘downstream’ through the Bell sluice gate by an emergency water release from the Diama dam which flooded the lower parts of the city of St. Louis (Fig. 1) and destroyed a number of embankments. In 1995, the managed flood release was supplemented by a much larger, but better planned, release from Diama. In 1996, the hydraulic infrastructure of the basin was completed (the Ziré embankment separated it from the Diawling basin, the Bell embankment from the Ntiallakh basin and the Bell1 and Berbare sluice gates were operational) and therefore total control was established over inflows and outflows. In 1997 and 1998, the basin’s channels were used as conduits to bring fresh water to the Ntiallakh basin in April and May, thus avoiding the hyper-salinity which had all but destroyed the mangrove in previous years (Fig. 4). To prevent the colonisation of the channels by reed-mace Typha
domingensis, no dry season flooding was practised in 1999
and 2000.
Materials and methods
Describing the correlations between the hydrological modifications and the responses of both the ecosystems and the socio-economics required an ambitious programme of data collection across various disciplines through a holistic approach. Data were collected primarily during 18 months of intensive fieldwork, spread over flood and dry seasons from 1996 to 1999. Additional data were obtained from the monitoring system set up by the Diawling National Park staff.
HYDROLOGY AND HYDRAULIC MODELLING
Data acquisition
Water levels relevant to the Bell basin were recorded at six sites upstream and downstream of the inflow and outflow
controlling sluice gates (Fig. 5). For the most accessible sites, daily records were obtained; for the more distant ones, recording frequency varied from daily to weekly. In 1997, two drum and stylus data loggers Ott X were installed at the Lemer sluice gate, one upstream (in the Diama reservoir) and one downstream. To establish the rating curves for the different sluice gates, over 35 flow measurements were made using an Ott C31 current meter.
Climatological data were obtained from an automatic weather station installed at the National Park Headquarters in 1997, which recorded air and soil temperature, wind speed and direction, rainfall, relative humidity and solar radiation. Evapotranspiration, calculated using the Penman (1948)
Fig. 4. Water levels in the Bell basin between 1994 and 1999. When the water level exceeds 0.90m IGN the floodplain starts to be covered by water (grey shading).
formula, was correlated with ‘class A’ pan records from St. Louis airport weather station in Senegal, about 25 km away. Topographical data were combined from two sources. A 1/20,000 base map, dating from 1985, was available (Bocande and Bouette, 1985). It was established by closed loop traverse using a theodolite. The map gives altitude at points 200 m apart to a precision of 0.1 m. Wind-driven erosion and deposition are strong modelling forces on the salty floodplains which had been dry and without vegetation, except for a few temporary rainfed depressions, throughout the major part of the years 1986 to 1994. Consequently, the morphology of many of the former floodplain channels had altered considerably. Therefore, additional altitude measurements were obtained using Mira Z differential GPS in June 1999, essentially in the channels but also in the depressions and on the floodplains. Simultaneously, altitudes were established, to 0.1 m precision, for all hydraulic infrastructures, stageboards, data loggers, piezometers and a series of wells.
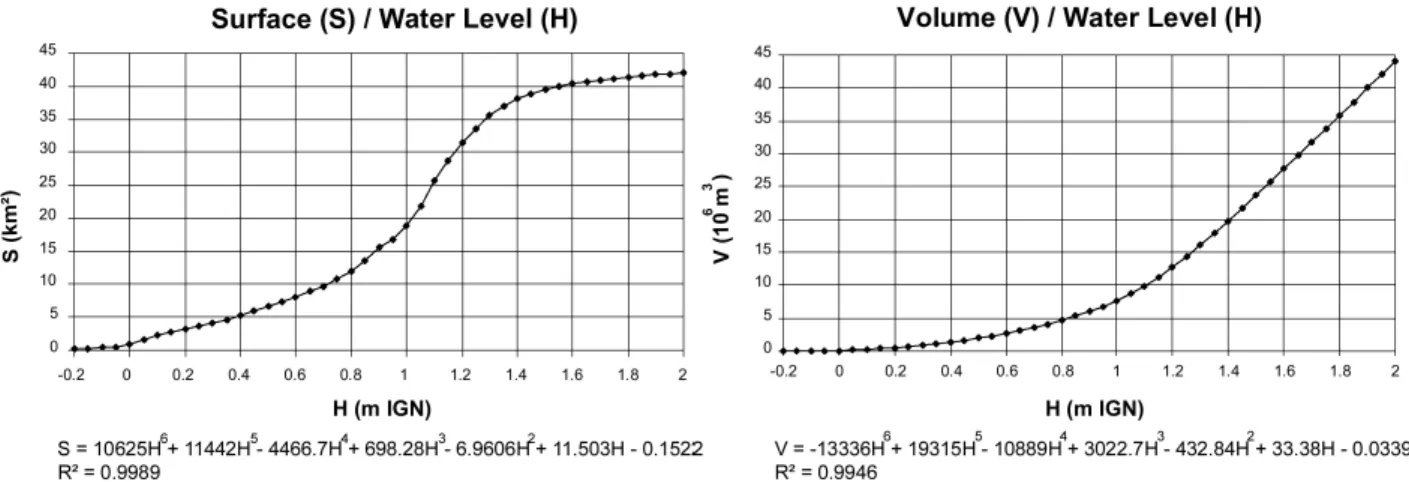
All data were digitised (1340 points) and incorporated into a digital elevation model (DEM) through a kriging method of interpolation on a 50 × 50 m grid, using Surfer software. Storage-elevation relationships were established through a cut-and-fill method. Polynomials were fitted through the data points and drawn as morphometric curves showing water level (in m IGN) versus water surface and water level versus storage.
Hydraulic modelling
Hydraulic modelling comprised a simple water balance model and a hydrodynamic model (Fig. 6).
The water balance models for the basin were established on an Excel spreadsheet using a daily step according to the equation :
Qi + P + R – Qo – E – I + ∆ St = 0 (1)
Fig. 6. Framework of the hydraulic modelling. Data collected are shown in the centre between the model boxes. Their use in the modelling is indicated by arrows. The validation arrow in the flood model is shown as a dotted line because no satellite image could be obtained at
with
Qi = Daily inflows in m3 at Lemer sluice gate
P = Daily rainfall for the basin area in m3
R = Daily runoff in m3
Qo = Daily outflows in m3 at Bell and Berbar
sluice gates
E = Daily evaporation in m3
I = Daily infiltration in m3
∆ St = Daily storage variations in m3
Daily flows for 1997 and 1998 were calculated from instantaneous flows, calculated as in Eqn. (2) (Carlier, 1988; Graf and Altinakar, 2000).
gh mLO Q= 2 (2) with: Q = inflow in m3s–1 L = section width in m O = aperture height in m h = hydraulic head in m g = 9,78
m = hydraulic coefficient (less than 1).
The hydraulic coefficient m for each sluice gate was derived from flow measurements with different apertures and at different hydraulic heads (around 10 measurements for each sluice gate).
Rainfall data were taken from the automatic weather station at the Park HQ.
Surface runoff is very low because of the general flatness of the basin and the permeability of the sandy soils of the dunes at their edges. It was estimated as 1% of rainfall volume, the same as was used in a study of Lake Bam in Burkina Faso (Ibiza, 1972).
Evaporation losses were calculated using data from the class A pan of the St. Louis weather station which correlates with Penman evapotranspiration calculated for the Park Headquarters’ weather station (N=452, R²=0.552, p<0.0001).
Infiltration and exchanges between the saline ground water (Loyer, 1989) and surface water were ignored, given the low permeability of the heavy clay soils in the basin. At water levels above 1.1 m IGN, daily infiltration into the sandy dunes at the basin’s edges was based on instantaneous flows calculated from Darcy’s equation (Cosandey and Robinson, 2000) :
I = KS(H/e) (3)
with:
I = flow in m3s–1
K = hydraulic conductivity at saturation1
S = area in m²
H = hydraulic head in m
e = thickness of the sandy column in m
Daily storage variations deduced from the resolution of the water balance equation were converted to water levels using the storage-elevation relationship. The model estimates of water levels were calibrated for 1997 and 1998 using an iterative testing procedure.
Because of the importance of the spatial distribution of flood level and duration for the natural resources, the hydrological data were incorporated into a hydrodynamic model MIKE 11 (DHI, 2000).
Within the MIKE 11 module, the morphometry of the hydraulic framework is described by defining the cross-section of the channels. The inflows calculated previously are inserted as boundary conditions upstream of the model and the water levels observed are inserted as boundary conditions downstream.
In a second step, the resulting calculations were transferred into MIKE 11 GIS which uses the Arc View Geographic Information System (ESRI) as an interface. In this manner, a simple one-dimensional hydraulic model, combined with the DTM, allows the development of two-dimensional flood maps of the flooded area; flood duration and flood level are additional outputs.
SPATIAL CORRELATION OF HYDROLOGICAL CONDITIONS, NATURAL RESOURCES AND THEIR USES
Geo-referenced data, with an emphasis on the resources important to the local communities, were also collected. These concerned vegetation (distribution, biomass and nutritional quality of annual and perennial plants consumed by livestock, plus the main species used in artisanal products:
Sporobolus robustus for matmaking and Acacia nilotica
seedpods for tanning), fish production and waterbirds (important for tourism). Various resource use strategies and activity schedules were also recorded (Duvail, 2001).
Subsequent to the 1994 flood release, a vegetation map was drawn using a mixture of vegetation cover and a species dominance index (Boudet, 1984) and permanent monitoring plots were demarcated. After each flood season the map was updated. In 1998, landscape units were defined on the basis of geomorphology, soil characteristics and vegetation. The edges of these units were geo-referenced in the field by
1 The value chosen for the hydraulic conductivity coefficient K was estimated
GPS.
As from 1996, during the fishing season (October– February), the number of active fishermen, the total catch per species, fishing gear used, number of hours of fishing and value of the catch were noted. The intensity of monitoring depended on the intensity of the fishing activities and was every two days during the most intense period just after the closure of the sluice gates. The results are expressed as income per fisherman per day during the fishing season. Annual African waterfowl census data were used for water-birds. These counts are held in mid-January and have covered the Mauritanian delta since 1993. The numbers are correlated with the previous year’s flood.
Both the hydrodynamic model and the data on the natural resources and their uses were integrated into the GIS. No attempts were made to analyse the complex relationships between flooding, productivity and resource use. Comparing the spatial distributions of the flood characteristics (flood extent, flood duration and maximum flood level) with the spatial distribution of high quality pasture, quantities of
Sporobolus collected and fish catch, brings out at best
semi-quantitative correlations that cannot be extended beyond the range of floods observed. However, within that range, the resource responses appear to be predominantly flood-dependent and are easily categorised as beneficial or detrimental by the resource users.
EXPRESSION OF THE USERS’ WATER REQUIREMENTS
In early 1994, a participatory process was initiated with the communities of the lower delta in order to develop a joint management system for the restored wetland (Hamerlynck
et al., 1999). After the initial Participatory Rural Appraisal
by a multi-disciplinary team, in-depth interviews were held with resource users in order to understand traditional resource governance systems (including tenure), to sound out their resource use strategies within each basin and to record their, sometimes conflicting, water requirements.
On the basis of these needs, different flood scenarios were developed and their potential benefits analysed. Feedback from that analysis was discussed collectively and a compromise scenario proposed. This was constrained by external factors such as the ongoing construction of the hydraulic infrastructure, the needs of the artificial estuary and the sluice gate’s earliest opening and latest closure dates, set by OMVS. Maximum flood levels were increased progressively (Fig. 4) and resource users’ perception of flood ‘quality’ was assessed after each season (Hamerlynck and Duvail, in press).
Results and discussion
HYDROLOGICAL RESULTS
Water Balance Models
Using morphometric curves (Fig. 7), the results of the water balance model were transformed to water levels and compared with observations. As the Bell basin is relatively small and characterised by swift flood propagation, the water level rapidly reaches an equilibrium which can be recorded at any one of the basin’s stageboards. However, in the initial flood stages, flooded surface areas are overestimated because sub-basins isolated by sills are included, though not yet inundated. Similarly, at recession, these sub-basins do not empty into the main channels and hold water longer than the model would predict. By correcting these during
Fig. 7. Morphometric curves showing, on the left, the water level to flooded surface area correlation and, on the right, the water level to storage (water volume) correlation. The polynomials fitted through the data and their R² are shown at the bottom of each graph.
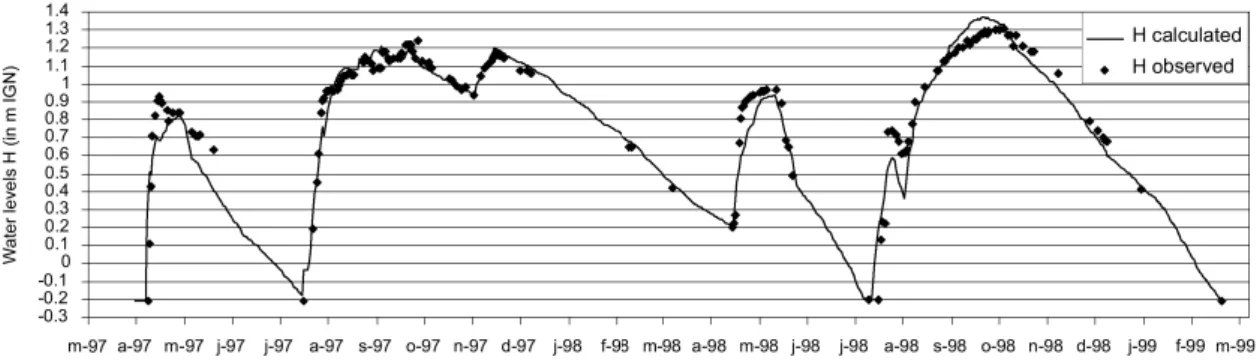
calibration, acceptable fits between predicted and observed water levels are achieved (Fig. 8). As a next step, the 1999 to 2002 data set will be used to test the model.
Hydro-dynamic models (MIKE 11)
The outputs of the model provide maps of water levels at specific dates and can simulate the flood dynamics. The most relevant outputs are the maximum water level and the maps of flood duration. Unfortunately, no satellite images of that year’s maximum flood extent could be obtained to validate the flooded surface area. However, GPS readings of the water’s edge corresponded well with model predictions.
CORRELATIONS BETWEEN FLOOD
CHARACTERISTICS, NATURAL RESOURCES AND THEIR USES
By comparing flood maps with vegetation maps (Fig. 9), favourable hydrological conditions for the development of certain vegetation types can be identified (Table 1). Annual and perennial grasses and sedges reacted promptly to the managed flood releases. Livestock numbers, both resident and transhumant, swelled (Table 2), as did the population of warthogs (Phacochoerus africanus). Sporobolus robustus production and collection for mat making, which had all but disappeared, took off again. The individual income from this activity, once re-established, did not increase (Table 2) because each woman cannot produce more than three mats per year but, for example, the number of women collecting in the Bell basin increased from 105 in 1997 to 175 in 1998. Seedlings from trees such as Acacia nilotica, also increased in abundance but their survival rate will have to be assessed over longer time periods. Because of increasing flood levels, seedlings of the previous years, established in relatively low lying floodmarks, would sometimes not survive prolonged flooding in subsequent years.
For fish production, there exist no spatially disaggregated
Fig. 8. Observed (data points) and water balance model (curves) water levels for the 1997 and 1998 managed flood releases.
Fig. 9. Vegetation map for March 1998. The highest ground, not touched by the 1997 flood, supports Chenopodiacea. The high quality grasses cover large areas in the Northern, Central and Eastern parts of the Basin. Sedges cover the low lying areas. Reedmace patches occur in the channels. The southern part of the basin is barren because of high soil salinity linked to the hydrostatic pressure of the Diama impoundment.
data because the activity is conducted almost exclusively in proximity to the sluice gates, but it is well known that production in floodplains correlates strongly with flood extent and duration (Laë, 1997). Average income per fisherman per fishing day in the basin increased with increasing flood extent (Table 2).
The number of water birds present in the basin in
mid-January increased substantially when water was present after the managed flood releases (Table 2).
In general, the local resource users adapted very quickly to the renewed resource abundance and the economic potential created. The pre-dam spatial distribution of resource use by each of the communities remained largely constant, although new rules were invented for new
Table 1. Optimal growth conditions for some of the characteristic lower delta vegetation, as derived from the comparison of
flood maps and vegetation maps.
Group Species Optimal water Optimal flood Typical growth Use
height during duration station
flood peak
Chenopodiacea Arthrocnemum < 0.05 m < 1 week Nebkas (wind Marginal
macrostachyum blown deposits) grazing for camels
Poacea (grasses) Echinochloa 0.05 to 0.4 m High quality grazing
colona (bovines)
Sporobolus < 0.8 m 2 to 4 weeks Levees and edges Artisanal weaving
robustus of flooded and bulk grazing
Sporobolus depressions
helvolus Bulk grazing
Cyperacea (sedges) Bolboschoenus None
maritimus
Scirpus maritimus 0.8 to 1m Several months Flooded None
Cyperus rotundus depressions None
Cyperus esculentus None
Typhacea (reedmace) Typha domingensis 0.8 to 1m Year round Channels None
Table 2. Bell basin time series from 1992 to 1999 for maximum flooded surface area, grazing pressure (expressed as the
number of cattle counted times the number of days they are present in the basin), number of users (average over the use season) and daily income (during the use season) for gatherers and fishermen, and number of water birds present in mid January of the year subsequent to the flood.
* : no quantitative data available
Flooded Grazing pressure Number of Daily income Number of Daily income Number of
surface (in ha) (number of gatherers per gatherer fishermen per fisherman waterbirds
cowdays) (in US $) (in US $)
1992 0 0 0 0 0 0 0 1993 0 0 0 0 0 0 1 1994 3210 3150 0 0 * * 2437 1995 3320 * 0 0 * * 5932 1996 3430 * * * 16 2,5 3473 1997 3720 147600 105 1 12 6 5302 1998 4000 156600 175 1 21 12 7028 1999 4370 * * * 50 21 4737
situations e.g. the move from a system of individual ownership of fishing sites to a system of rotating individual rights to set nets closest to the sluice gates (where the highest catch rates occur).
External actors were also attracted and this created situations with conflict potential. Women came to collect
Sporobolus robustus from up to 50 km away, from areas
that had also been starved of floods. Large herds of livestock, expelled from the traditional dry season grazing lands by the rice farms, also invaded. Very rapidly, the protected area authority, initially perceived as an organisation ‘grabbing land for birds’, came to be seen by an increasing proportion of the population as a guardian of local resource use rights (Hamerlynck and Duvail, in press).
DEVELOPMENT OF A CONSENSUS FLOOD SCENARIO
In theory, no predictions on natural resource responses can be made outside the observed flood range, though for fisheries one can confidently predict that catches will increase with increasing flood extent and duration (Laë, 1997). Vegetation changes are more difficult to predict and the replacement of high nutrient content grasses, such as
Echinochloa colona, preferred by cattle, by high fibre and
low nutrient sedges at greater water depths and longer inundations is especially critical. Because of the varying water depths in different sub-basins, such non-linear responses can be predicted by making inter-annual comparisons of the same sites under different pilot managed flood releases. Biological knowledge also came into play. At the rising stage of the flood, a maximum rate of increase of water level of 0.01m per day was imposed, allowing the vegetation to grow in step with the rising water level. The rate was based on published maximum rate of water level increase favourable to ‘bourgou’ Echinochloa stagnina (Lecocq, 1987) and on the observation that the faster rates of increase, characteristic of the flood releases practised by the Diama dam operators prior to 1998, did not result in good growth of Sporobolus robustus in the Ntiallakh basin. The risks associated with the intuitive ‘as much water as possible for as long as possible’, which was often the initial reaction of the stakeholders when asked about their water requirements were pointed out in discussion.
Figure 10 depicts the water requirements of the key stakeholders converted into flood scenarios. Fishermen wanted an extensive flood with an early start (they know
Fig. 10. Comparison of flood scenarios. The top three graphs depict the water requirements, as expressed by the main stakeholders, converted to flood scenarios. The fourth graph depicts the fresh water needed to ‘fill’ the artificial estuary. The final graph depicts the proposed consensus scenario.
fish are ready to spawn as from July) and of long duration. Flood scenarios favourable for fish production were also agreeable to the protected area managers as this would favour the presence of piscivorous birds. The collective fishing by groups of over 1000 White Pelicans Pelecanus
onocrotalus, often observed in the basin at flood recession,
were attractive to tourists. Dry season floods had not existed in the pre-dam situation but, once implemented (in 1997 and 1998), they found favour with the livestock keepers. In these years, they did not have to take the cattle, grazing in the floodplain, back to the dunes in the evenings to water them from wells, (a very labour intensive enterprise at 30 litres per cow per day). After their first experience of a dry season flood, they updated their water requirements and wanted a prolonged presence of water in the channels during the dry season. In order to favour high quality pasture, livestock keepers preferred a shorter main flood than the fishermen. As the rainfed pasture on the dunes is rapidly depleted, they also want early access to the basins after flood recession. High quality pastures, especially Echinochloa
colona, attract large numbers of herbivorous waders, such
as Ruff (Philomagnus pugnax) and herbivorous ducks, such as Garganey (Anas querquedula), so pastoralist requirements were also compatible with the Park authority’s objectives. The gatherers, who are women collecting Sporobolus
robustus, insisted that the flood should be preceded by rain,
which would have postponed flooding to late August in most years. This requirement led to animated discussions with the fishermen (their husbands) prior to the first managed flood release. As a compromise it was proposed to simulate rainfall by practising short flood pulses in July to moisten the floodplain and thus initiate the vegetative growth of the grasses. It was also agreed that, should this test turn out to be unfavourable, alternating floods would be practised, one year favouring fish, the next year favouring Sporobolus
robustus. Fortunately, the results of the ‘rain simulation’
test were positive; it would certainly have been difficult to impose on the fishermen a long wait for the flood release.
Sporobolus robustus typically grows best in slightly brackish
water (van der Zon, 1992). Managing the basin for
Sporobolus robustus production was compatible with the
protected area objectives, as the flooded grasslands are the ideal breeding site for Black Crowned Crane (Balearica
pavonina), which expanded its population from 1 couple in
1994 to 10 in 1999. Brackish water is also favoured by zooplanktivorous waterbirds such as flamingos (Phoenicopterus ruber), one of the top tourist attractions, and shoveler ducks (Anas clypeata) for which the basin became an important wintering ground. The women did not like the dry season flood because it blocked their access, through the floodplain, to the Sporobolus robustus stands,
forcing them to walk further along the embankments. According to the calculations made by Gannet Fleming
et al. (1980), replacing the hyper-saline waters in the
Ntiallakh by fresh water would require a flow of 18 m3s–1,
but ecological considerations constrained that option. If the water covered the floodplain, it was expected that germination of annual plants would be initiated with no opportunity to complete the vegetation cycle. This would result in a depletion of the seed bank. The dry season flood releases, transiting through the Bell basin to the artificial estuary in the Ntiallakh, had to be confined to the channels and therefore below 0.90 m IGN.
External constraints include the opening and closing dates set by OMVS and the maximum water level that is safe for the embankments. For example, while the new embankments were under construction (1995 and 1996), flood levels were kept low to avoid damage by wave action. Gradually, as the natural vegetation took hold at the lower margins of the mud embankments, favoured by a gradual slope of the embankment (1 m vertical for 4.5 m horizontal) and the construction of ditches and levees (Hamerlynck and Cazottes, 1998), higher maximum flood levels could be achieved. Also, during the rainy season, strong westerly winds dominate and, at high flood levels, wave action can damage the main embankment of the Diama reservoir. The approaches to this embankment are devoid of vegetation because of its steep slope (1 m vertical for 2 m horizontal) and because the hydrostatic pressure of the reservoir has caused a rise in the level of the highly saline groundwater (over 60 g per litre) effectively sterilising the soil. Flood levels exceeding 1.20 m IGN could therefore be practised only late in the season (October), when the dominant wind direction would shift to the north.
The Park authority set the maximum water level for the dry season flood release and required sufficiently long periods in which the entire basin is dry to avoid obstruction of flow by the colonisation of the channels by Typha
domingensis.
Even without any biology-based response models, it was found that it is relatively easy to predict which resources and which areas will respond favourably (or unfavourably) to a particular untested flood scenario and, with increased experience, stakeholder confidence in the predictive capabilities of the technical staff was enhanced.
Initially, the flood scenarios were developed intuitively but as the models gradually came into being they could be used to look into specific questions which could feed into the discussions. For example, during the 1997 flood release, OMVS closed the sluice gates early to repair an embankment. The Park authority, worried about the migratory waterbirds, and the fishermen, fearing that the
basin would dry out too early, successfully negotiated for a second flood release after the repairs. However, if the water balance model had already been operational at the time, it would have shown that the channels would not dry out before the start of the dry season flood. This would have signalled the risk of the invasion of the channels by Typha
domengensis, leading to obstruction of flood propagation.
In an average year, flooding of the Diawling Park requires 142 M m3 of water to be released from the Senegal River.
This is only around 1% of the volume released through the Diama dam to the ocean as part of routine operations. Even the counter-season floods practiced in the Bell basin require only 10% of the dry season releases through Diama. Consequently, there is no negative impact of the restoration on any other activities, including navigation, hydropower generation and intensive irrigation, for which the dams in the basin were built.
Conclusions
The data collection and research required for hydraulic modelling, interacted favourably with the participatory process of the development of the joint management plan. The need for standards for the ‘optimal’ flood required the formalisation of local knowledge and extensive interviews on resource use strategies with the stakeholders. This informed the Park authority’s technical staff with the perceptions and needs of the stakeholders and opened two-way communication channels between them. Prudent initial flood releases also permitted a familiarisation with the artificial system for both the stakeholders and the managers, through ‘learning by doing’. Though the models still need to be tested using more recent water level data and satellite images, scientific knowledge, research and modelling provided essential inputs to an informed debate on flood scenario development. In the consensus scenario, most of the qualitative water requirements could be accommodated, though quantitatively each of the stakeholders had to settle for less than the optimum. In case of perceived (or real) incompatible water requirements, the models allow exploration of compromise scenarios, either by segregating responses temporally (one year favouring fish, the next year pasture) or spatially (favouring one resource in one of the basins and another in another basin).
Both economically and ecologically, the managed flood releases can outperform the natural flood by freeing the system from climatic variability and thus eliminating years with little or no flooding. Higher flood levels are desirable economically because of higher productivity, but may lead to undesirable ecological changes. Without models to explore the borderline between the two responses, the
managers would be restricted to very cautious testing of various flood levels. The model context allows for safer exploration of optimal economic performance versus increased risk of irreversible changes. The volume of flood release required to restore the delta does not affect hydro-power generation, navigation or intensive irrigation. Interestingly also, untried scenarios can be explored, such as: can the dry season flood for the dilution of the Ntiallakh be done through the Diawling basin and how much water is needed for that? Managed floods, sustained by the modelling as a tool, can help local stakeholders adapt the floods to their needs instead of adapting their needs to the floods (or the absence thereof).
This project provides an example of implementation of the recommendations of the World Commission on Dams (WCD, 2000) through ecologically and sociologically beneficial operation of a dam-based infrastructure within the basin, agreed through stakeholder participation.
Acknowledgements
The restoration effort of the lower delta of the Senegal river was financed by DGIS, the Dutch Development Aid Agency and implemented by IUCN, the World Conservation Union. The first author was supported by a grant from the French Ministry of Research and by the French CNRS programme
Systèmes Ecologiques et Actions de l’Homme. The
Fondation Internationale du Banc d’Arguin provided funds for equipment and fieldwork. Local stakeholders, technical staff of the Diawling National Park, members of the Wetlands Research Group (GREZOH) of the University of Nouakchott and staff of the ‘Travaux Spéciaux’ group at the French National Institute for Geography (IGN) participated in the fieldwork. All these contributions are gratefully acknowledged.
References
Adams A., 1999. Social impacts of an African dam: equity and
distributional issues in the Senegal river valley. Contributing
paper for the World Commission on Dams, Cape Town, www.dams.org. 35 pp.
Adams, W.M., 1996. Economics and hydrological management of African floodplains. In: Water Management and Wetlands in
Sub-Saharan Africa. M.C. Acreman and G.E. Hollis (Eds.),
IUCN, Gland, Switzerlan. 21–33.
Baillargeat, P., 1964, Hydrologie du delta du Sénégal (rive droite
du fleuve ). SOGREAH, Campagnes 1961, 1962 et 1963, extrait
du R 8 622, 84 pp + annexes
Barbier, E.B., Acreman, M. and Knowler, D., 1997. Economic
valuation of wetlands: a guide for policy makers and planners.
Bergkamp, G., McCartney, M., Dugan. P., McNeely, J. and Acreman, M., 2000. Dams, Ecosystem functions and
Environmental Restoration. Thematic Review II.1, prepared as
an input to the World Commision on Dams, Cape Town, www.dams.org.
Bocande and Bouette, Diop, M., 1985. Levé topographique du
bas delta mauritanien au 1/20000ème. USAID, 4 maps.
Boudet, G., 1984. Manuel sur les pâturages tropicaux et les
cultures fourragères. Manuel et précis d’élevage n°4, IEMVT,
French Ministry of Development Cooperation, Paris, France, 266 pp.
Bousso, T., 1997. The estuary of the Senegal river : the impact of environmental changes and the Diama dam on resource status and fishery conditions. In: African inland fisheries, aquaculture
and the environment, K. Remane (Ed.), Fishing News Books,
Oxford, U.K. 45–65.
Carfantan, J.C., 1996, Hydrogéologie du delta du fleuve Sénégal.
Evolution depuis la mise en service du barrage de Diama (novembre 1986). University of Strasbourg, CNRS, SEAH
programme, Unpublished mission report, 9 pp.
Carlier, M., 1972. Hydraulique générale et appliquée. Collection de la Direction des Etudes et Recherches d’Electricité de France, n° 14, Paris, Eyrolles, 259 pp.
Cosandey, C. and Robinson, M., 2000. Hydrologie continentale. Paris, Armand Colin, 360 pp.
Cowan, G.I., 1999. Rehabilitation of Wetlands: An African Perspective. In: An International Perspective on Wetland
Rehabilitation, W.M. Streever (Ed.), Kluwer Academic ,
Dordrecht, The Netherlands. 43–53.
Crousse, B., Mathieu, P. and Seck, S.M., 1991. La vallée du fleuve
Sénégal, évaluations et perspectives d’une décennie d’aménagements. Paris, Khartala, 380 pp.
DHI, 2000. MIKE 11 General Reference Manual. DHI – Water & Environment, Horsholm, Denmark.
Diawara, Y., 1997. Formations morphopédologiques et les unités floristiques du bas-delta mauritanien. In: Environnement et
littoral mauritanien, F. Colas (Ed.), Actes du colloque, 12-13
juin 1995, Nouakchott, Mauritanie. CIRAD, Montpellier, France. 47– 52.
Duvail S., 2001. Scénarios hydrologiques et modèles de
développement en aval d’un grand barrage. Les usages de l’eau et le partage des ressources dans le delta mauritanien du fleuve Sénégal. Unpublished Ph.D. thesis, University Louis Pasteur
of Strasbourg, France. 313 pp.
Duvail, S., Hamerlynck,O. and Ould Baba,M.L., 2002. Une alternative à la gestion des eaux du fleuve Sénégal ? In:
Integrated Wetlands and Water Resources Management, G.
Bergkamp, J.Y. Pirot and S. Hostettler, (eds.). Proc. workshop,
2nd Int.l Conf. Wetlands and Development (November 1998,
Dakar, Senegal). IUCN, Wetlands International, WWF, Gland, Switzerland. 89–97.
Gannett Fleming Corddry and Carpenter Inc. and ORGATEC, 1980. Assessment of Environmental Effects of proposed
developments in the Senegal River Basin. Organisation pour la
Mise en Valeur du fleuve Sénégal, Dakar, Senegal. 158 pp. Graf, W.H. and Altinakar, M.S., 2000. Hydraulique fluviale,
écoulement et phénomènes de transport dans les canaux à géométrie simple. Traité de Génie Civil de l’Ecole Polytechnique
Fédérale de Lausanne, 16, Presses Polytechniques et Universitaires Romandes, 628 pp.
Hamerlynck, O. and Cazottes, F., 1998. Le Parc National du Diawling: Infrastructures hydrauliques pour la restauration d’une plaine d’inondation et la création d’un estuaire artificiel. Sud-Sciences et Technologies. Bulletin semestriel de l’Ecole
Inter-états d’Ingénieurs de l’Equipement Rural, Ouagadougou, 1, 28–38.
Hamerlynck, O. and Duvail, S., in press. Fielding the ecosystem
approach: the reconstruction of the ecosystems of the Mauritanian lower delta. Publications of the IUCN Wetlands
programme, Gland, Switzerland.
Hamerlynck, O., Ould Baba, M.L. and Duvail, S., 1999. The Diawling National Park, Mauritania: joint management for the rehabilitation of a degraded coastal wetland. Vida Silvestre
Neotropical, 7, 59–70.
Hamerlynck, O., Messaoud, B. ould, Braund, R., Diagana, C.H., Diawara, Y. and Ngantou, D., 2002. Crues artificielles et cogestion: la réhabilitation des plaines inondables au Sahel. Le Waza Logone (Cameroun) et le bas-delta du fleuve Sénégal (Mauritanie). In: Gestion Intégrée des Ressources Naturelles
en Zones Inondables Tropicales, D. Orange, R. Arfi, M. Kuper,
P. Morand and Y. Poncet (Eds.). Colloques et Séminaires, IRD Editions. 475–500.
Ibiza, D., 1972. Mesure de l’évaporation d’un lac en climat sahélien : lac de Bam (premiers résultats). Cahiers ORSTOM, Série
Hydrologie (FRA), 9, n° 3, 47–64.
Laë, R., 1997. Effects of climatic changes and developments on continental fishing in West Africa : the examples of the central delta of the Niger in Mali and coastal lagoons in Togo. In:
African Inland Fisheries, Aquaculture and the Environment,
K. Remane, (Ed.), Fishing News Books, Oxford, UK. 66–-86. Lazenby, J.B.C. and Sutcliffe, J.V. 1994. Transitional control of the River Senegal. In: Integrated River Basin Development, C. Kirby and W.R. White, (Eds.), Wiley, Chichester, UK. 503– 513.
Lecocq, G., 1987. Germination et croissance du bourgou
(Echinochloa stagnina). Faculté des Sciences Agronomiques,
Gembloux, Belgium, 79 pp.
Loyer, J.Y., 1989. Les sols salés de la basse vallée du fleuve
Sénégal. ORSTOM, Collection études et thèses, 137 pp.
McCartney, M.P., Sullivan, C. and Acreman, M.C., 2000.
Ecosystem Impacts of Large Dams. Contributing Paper, prepared
for Thematic Review II.1: Dams, ecosystem functions and environmental restoration, World Commision on Dams, Cape Town, www.dams.org, 75 pp.
Nicoud, 1974. Aménagement de L’Aftout Es Sahel, Etudes
préliminaires et schémas directeurs d’aménagement. Rapport
hydrogéologique, SOGREAH, Grenoble, France. 72 pp. OMVS - SOGREAH - Coyne and Bellier, 1998. Etude
complémentaire des endiguements du fleuve Sénégal. Première phase. Rapport d’inventaire – diagnostic, OMVS, Dakar,
Senegal, 64 pp. + annexes.
Penman, H.L., 1948. Natural evaporation from open water, bare soil, and grass. Proc. Roy. Soc., London, A193, 120–145. Pirot, J.Y., Meynell, P.J. and Elder, D., 2000. Ecosystem
Management : Lessons from around the World. A Guide for Development and Conservation Practioners. IUCN, Gland,
Switzerland and Cambridge UK, 129 pp.
Salem-Murdock, M., 1996. Social science inputs to water management in the Senegal River Valley. In: Water Management
and Wetlands in Sub-Saharan Africa, M.C. Acreman and G.E.
Hollis, (Eds.), IUCN, Gland, Switzerland. 125–144.
Salem-Murdock, M., Niasse, M., Magistro, J., Nutall, C., Kane, O., Grimm, K. and Sella, K., 1994. Les barrages de la
controverse. Le cas du fleuve Sénégal. Harmattan, Paris, France.
318 pp.
Van der Zon, A., 1992. Graminées du Cameroun. Wageningen
Agr. Univ. Papers, 92, 558 pp.
World Commission on Dams, 2000. Dams and Development, a