HAL Id: hal-03031446
https://hal.archives-ouvertes.fr/hal-03031446
Submitted on 1 Dec 2020HAL is a multi-disciplinary open access archive for the deposit and dissemination of sci-entific research documents, whether they are pub-lished or not. The documents may come from teaching and research institutions in France or abroad, or from public or private research centers.
L’archive ouverte pluridisciplinaire HAL, est destinée au dépôt et à la diffusion de documents scientifiques de niveau recherche, publiés ou non, émanant des établissements d’enseignement et de recherche français ou étrangers, des laboratoires publics ou privés.
Plasma-metal oxides coupling for CH4-CO2
transformation into syngas and/or hydrocarbons,
oxygenates
Nassim Bouchoul, Elodie Fourre, Alysson Duarte, Nathalie Tanchoux,
Christophe Louste, Catherine Batiot-Dupeyrat
To cite this version:
Nassim Bouchoul, Elodie Fourre, Alysson Duarte, Nathalie Tanchoux, Christophe Louste, et al.. Plasma-metal oxides coupling for CH4-CO2 transformation into syngas and/or hydrocarbons, oxy-genates. Catalysis Today, Elsevier, 2020, �10.1016/j.cattod.2020.06.058�. �hal-03031446�
1
Plasma-metal oxides coupling for CH
4-CO
2transformation into syngas and/or
hydrocarbons, oxygenates
Nassim Bouchoul1, Elodie Fourré1, Alysson Duarte2, Nathalie Tanchoux2, Christophe Louste3, Catherine Batiot-Dupeyrat1*
1IC2MP, ENSIP, Université de Poitiers - UMR CNRS 7285
1 rue Marcel Doré, TSA 41105, 86073 Poitiers cedex 9 (France)
2 ICGM-MACS, UMR 5253, ENSCM, 8 rue de l’Ecole Normale, 34296 Montpellier cedex 5
3 Pprime UPR 3346, 2 Boulevard des Frères Lumière, 86360 Chasseneuil-du-Poitou
E-mail : catherine.batiot.dupeyrat@univ-poitiers.fr
Abstract
Dry reforming of methane was investigated by non-thermal plasma coupled with different metal oxides: BaO, La2O3, ZnO, CaO, -Al2O3, MgO, γ-Al2O3, TiO2 and CeO2. The deposited power was fixed at 8W and the total gas flow at 40 mL.min-1 (75% helium as diluent). Electrical characterization showed that the CO2 and CH4 conversions were enhanced (from 5.6 to 30.6% for CH4 and from 1.9 to 16.1 % for CO2) when the permittivity was reduced from 2903 to 4.1, respectively. Methanol selectivities were favored for the oxides presenting low permittivities, indicating that reaction is favored under a low electric field, thus low density of reactive species. The effect of reaction temperature was evaluated on MgO catalyst. The increase of the temperature favored CH4 conversion, while reducing methanol selectivity. The oxide characterization by TGA revealed the re-hydroxylation of MgO at low temperature, which was correlated to the improved oxygenated compounds selectivities.
2 Introduction
The simultaneous transformation of methane and carbon dioxide into synthesis gas is a well-known reaction, largely studied for decades. The reaction is very endothermic and requires temperatures higher than 700°C and the use of a catalyst to favor the reactant activation. Several catalytic processes have been yet proposed composed of a metal (Pt, Pd, Ru, Ni…) deposited at the surface of a support (Al2O3, La2O3…) [1]. Despite the progress realized, the process still faced two main drawbacks: the high energy cost and the catalyst deactivation due to carbon deposition [2]. Consequently, new concepts and breakthrough processes are still needed to perform the reaction.
Non-thermal plasma is considered as an attractive alternative method for methane and carbon dioxide transformation since it allows this thermodynamically limited reaction to proceed at ambient temperature. The main advantages of non-thermal plasma are the almost absence of starting delay and the direct energy transfer to gas molecules without the need to heat the gas, lowering thus the energetic cost.
The transformation of CH4 and CO2 was studied using a variety of electrical discharges or electron beams leading to plasmas such as corona discharges, gliding arc discharges, dielectric barrier discharges (DBD), plasma needle, plasma jets and micro hollow cathode discharges [3]. Within the variety of non-thermal plasma, DBD plasma presents the advantage of avoiding the formation of an electric arc, due to the presence of a dielectric material between the two electrodes. The application of a high electrical potential difference between two electrodes (few kV) leads to the formation of an intense electric field, where electrons are accelerated and collides with molecules of the gas phase creating plasma filaments. It results in the formation of excited species, such as electrons, radicals, ions or excited molecules. The most of the primary energy is transferred to the electrons (instead of heating the entire gas stream), leading to the formation of a non-equilibrium state where electrons are highly energetic, while the ions,
3
excited and neutral molecules remain at temperature close to ambient. This results in a highly reactive environment favorable to various chemical reactions. Starting from CH4 and CO2, valuable chemicals such as hydrocarbons or oxygenates are commonly obtained [4-6]. However the selectivity towards targeted products is often difficult to achieve due to the occurrence of a large number of reactions in gaseous phase. The coupling of catalyst and plasma was proposed to overcome this drawback [7-11]. Nevertheless, coupling plasma and catalysis in a same reactor is not trivial since the plasma discharge propagation is modified by the presence of a solid possessing dielectric properties. In a classical thermal catalytic process, reactions proceed at the surface of the material into the micro-porosity of the solid, while under plasma discharge, it has been shown that plasma can be generated only in pore sizes larger than the Debye length (~50nm) [12]. The influence of the grain size was also evidenced by authors [13], an improved interaction between the plasma and the surface of the material was shown for the smallest catalyst grains leading to higher reactants conversion.
In many studies, the selected catalysts were similar to those used in conventional thermal catalytic processes, such as Ni/Al2O3, but it was shown that the presence of conductive Ni active sites decreased the electric field strength and consequently the electron density, reducing thus reactants conversion [14]. The combination of non-thermal plasma with different metal oxides was investigated. While alumina possesses no catalytic activity in the reaction of thermal dry reforming of methane, a significant improvement in CH4 and CO2 conversion over Al2O3 was observed when coupled with plasma [15].
Combining catalysis to plasma requires the development of specific materials able to interact with the reactants active species (such as metastable species, radicals and ions). In this respect, the influence of different metal oxides, located in a packed bed DBD reactor, were investigated. These materials were selected due to their physical and chemical properties, in terms of BET surface, permittivity and basicity. Materials possessing a relatively low dielectric constant
(9-4
30) were chosen, since a too high dielectric constant of the packing material limits the discharge to the contact point of the catalyst beads [16].
1. Experimental part
The reaction was performed at room temperature and atmospheric pressure in a coaxial dielectric barrier discharges (DBD) reactor (Fig. 1). The non-thermal plasma reactor consisted in an alumina tube (ID: 4 mm; ED: 6 mm), with a stainless steel electrode centered inside (1.0mm diameter) and a copper electrode wrapped around the alumina tube (100 mm long). Helium, methane and carbon dioxide were flown through the plasma reactor via fine-regulation valves, at a total flow rate of 40 mL.min-1 using a ratio CO2/CH4 = 2, with a constant concentration in He: 75 %, corresponding to a contact time of 1.6s.
A sinusoidal supply of voltage was applied across the electrodes (TG1010A Aim-TTi, Thurlby Thandar Instruments Brand). The discharge power, calculated from the Lissajous figures, was fixed at 8 watts (frequency at 800Hz and voltage at 13.5kV).
Dielectric constants of oxides were determined using an Ametek ®, Solartron Analytical apparatus: a sinusoidal voltage of 50 V was applied with a scan in frequency from 0,1 Hz to 1 MHz. Prior to measurements, the oxides were pressed at 5 tons, producing wafers of 2 mm thick, to neglect the contribution of air permittivity. Wafers were placed in an oven at 120°C before analysis to avoid water adsorption.
Thermogravimetric analysis were performed with a SDTQ600TA analyzer under a 100 mL.min-1 flow of air up to 1173K.
Surface areas were measured according to the BET procedure. The nitrogen adsorptiondesorption isotherms were determined with a Micromeritics Flowsorb II 2300 apparatus at -196°C.
5
The product gases were analyzed using two chromatographs, one equipped with a TCD (3 way µGC Varian Quad CP-4900) and the other one with a FID (Agilent 7220A). The three-way gas chromatograph is equipped with the columns: PoraPLOT Q, CP-Sil 5CB, and a-molecular sieve 5A columns. It allows to analyze on-line within 3 min the gases: H2, CO, CO2, CH4, C2H6, and C2H4. The Agilent chromatograph is equipped with U-bond Restek column for the analysis of oxygenate compounds.
The reaction was performed during one hour, methane and carbon dioxide conversion being stable during this time on stream. The experiments were performed three times by changing the catalyst (when used), a margin error of ±3% was calculated.
The conversion, selectivity, yields and energy efficiency were defined as:
Conversion (%) of CH4 and CO2 = 100 mole of CH4 (or CO2) converted/ mole of CH4 (or CO2) in the feed
The selectivity was calculated based on carbon atoms:
Selectivity to CnHy (%) = 100 n mole of CnHy / (mole of CH4 converted + mole of CO2 converted)
Selectivity to CO (%) = 100 mole of CO / (mole of CH4 + mole of CO2) converted Yield in H2 (%) = 100 mole of H2 /2*(mole of CH4) introduced
Carbon Balance: CB (%) = 100 (mole of CO +∑ n mole of CnHy)/ (mole of CH4 converted + mole of CO2 converted)
2. Results and discussion
2.1 Influence of the oxide chemical nature
The list of oxides and their chemical and physical properties are gathered in Table 1. The oxides possess different surface areas from below 1 m2.g-1 (for BaO and La2O3) to 79 m2.g-1 for CeO2. The dielectric constant (εr) of the oxides measured at a frequency of 800 Hz and 1.106 Hz are
6
compared with values reported in literature in Table 1. Lin et al. [17]used a similar method to measure the dielectric constant of fine grain size CaCu3Ti4O12 materials. The authors showed that εr tends to increase as raising sintering temperature of the material. Moreover, the presence of dopants or impurities strongly affects the value of dielectric constant, which increases from 8300 to 12000 when CuO and Cu2O traces are detected.
Considering TiO2, different values for the dielectric constant are reported in literature, from 58 to >1000. Results show that the dielectric constant depends on the method of synthesis. By example, Rathore et al. [18] obtained different dielectric constants of TiO2 at 1 kHz: 584.3, 176.9 and 218.9 for three samples prepared by a sol-gel method and calcined at 400, 500 and 600°C respectively. Note that as expected the amount of rutile phase was higher in the sample calcined at 600°C. In another study, Wypych et al. [19] concluded that dielectric parameters strictly depended on the rate of anatase-rutile transformation, morphology of investigated powders, and relative density of measured pellets. The highest value of dielectric permittivity (>1000 at 1 kHz) were obtained for rutile phase (TiO2 calcined at 850°C). In our study a high value was obtained for the commercial rutile TiO2 used (εr = 2903).
Note that values obtained at 800Hz differ strongly from those obtained at 1 MHz for TiO2 and -Al2O3. This discrepancy is generally associated with strong absorption at low frequencies due to dipole relaxation [20]. Moreover, -Al2O3 possesses a higher dielectric constant than γ-Al2O3 at 800Hz, while similar values are generally given for and alumina: 9-10 [16, 21]. Literature data gives εr of about 5 for ZnO [22] and 52 for CeO2 [23], which differ significantly from our measurements.
Bhargava et al. [24] obtained a value of approximately 30 for MgO using a method similar to ours, while a value of 9 was proposed by Robertson [25], who calculated the permittivity of a series of metal oxides using an equation as a sum of electronic and lattice contributions. The differences observed between our values and those of Robertson could be due to the interfacial
7
polarizations originating from sub-grain boundary and grain boundary barriers [17], which is not taken into account in the calculation of Robertson. However, a common result is that TiO2 exhibits the highest dielectric constant among the metal oxides studied (εr = 58 for Robertson). Depending of the published work, significant differences are observed for dielectric constants of various metal oxides. It was thus important to perform our own measurements, in similar experimental conditions (same grain size, room temperature) in order to obtain reliable data and classify materials according to their εr values.
The electrical aspect of the DBD reactor filled with -Al2O3 and γ-Al2O3 was considered. As shown in Fig. 2, low current peaks are observed in the presence of -Al2O3 when compared to γ-Al2O3. Similar results were obtained by Jo et al. [26] using spheres of alumina (16-20 mesh). The Lissajous Q-V figures exhibited significant differences for the two alumina oxides, an indication of different effective capacitances. These values were calculated from the slope of the lines AB and CD (as shown in Fig.3 for -Al2O3) and reported in Table 2. The total capacitance of the reactor without plasma (Ccell) was also calculated from the slope of lines DA and CB. The higher effective capacitance for -Al2O3 (than for γ-Al2O3) proves that the electrical properties of the two oxides are different, while similar grain size are used (355-650µm). Thus, the effective capacitance can be related to the dielectric constant obtained at 800Hz.
The selected oxides were introduced in the plasma reactor after sieving all the materials in the range of 355-650 µm. Previous studies showed that the grain size affected significantly the reactants conversion due to their impact on the accessible surface, average size of space and number of contact points between the particles. An improved interaction between the surface of the oxide and the plasma was proposed for the smallest catalyst grains [27, 28]. Methane and CO2 conversions for the different oxides are reported in Figure 4. The values when the plasma zone is filled with quartz wool are also indicated, as a reference value. According to the volume
8
occupied by the quartz wool or by the catalyst grains, the residence times are considered similar, at approximately 1.2 s. The results show that ZnO and TiO2 have a negative effect on the conversion of both reactants. CO2 conversion is slightly improved in presence of CeO2 and BaO when compared to quartz wool, while no increase in CH4 conversion is observed. The presence of the metallic oxides La2O3, -Al2O3, CaO, MgO and γ-Al2O3 favors reactant transformation, the best results being obtained with γ-Al2O3 with CH4 and CO2 conversions of 30.6 % and 16.1 %, respectively. As expected, CO2 conversion is always lower than methane conversion [29-31].
Comparing the reactivity of -Al2O3 and γ-Al2O3, it is important to note that the surface of the two oxides differ strongly as -Al2O3 possesses less OH surface groups than γ-Al2O3. The role of OH sites in the presence of a discharge was discussed by Liu et al. [32]. The authors suggested that materials containing numerous OH groups become the most easily charged; dehydration occurs, leaving oxygen vacancies, which may react to form an active site for methyl radical production.
The results gathered in Fig. 6 show that the best performances in terms of CH4 and CO2 conversion are obtained for oxides with low dielectric constant values. The best results are reached with -Al2O3, MgO and CaO, followed by La2O3, BaO, -Al2O3 and CeO2, while a very low CH4 transformation is observed over TiO2. A negative linear correlation for CO2 conversion with the increasing dielectric constant was shown by Debek et al. [33] using Ni supported catalyst in the glow discharge plasma-catalyst assisted CO2 hydrogenation. The authors attributed this trend to the different packed bed void volumes obtained in presence of catalysts. In our case, the grain size was calibrated so the results cannot be explained according to this parameter. It is accepted that the main plasma parameter affected by the presence of a solid is the electric field, which is enhanced [5, 34]. The field enhancement results from the high local curvature of the grain surface. A clear increase in the high-energy tail of the electron energy
9
distribution was demonstrated in the presence of TiO2 pellets into the plasma reactor by Tu et al. [14]. As a consequence, we believe that, even if the reactive species density is increased with TiO2, the volume of efficient discharge is reduced, and the global transformation of reactants is limited [4, 35].
Among the products formed under plasma discharge, CO and C2H6 are the major ones (Table 3), a maximum CO selectivity of 81% being obtained with CaO, which is associated with a high carbon balance: 97%. The lowest selectivity to CO is of 62% with ZnO and the carbon balance only reaches 75%, suggesting carbon deposition. It seems that the selectivity to CO depends slightly on the material permittivity (Fig. 7), CO being favored over materials possessing the lowest ε value: CaO, BaO. Note that it is also correlated with carbon balance. The results support the hypothesis that, in the localized strong electric field, methane conversion is limited and is transformed into heavy products and/or coke.
In addition to hydrocarbons, a series of oxygenates was detected and quantified: methanol, formaldehyde, acetaldehyde and acetone. Other products (than those listed in table 3) were detected using a mass spectrometer connected at the reactor exit. They were mainly heavier hydrocarbons (C3, C4) and oxygenates, such as acetic acid, but no quantification was possible due to their low concentrations. The ratio H2/CO is far from unity, limited between 0.35 and 0.50, due to the excess of CO2 used in this study (CO2/CH4= 2). Under non-thermal plasma electrons generated possess an energy in the range 1-10 eV, high enough to perform the direct dissociation of CH4 and CO2 according to [36]:
CO2 + e CO+ O + e CH4 + e CH3 + H + e 2 CH3 C2H6 …
The dehydrogenation of methyl radicals can continue leading to the formation of coke, from which CO is produced:
10
C + O CO
The active oxygen species generated by CO2 dissociation can recombinate to O2 or react with methane:
CH4 + O CH3 + OH
In order to estimate the contribution of methane to CO formation, the ratio (R) between the amount of CO produced and CO2 transformed was calculated (a value of unity would indicate that CO is produced by CO2 dissociation).
Under the experimental conditions used in this study, R is always higher than unity confirming that CO is not only obtained through direct CO2 decomposition but also from methane (Fig. 5). R value reaches a maximum with quartz wool suggesting that the presence of metal oxides favors the recombination of oxygen species and consequently inhibits, to a small extend, methane activation through oxygen species.
The selectivity to CO depends strongly on the nature of catalyst, the highest value being obtained with CaO, La2O3 and MgO. Note that the lowest selectivity to CO is accompanied by a low carbon balance for TiO2, CeO2 and ZnO suggesting carbon deposition through methane cracking (CH4 CH3 CH2 CH C) and/or CO and CO2 dissociation (CO → C + O, CO2 C + O2) [37].
Consequently, it confirms that packing materials with high permittivity (TiO2, CeO2) not only is unfavorable for methane conversion but decreases the selectivity to products. The results support the hypothesis that, in the localized strong electric field, methane conversion is limited and is transformed into heavy products and/or coke.
2.2 Influence of temperature
The influence of the reaction temperature was investigated using MgO with a grain size: 355 µm < d < 650 µm, a power of 8W, a temperature range from 100 to 300°C and a CO2/CH4 ratio
11
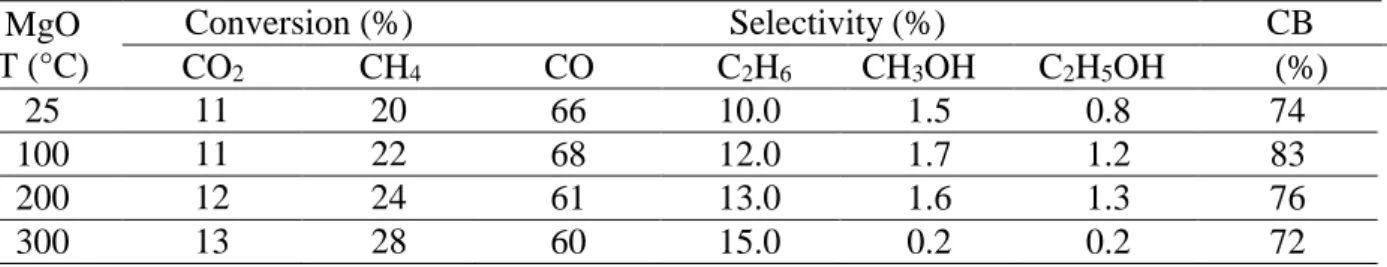
of 2. This oxide was chosen based on its CO2 and CH4 conversion, relatively low permittivity (18.2) and selectivities to oxygenated compounds. A small increase of CO2 conversion is observed while CH4 conversion is significantly enhanced as a function of the reactor temperature (Table 4). In addition to CO and C2H6, oxygenated products quantification showed that their concentrations depend on the reaction temperature. At low temperature, methanol and ethanol formation is favored while at 300 °C, low selectivities are obtained. Methanol synthesis is favored at lower temperature under plasma discharge as shown by Eliasson et al. [38]. It is believed that the production of methanol mainly depends on the formation of CH3 and OH radicals [39]. At higher temperature, the formation of -OH groups is limited at the surface of the catalyst (see TGA analysis) and the coupling of CH3 is favored, decreasing the selectivity into methanol.
2.3 MgO oxide characterization after reaction at different temperatures
TGA-TDA analysis of MgO before and after reaction under plasma are displayed in Fig.8. The weight loss between 250-350 °C is associated with an endothermal effect, suggesting the elimination of hydroxyl groups from the surface according to [40]:
Mg(OH)2 → MgO + H2O
Note that a small weight loss is also present in the temperature range: 500-600 °C, which can be attributed to decarbonation following [41]:
MgCO3 → MgO + CO2
The coupling of TGA with mass analysis confirmed that the first weight loss corresponds to water elimination (m/z=18) and the second one to CO2 elimination (peak corresponding to m/z = 44). Before reaction, TGA analysis of MgO exhibited a weight loss between 500-600 °C
12
indicating that the carbonation of MgO proceeds via atmospheric CO2 adsorption after calcination under air at 800 °C (Fig. 8).
After one hour of reaction at room temperature under plasma, significant differences are observed in the TGA profiles indicating that more hydroxyl groups are present than before reaction. This increase at low temperature could be explained by the involvement of the reverse water gas shift reaction (CO2+ H2→ CO+ H2O) [42] and the subsequent dissociation of water at the surface of MgO.
When the reaction is performed at higher temperature, water desorption from the surface of the oxide is favored and the number of -OH groups is significantly reduced (Table 5). It appears that re-hydroxylation of MgO is favored at room temperature and to a lesser extend at 100°C, which corresponds to the highest oxygenates selectivities.
2.4 Reaction mechanism under plasma in the presence of MgO
Under the experimental conditions used in this study, the transformation of CH4 and CO2 can proceed by electron collision in the gas phase and also at the surface of the material introduced in the plasma zone. It is not possible to indicate precisely the involvement of homogeneous reactions and heterogeneous ones. But, taking into consideration the change in products selectivity and characterization of the material after experiments, surface reactions can be proposed.
The formation of the main product, CO, would occur through direct CO2 dissociation as the most important channel due to the excess of CO2 used in this study [43].
Ethane is obtained by methyl coupling, while methanol can be formed by reaction between radical species CH3 and OH [44].
13
By comparing the results on MgO oxide with those obtained on La2O3/Al2O3 catalyst [8], it is proposed that the dissociation of CH4 at the surface of MgO oxide is favored through molecular and dissociative mechanisms under electric discharge plasma.
- At high temperature, the plasma assisted catalytic dissociation of CH4 would be favored [45, 46]. The selectivity to ethane is also maximum at high temperature, showing that the coupling of methyl radicals at the surface MgO is enhanced according to:
MgO-CH4 ads →MgO-CH3 and 2CH3 → C2H6
- At low temperature, we suggest that surface -OH groups are involved in the formation of oxygenates during plasma treatment, with the best selectivities at low or room temperature, corresponding to the highest concentration of surface hydroxyl groups (see TGA analysis). The dissociation of water (produced through the reverse water gas shift reaction) proceeds according to [47, 48]:
H2O + e H + OH + e H2O + e OH + H
-It is believed that the dissociation of water is favoured at the surface of MgO, as proposed by Nozaki et al. [49] leading to the formation of chemisorbed oxygen-related intermediates such as O and OH. It is also in accordance with the results we obtained since hydroxylation of MgO under plasma is supported by TGA analysis. The presence of such -OH groups would favour the formation of methanol, but to a low concentration since methanol molecule is not stable under plasma discharge, and is easily oxidized into CO and/or CO2 [50].
It is proposed that methanol can be formed through water activation in 2 ways [24]: In the gas phase:
CH4 + He* → CH3 + H + He H2O + e- → OH + H
14
CH3 + OH →CH3OH
At the surface of hydroxylated MgO: CH3+ Mg-(OH)ads → CH3OH
Conclusion
A selection of different oxides: BaO, La2O3, ZnO, CaO, -Al2O3, MgO, γ-Al2O3, TiO2 and CeO2 were characterized and tested in the CO2 and CH4 reaction for the production of syngas, hydrocarbons and oxygenated compounds. The best results were obtained in the presence of γ-Al2O3 with methane and carbon dioxide conversions of 30.6% and 16.1% respectively, while using TiO2, CH4 and CO2 conversions reach only 5.6 and 1.9% respectively. The selectivity to CO and carbon balance were the highest with CaO, La2O3 and MgO. Moreover, the presence in the plasma zone of each metallic oxides, tested as powder of calibrated size, limits, to a small extent, the formation of CO through methane partial oxidation. The reactivity was linked to the permittivity of the oxides: the lower the permittivities, the higher the conversions for both CO2 and CH4. A more detailed study on MgO catalyst revealed that CH4 conversion increased with the temperature, whereas selectivities to oxygenated compounds decreased. This second effect was correlated, via sample characterization, to the presence of surface hydroxyl groups. The higher the surface –OH groups, the better the methanol selectivity.
Acknowledgements
The authors grateful acknowledge the ANR for the financial support of the PRC program VALCO2PLAS and the financial support from the European Union (ERDF) and "Région Nouvelle Aquitaine”
15 References
[1] M.C. J. Bradford, M.A. Vannice, Catal. Rev. 41 (1999) 87-96 [2] E. Ruckenstein, H.Y. Wang, J. Catal. 205 (2002) 289-293
[3] A. Hussain Khoja, M. Tahir, N. A. Saidina Amin, En. Conv. Manag. 183 (2019)529-560 [4] B. Eliasson, W. Egli, U. Kogelschatz, Pure Appl. Chem. 66(6) (1994) 1275-1286
[5] E.C. Neyts, K. Ostrikov, M.K. Sunkara, A. Bogaerts, Chem. Rev. 115 (2015) 13408-13446
[6] Y.R. Zhang, K.Van Laer, E. C. Neyts, A. Bogaerts, Appl. Catal. B: Env 185 (2016) 56-67 [7] C. De Bie, J. Van Dijk, A. Bogaerts, J. Phys. Chem. C 119 (2015) 22331-22350
[8] D. Yap, J.M. Tatibouët, C. Batiot-Dupeyrat, Catal. Today, 299 (2018) 263-271
[9] M.H. Pham, V. Goujard, J.M. Tatibouët, C. Batiot-Dupeyrat, Catal. Today, 171 (2011) 67-71
[10] V. Goujard, J.M. Tatibouët, C. Batiot-Dupeyrat, IEEE Transactions on Plasma Science, 37 (12) (2009) 2342-2346
[11] Y. Uytdenhouwen, K.M. Bal, I. Michielsen, E.C. Neyts, V. Meynen, P. Cool, A. Bogaerts, Chem. Eng. J. 372 (2019) 1253-1264
[12] Q.Z. Zhang, A. Bogaerts, Plasma Sources Sci. Technol, 27 (2018) 35009-35019
[13] P. Kasinathan, S. Park, W.C. Choi, Y.K. Hwang, Y.K.; Chang, J.S.; Park, Plasma Chem. Plasma Process. 34 (2014) 1317-1330
[14] X. Tu, H.J. Gallon, M. V. Twigg, P. A. Gorry, J.C. Whitehead, J.Phys. D: Appl. Phys. 44 (2011) 274007-274017
[15] X. Tu, J.C. Whitehead, Appl. Catal. B Environ. 125 (2012) 439-448
[16] W. Wang, H.H. Kim, K. Van Laer, A. Bogaerts, Chem. Eng. J 334 (2018) 2467-2479 [17] H Lin, W. Xu, H. Zhang, C. Chen, Y. Zhou, Z. Yi, J. Eur. Ceramic Society 40 (2020) 1957–1966
16
[18] N. Rathore, A. Kulshreshtha, R. Kumar Shukla, D. Sharma, Physica B 582 (2020) 411969
[19] A.Wypych, I. Bobowska, M. Tracz, A. Opasinsk, S. Kadlubowski, A. Krzywania-Kaliszewska, J. Grobelny, P. Wojciechowski, Journal of Nanomaterials (2014) 124814 [20] C.C. Homes, T. Vogt, S.M. Shapiro, S. Wakimoto, A.P.Ramirez, Science, 293 (2001) 673-676
[21] M. Taheraslani, H. Gardeniers, Energies 13 (2020) 468-487
[22] A. C. Güler, B. Dindar, H. Örücü, Mater. Res. Express 6 (2019) 065017
[23] D. Matsushita, Y. Nishikawa, N. Satou, M. Yoshiki, T. Schimizu, T. Yamaguchi, H. Satake, N. Fukushima, Jpn. J. Appl. Phys. 43 (2004) 1795
[24] R. Bhargava, S. Khan1, N. Ahmad, M. Mohsin, N. Ansari, Materials Science and Engineering, 577 (2019) 012050
[25] J. Robertson. Eur. Phys. J. Appl. Phys., 28 (2004) 265-291
[26] S. Jo, D.H. Lee, W.S. Kang, Y.H. Song, Y.H., Physics of plasmas, 20 (2013), 123507-8 [27] N. Bouchoul, J.M. Tatibouët, E. Fourré, C. Batiot-Dupeyrat, Plasma Chem. and Plasma Process., 39-4 (2019) 929-936
[28] P. Kasinathan, S. Park, W.C. Choi, Y.K. Hwang, Y.K.; Chang, J.S.; Park,. Plasma Chem. Plasma Process. 34 (2014)1317-1330
[29] X. Tu, J.C. Whitehead, Int. J. Hydrogen En. 39 (2014) 9658-9669
[30] A. J. Zhang, A. M. Zhu, J. Guo, Y. Xu, C. Shi, Chem. Eng. J. 156 (2010) 601-606 [31] W.C. Chung, K. L. Pan, H.M. Lee, M.B. Chang, Energy and Fuel, 28 (2014) 7621-7631 [32] C. Liu, A. Marafee, R. Mallinson, L. Lobban, Appl. Catal. A: gen 164 (1997) 21-33 [33] R. Debek, F. Azzolina-Jury, A. Travert, F. Maugé, F. Thibault-Starzyk, Catal Today, 337 (2019) 182-194
17
[35] W. Wang, H.H. Kim, K. Van Laer, A. Bogaerts, Chem. Eng. J. 334 (2018) 2467-2479 [36] X. Zhang, B. Dai, A. Zhu, W. Gong, C. Liu, Catal. Today 72 (2002) 223–227
[37] Kroker T., Kolb T., Schenk A., Krawczyk K., Mlotek M., Gericke K.H. (2012) Plasma Chem. Plasma Process 32: 565-582
[38] B. Eliasson, U. Kogelschatz, B. Xue, L.M. Zhou, Ind. Eng. Chem. Res. 37 (1998) 3350-3357
[39]L. Wang, Y.H. Yi, C.F. Wu, H.C. Guo, X. Tu, Angew. Chem. Int. Ed. 56 (2017) 13679-13683
[40] J.C. Yu, A. Xu, L. Zhang, R. Song, L. Wu, J. Phys. Chem. B, 108 (2004) 64-70 [41] G. Jauffret, J. Morrison, F. Glasser, J. Therm. Anal. Calorim., 122 (2015),601–609 [42] Y. Nakagawa, A. Kohchi, T. Nishitani, Jpn. J. Appl. Phys. 32 (1993) L1568–L1570 [43] C. de Bie, J. Van Dijk, A. Bogaerts, J. Phys. Chem. C. 119 (2015) 22331-22350
[44] A. Indarto, D. R. Yang, J. Palgunadi, J.W. Choi, H. lee, H. K. Song, Chem. Eng ; and Process. 47 (2008) 780-786
[45] V. Goujard, J.M. Tatibouët, C. Batiot-Dupeyrat, Appl. Catal. A : Gen, 353 (2009) 228-235 [46] Q.Z. Zhang, A. Bogaerts, Plasma Sources Sci. Technol, 27 (2018) 35009-35019
[47] C.J. Liu, G.H. Xu, T. Wang, Fuel process. Technol. 58 (1999) 119–134, [48] J.J. Lowke, R. Morrow, IEEE Trans. Plasma sci. 23 (1995) 661
[49] T. Nozaki, K. Okazaki, Catal. Today, 211 (2013) 29-38
[50] M. Okumoto, H. Kim, K. Takashima, S. Katsura, A. Mizuno, IEEE, Trans. Ind. Appl. 37 (2001) 1618-1624
18 Table 1: Properties of the selected oxides: surface area, pore volume before and after reaction
under plasma (1 hour, grain size: 355-650µm, P=8W, total flow: 40mL/min, CO2/CH4=2, He: 75%) number of surface acid and basic sites.
Oxide
S BET (m2/g) Pore volume
(cm3/g) Dielectric constant Before plasma After plasma Before plasma After plasma εr* (800 Hz) εr *(1 MHz) εr**[ref.] BaO <1 <1 nd nd 4.2 4.0 33 [25] La2O3 <1 <1 nd nd 6.6 5.1 25 [25] ZnO 1.4 1.1 0.004 0.003 10.7 4.3 ~5 [22] CaO 4.5 2.0 0.01 0.01 2.8 2.7 11 [25] Al2O3 6.1 5.5 0.01 0.01 96 3.8 9-10 [16,21, 25] MgO 9.5 9.0 0.01 0.01 18.2 4.3 9-30 [22,25] γAl2O3 65 61 0.2 0.2 3.1 2.9 9-10 [16,21, 25] TiO2 77 69 0.13 0.12 2903 3.0 58-100 to >1000 [16,18,19, 25] CeO2 79 73 0.2 0.2 21.1 6.4 52 [23] nd: not determined * this study ** from literature
Table 2: Capacitance of the dielectric and effective capacitance at 13.5kV
Table 3: Selectivity to products for a series of oxide, 1 hour, grain size: 355-650µm, P=8W,
total flow: 40mL/min, CO2/CH4=2, He: 75% Oxide H2 yield (%) H2/CO CB (%) CO C2H4 C2H6 C3H8 MeOH C3H6O CH2O C2H4O Quartz wool 9.4 80 0.4 14 0.9 0.6 0.4 1.7 0.4 0.36 98 CaO 11 81 0.2 11 1.2 1.0 0.5 1.5 0.2 0.35 97 La2O3 9.4 76 0.4 12 1.4 0.7 0.7 1.6 0.3 0.38 93 MgO 11 74 0.3 11 1.2 1.0 0.6 1.3 0.2 0.38 89 γ-Al2O3 12 70 0.3 8.8 1.2 0.4 0.6 0.9 0.2 0.37 83 α-Al2O3 9.4 69 1.0 11 0.7 0.5 0.6 1.4 0.3 0.43 85 TiO2 1.8 66 0 11 0 0 0 0 0 0.38 77 CeO2 8.0 64 0 8.8 0 0 0 0 0 0.40 73 BaO 8.1 63 0.5 10 0.7 0.6 0.4 1.7 0.3 0.38 78 ZnO 6.7 62 0 13 0 0 0 0 0 0.50 75
Alumina C dielectric (pF) C effective (pF)
γ- Al2O3 9 22
19 Table 4: Influence of temperature on product yield (average value, reaction time: 30 minutes),
MgO grain size: 355-650µm, P=8W, total flow: 40mL/min, He: 75%, ratio CO2/CH4 =2. MgO
T (°C)
Conversion (%) Selectivity (%) CB
CO2 CH4 CO C2H6 CH3OH C2H5OH (%)
25 11 20 66 10.0 1.5 0.8 74
100 11 22 68 12.0 1.7 1.2 83
200 12 24 61 13.0 1.6 1.3 76
300 13 28 60 15.0 0.2 0.2 72
Table 5: TGA analysis after reaction under plasma, grain size: 355-650µm, P=8W, total flow:
40mL/min, He: 75%, ratio CO2/CH4 =2. Oxide Temperature Weight loss (%) (TGA analysis) -OH -CO3 MgO RT 3.6 0.3 100°C 2.0 0.1 200°C 1.1 0.2 300°C 0.8 0.2
20 Figure 1: Reactor scheme
Gap : 1.5 mm
CO2/CH4/He : 40mL/min
Gas out
Alumina tube
Metal oxide filling the plasma zone: ≈ 1g
HV
Copper electrode
21
Figure 2: Voltage and current waveforms for a) -Al2O3 and b) γ-Al2O3, grain size:
22
Figure 3: Lissajous Q-V figures for -Al2O3 and γ-Al2O3, grain size: 355-650µm, P=8W, total
23
Figure 4: CH4 and CO2 conversion for various oxides, grain size: 355-650µm, P=8W, total
flow: 40mL.min-1, CO2/CH4=2, He: 75%
0 5 10 15 20 25 30 35 CH 4 C onve rsion ( % ) 0 2 4 6 8 10 12 14 16 CO 2 Conver sion (% )
24
Figure 5: Ratio nCO formed/ nCO2 transformed, grain size: 355-650µm, P=8W, total flow:
40mL/min, CO2/CH4=2, He: 75%
0 0,2 0,4 0,6 0,8 1 1,2 1,4 1,6 1,8 γ-A l2 O 3 Zn O B aO C eO 2 α -A l2 O 3 Ti O 2 M gO La 2 O 3 C aO qu artz … n (C O) f /n (C O2 )t
25
Figure 6: Influence of the permittivity on CH4 conversion, grain size: 355-650µm, P=8W, total
flow: 40mL/min, CO2/CH4=2, He: 75%
0 5 10 15 20 25 30 35 1 100 10000 CH 4 Co nv er sio n (%) Permittivity εr γ-Al2O3 MgO La2O3 CeO2 CaO BaO ZnO α-Al2O3 TiO2 0 5 10 15 20 25 1 100 10000 CO 2 Co nv er sio n (%) Permittivity εr γ-Al2O3 MgO La2O3 CeO2 CaO BaO ZnO α-Al2O3 TiO2
26 Figure 7: Influence of the permittivity on CO selectivity and carbon balance, grain size:
355-650µm, P=8W, total flow: 40mL/min, CO2/CH4=2, He: 75%
0 20 40 60 80 100 1 100 10000 selec tiv it y t o CO (%) Permittivity εr γ-Al2O3 MgO La2O3 CeO2 CaO BaO ZnO α-Al2O3 TiO2 0 20 40 60 80 100 1 100 10000 ca rbo n ba la nce (%) Permittivity εr γ-Al2O3 MgO La2O3 CeO2 CaO BaO ZnO α-Al2O3 TiO2
27 Figure 8: TGA-TDA analysis of MgO before and after reaction under plasma, P=8W,
d=350-650µm, total flow: 40mL/min, He: 75%, ratio CO2/CH4 = 2,
Before reaction, after reaction: RT T=100°C, T=200°C, T=300°C
98 98,5 99 99,5 100 0 200 400 600 800 w eigh t (% ) Temperature ( C) before reaction