HAL Id: hal-02133309
https://hal.archives-ouvertes.fr/hal-02133309
Submitted on 29 Mar 2021
HAL is a multi-disciplinary open access
archive for the deposit and dissemination of sci-entific research documents, whether they are
pub-L’archive ouverte pluridisciplinaire HAL, est destinée au dépôt et à la diffusion de documents scientifiques de niveau recherche, publiés ou non,
Ge and Si isotope signatures in rivers: A quantitative
multi-proxy approach
J. Jotautas Baronas, Mark Torres, A. Joshua West, Olivier Rouxel, Bastian
Georg, Julien Bouchez, Jérôme Gaillardet, Douglas Hammond
To cite this version:
J. Jotautas Baronas, Mark Torres, A. Joshua West, Olivier Rouxel, Bastian Georg, et al.. Ge and Si isotope signatures in rivers: A quantitative multi-proxy approach. Earth and Planetary Science Letters, Elsevier, 2018, 503, pp.194-215. �10.1016/J.EPSL.2018.09.022�. �hal-02133309�
1
Please note that this is an author-produced PDF of an article accepted for publication following peer review. The definitive publisher-authenticated version is available on the publisher Web site.
Earth and Planetary Science Letters December 2018, Volume 503 Pages 194-215
http://dx.doi.org/10.1016/j.epsl.2018.09.022 http://archimer.ifremer.fr/doc/00460/57196/
© 2018 Elsevier B.V. All rights reserved.
Archimer
http://archimer.ifremer.fr
Ge and Si isotope signatures in rivers: A quantitative
multi-proxy approach
Baronas Jokubas Jotautas 1, * , Torres Mark A. 1, West A. Joshua 1, Rouxel Olivier 2, Georg Bastian 3, Bouchez Julien 4, Gaillardet Jérôme 4, Hammond Douglas E. 1
1
Department of Earth Sciences, University of Southern California, Los Angeles, CA 90089, USA
2
Institut Français de Recherche pour l'Exploitation de la Mer, Centre de Brest, Technopôle Brest Iroise, 29280 Plouzané, France
3
Water Quality Centre, Trent University, Peterborough, ON K9L 1Z8, Canada
4
Institut de Physique du Globe de Paris (IPGP), Sorbonne Paris Cité, University Paris Diderot, CNRS, Paris 75231, France
* Corresponding author : Jokubas Jotautas Baronas, email address : [email protected]
Abstract :
Solutes derived from the dissolution of silicate minerals play a key role in Earth’s climate via the carbon and other biogeochemical cycles. Silicon (Si) is a unique constituent of silicate minerals and a biologically important nutrient, so tracing its behavior in near-surface environments may provide important insights into weathering processes. However, Si released by weathering is variably incorporated into secondary mineral phases and biota, obscuring signals derived from primary weathering processes. Due to chemical similarities, Germanium (Ge) may help better understand the Si cycle and its relationship to chemical weathering. With this aim, we report new measurements of the concentration and isotopic composition of Ge for both the dissolved and particulate phases of a variety of global rivers. These measurements are combined with analyses of concentration and isotopic ratio of Si on the exact same sample set in order to make direct comparisons of the behavior of these two elements in natural river systems. With this dataset, we develop a new modeling framework describing the full elemental and isotopic systems of these solutes in rivers (i.e., Ge/Si, δ74Ge, and δ30Si). This multi-proxy approach allows us to ascertain the relative importance of biological versus mineral uptake in modulating the fluxes of these elements delivered to the modern ocean. Dissolved δ74Ge composition of rivers studied thus far range from 0.9 to 5.5 ‰ with a discharge-weighted global average of 2.6±0.5 ‰. The Ge isotope composition of riverine suspended and bedload sediments is indistinguishable from silicate source rocks, which is consistent with mass balance expectations. The multi-proxy modeling suggests that, among the watersheds studied here, the isotopic fractionation of Si during secondary mineral phase precipitation (∆30Sisec) ranges from -2.7 to -0.2 ‰, which removes between 19-79% of the initial dissolved Si sequestration, while between 12-54% is incorporated by biota. For Ge, modeling indicates that 79-98% of the dissolved load is incorporated into secondary mineral phases with a ∆74Gesec ranging from -4.9 to -0.3 ‰. The fractionation induced by biological uptake is calculated to range from -2.6 to -1.3 ‰ for ∆30Sibio and -0.7±0.7 ‰ for ∆74Gebio. In addition to improving our understanding of the coupled Ge and Si cycles, our study provides a framework for
2
using multiple isotopic tracers to elucidate the chemical behavior of solutes in natural waters
Highlights
► Ge and Si isotope composition of water and sediments in various rivers is presented. ► Dissolved δ74 Ge range 0.9–5.5‰, river sediment δ74
Ge range 0.5–0.7‰. ► Dissolved δ74 Ge is strongly fractionated due to low chemical Ge mobility. ► Ge/Si-isotope multi-proxy provides quantitative constraints on secondary vs biological fractionation.
are combined with analyses of concentration and isotopic ratio of Si on the exact same sample set in order to make direct comparisons of the behavior of these two elements in natural river systems. With this dataset, we develop a new modeling framework describing the full elemental and isotopic systems of these solutes in rivers (i.e., Ge/Si, δ74Ge, and δ30Si). This multi-proxy approach allows us to ascertain the relative importance of biological versus mineral uptake in modulating the fluxes of these elements delivered to the modern ocean.
Dissolved δ74Ge composition of rivers studied thus far range from 0.9 to 5.5 ‰ with a discharge-weighted global average of 2.6±0.5 ‰. The Ge isotope composition of riverine suspended and bedload sediments is indistinguishable from silicate source rocks, which is consistent with mass balance expectations. The multi-proxy modeling suggests that, among the watersheds studied here, the isotopic fractionation of Si during secondary mineral phase precipitation (Δ30Sisec) ranges from -2.7 to -0.2 ‰, which removes between 19-79% of the
initial dissolved Si sequestration, while between 12-54% is incorporated by biota. For Ge, modeling indicates that 79-98% of the dissolved load is incorporated into secondary mineral phases with a Δ74Gesecranging from -4.9 to -0.3 ‰. The fractionation induced by biological
uptake is calculated to range from -2.6 to -1.3 ‰ for Δ30Sibioand -0.7±0.7 ‰ for Δ74Gebio.
In addition to improving our understanding of the coupled Ge and Si cycles, our study provides a framework for using multiple isotopic tracers to elucidate the chemical behavior of solutes in natural waters.
Keywords: germanium, silicon, isotopes, rivers, weathering, fractionation Highlights:
• Ge and Si isotope composition of water and sediments in various rivers is presented. • Dissolved δ74Ge range 0.9-5.5 ‰, river sediment δ74Ge range 0.5-0.7 ‰.
• Dissolved δ74Ge is strongly fractionated due to low chemical Ge mobility.
• Ge/Si-isotope multi-proxy provides quantitative constraints on secondary vs biological frac-tionation.
1
Introduction
Chemical weathering of rocks determines nutrient supply to ecosystems, landscape evolution, and climate over geological timescales. Understanding weathering processes is challenging in the contemporary environment and even more so in the past. Elemental and isotopic ratios of weathering-derived chemical species in waters and sediments can indirectly trace the myriad of water-rock-life interactions that take place in the critical zone, helping unravel solute sources and biogeochemical transformations. Moreover, the signatures of these proxies preserved in the sedimentary record offer the potential to reconstruct key aspects of weathering systems in the past and to test a variety of hypotheses linking weathering and climate (e.g., Berner et al., 1983; Raymo & Ruddiman, 1992).
With this in mind, a number of elemental and isotopic proxies, such as germanium to silicon ratios (Ge/Si), as well as multiple metal and metalloid stable isotope ratios, have been investigated (e.g., Murnane & Stallard, 1990; Dellinger et al., 2015; Tipper et al., 2012; Frings et al., 2016).
Although these isotopic proxies have alluring potential to improve our understanding of the effects of climatic forcing on critical zone processes, most field studies to date have focused on "calibrating" the proxies, i.e. understanding their isotopic behavior, within the context of biogeochemical processes established via alternative (often conventional) geochemical and geophysical techniques (e.g., von Blanckenburg & Schuessler, 2014; Meek et al., 2016).
Due to the defined boundaries of river catchments, mass balance constraints can be applied in studies of weathering tracers in river water. A mass balance approach can potentially provide quantitative information on the biogeochemical processes that fractionate the tracer of interest (Georg et al., 2006a; Bouchez et al., 2013). However, the associated uncertainties are large due to poor constraints on elemental and isotopic fractionation factors, which can be highly dependent on mineralogy, climate, ecosystem dynamics, or other aspects of the studied watershed (e.g., Wimpenny et al., 2015; Frings et al., 2016). As a result, most isotope weathering studies to date have focused on empirically calibrating isotopic fractionation factors, rather than using the isotopic information to assess the underlying biogeochemical processes (e.g., Hughes et al., 2013; Dellinger et al., 2015; Baronas et al., 2017a).
Here, we explore the range of Ge and Si isotopic and elemental signatures in a number of global rivers. Germanium isotopes (δ74Ge) have recently been shown to fractionate in terrestrial systems (Baronas et al., 2017a). In this study, we present new coupled data on δ74Ge, δ30Si, and Ge/Si. Dissolved and particulate data from the headwaters of the Amazon river system reveal that the Ge and Si systems have distinct isotopic behavior, despite their chemical affinity. Coupling these systems thus provides the opportunity to distinguish between biological and secondary phase controls on the Si cycle. We describe a simple multi-proxy model to quantitatively distinguish between the uptake and fractionation of these two elements between organic (biological) and inorganic (secondary mineral / amorphous) phases. This study significantly expands on the previous riverine δ74Ge dataset (Baronas et al., 2017a), and now includes more of the world’s major rivers (n = 6, allowing for revised estimates of the global riverine composition), as well as the first suspended and bed load sediment δ74Ge data.
2
Methods
2.1
Sample collection
The sample set presented in this study covers a wide range of terrestrial environments, from tropical lowlands, to steep mountain catchments, to glacier-fed streams (Fig. 1). In particular, a number of dissolved and solid samples were collected along the Andes-Amazon elevation gradient in Peru, where previous studies on the geomorphic effects on weathering (Torres et al., 2015, 2016, 2017; Baronas et al., 2017b) provide a detailed context for the interpretation of Ge and Si isotope data.
Due to low dissolved Ge concentrations, 0.5-3 L of river water is needed to obtain >2 ng of Ge required for a δ74Ge measurement. The data set presented here consists of samples collected over several years (Table 1). All samples were collected in plastic bottles or bags, filtered (0.2-0.45 μm), generally within ∼24 h or less, and usually acidified with trace clean HCl or HNO3 shortly
thereafter. Tests showed that acidification is not required to keep Ge and Si in solution (except possibly in very Fe-rich samples) and no effect of filter pore size on Ge or Si composition. The
0
1
2
3
4
5
6
74Ge
diss0
2
4
6
Rivers (n = )
Silicate rocks
Ytra Ranga (Iceland) Watson (Greenland) Andes-Amazon rivers (Peru) Amazon Taconazo (Costa Rica) Negro, Solimões, Madeira Changjiang Mekong, Nam Xong (Laos) Otira (New Zealand) Mackenzie Hawaiian streams Californian rivers Mississippi Peel, Liard Fraser
Grande Rivière à Goyaves (Guadeloupe)
a
b
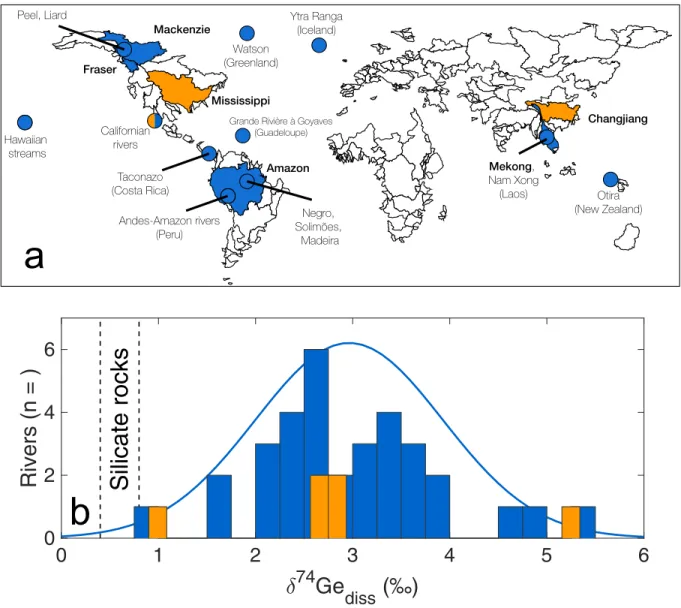
Figure 1: A map of major river basins (exorheic areas only), showing the locations of rivers and streams for which Ge isotope data are now available (panel a). World’s major river basins are outlined. Smaller rivers and streams are shown as circles. Also shown a histogram of dissolved riverine δ74Ge values (b). Blue color indicates primarily pristine rivers, whereas orange color indicates catchments with major anthropogenic perturbation (see Table 1). The solid blue line in panel b shows a normal distribution fit to the pristine riverine data. The range of silicate rock values (Rouxel & Luais, 2017) is denoted by vertical dashed lines. The map is based on WRIBASIN data and was obtained from http://www.fao.org/geonetwork/srv/en/metadata.show?id=30914 .
collection of bedload samples in Peru is described in Torres et al. (2016). For suspended load samples, the sediment was either rinsed off filters with deionized water, centrifuged, and dried, or gently scraped off after drying the filter at 50-60 °C.
2.2
Chemical analyses
A detailed description of all sample preparation and analytical methods is given in Appendix A. Briefly, Si concentrations in solid samples were determined either via ICP-MS after acid digestion or via colorimetry after NaOH fusion. Ge concentrations in solid samples were determined after acid digestion on isotopically spiked aliquots purified for δ74Ge analyses (see below), via hydride generation (HG)-ICP-MS. Two different digestion methods have been tested for both Si and Ge analyses, and the obtained values are compared in Table 2. In addition, a number of certified and previously measured reference materials were analyzed for Si, Ge, δ30Si, and δ74Ge using the different digestion methods. The results of this study agreed well with previously reported values and were reproducible using either of the different digestion methods (Appendix Table A3).
Dissolved major cation and Si concentrations were measured using MP-OES (Agilent 4100). Additional Si analyses were done using molybdate blue colorimetry. Dissolved Ge concentrations were measured using isotope dilution HG-ICP-MS (Baronas et al., 2016).
Si isotope analyses were performed using MC-ICP-MS after cation-exchange chromatographic separation, adapting the method of Georg et al. (2006b). Measurements were done on a Thermo Neptune in medium resolution mode (resolving power m/Δm = 4000) using the Elemental Scientific Instruments Apex interface, at the flat part of the interference-free peak shoulder. Sample runs were bracketed with concentration-matched NBS-28 standard solution and the δ30Si values are reported in ‰ as 30Si/28Si sample ratio normalized to the average 30Si/28Si ratio of bracketing NBS-28 measurements. Signal sensitivity ranged between 6-13 V/ppm28Si (60-130 pA on a 1011Ω amplifier), with each measurement integrated over 4 min and 4-8 replicate bracketed measurements. The possible interference from dissolved organic compounds was tested by digesting several samples (including Rio Negro) with conc. H2O2 prior to chromatography, which yielded δ30Si values
identical to untreated samples, suggesting that any potential matrix effects are negligible.
Ge isotope analyses were performed using HG-MC-ICP-MS after double isotope spiking (spike
73Ge/70Ge = 1, spike/sample Ge mass ratio = 1-2) and anion-exchange chromatographic separation,
adapting the method of Rouxel et al. (2006) and Guillermic et al. (2017). After double spiking but prior to column separation, dissolved Ge in river water samples was pre-concentrated by co-precipitating with Fe oxyhydroxides, settling and centrifuging, and re-dissolving the precipitate in HNO3. Measurements were done on a Thermo Neptune in low resolution mode, using a CETAC HGX-200 hydride generation interface. Each analysis was performed for 8-10 min at a signal intensity of 0.4-6V (4-60 pA on a 1011Ω amplifier) at 74Ge. Sample runs were bracketed with concentration- and spike/sample ratio-matched NIST-3120a standard solution. The δ74Ge values were calculated using the double-spike data reduction routine of Siebert et al. (2001) and are reported in ‰ as74Ge/70Ge sample ratio normalized to the average74Ge/70Ge ratio of bracketing NIST 3120a measurements. There are major differences between the method used in the current study and the one previously employed by Baronas et al. (2017a) to make the first river δ74Ge measurements (a detailed comparison is given in Appendix Table A2). To ensure reproducibility, a number of river samples previously analyzed by Baronas et al. (2017a) were re-analyzed in this study, giving identical results within uncertainty (Table 1).
The δ30Si and δ74Ge measurement uncertainty is reported as the external 2σ standard error of replicate measurements, or the 2σ standard deviation of all bracketing standard measurements within a given analytical session, whichever is higher.
3
Results and discussion
3.1
Ge and Si isotope composition of river-transported solids in the
Andes-Amazon system
First and foremost, the Ge isotope composition of rock, bedload, and suspended load samples falls in the narrow 0.5-0.7 ‰ range (Table 2, Fig. 2) and is indistinguishable from various rocks analyzed previously (Rouxel et al., 2006; Escoube et al., 2012; Rouxel & Luais, 2017). Such δ74Ge homogeneity in solids is in stark contrast with other isotopic weathering tracers, such as δ30Si and δ7Li (Frings et al., 2016; Dellinger et al., 2014, 2017).
1 2 3 4
Ge/Si
sed(µmol/mol)
-1 -0.8 -0.6 -0.4 -0.2 0 30
Si
seda
1 2 3 4Ge/Si
sed(µmol/mol)
0.2 0.4 0.6 0.8 1 74
Ge
sedb
River sediments
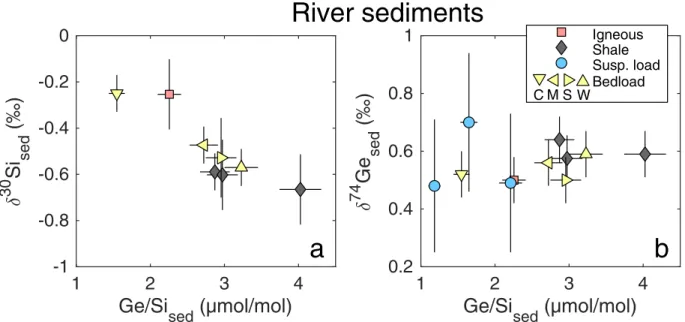
W S M Bedload C Igneous Shale Susp. loadFigure 2: The relationship between rock and river sediment Ge/Si vs. δ30Si (a) and δ74Ge (b) in the Andes-Amazon. Site naming convention retained from Torres et al. (2015) and Torres et al. (2016) (the latter in parentheses): W = Kosñipata riv. at Wayqecha (Mountain-1); S = Kosñipata at Sen Pedro (Mountain-2); M = Alto Madre de Dios riv. at MLC (Mountain-front); C = Madre de Dios river at CICRA (Foreland-floodplain).
A set of river sediment samples spanning the geomorphic gradient from the Andes mountains to the Amazon floodplain was analyzed to investigate the effect of different erosional regimes on river sediment δ74Ge, δ30Si, and Ge/Si composition. The Andean shales and bedloads are enriched in light Si isotopes (-0.67 to -0.18 ‰) relative to igneous rocks (which typically range from -0.3 to 0.3 ‰ (Savage et al., 2013)) and exhibit elevated Ge/Si ratios (Fig. 2a), likely due to previous episodes of weathering or marine authigenesis preceding metamorphism and exhumation. This behavior is analogous to that observed for δ7Li, with shales found to be isotopically lighter due to inheritance from prior weathering (Dellinger et al., 2014, 2017). It may therefore seem surprising that these rocks retain the original primary δ74Ge composition of about 0.6 ‰ (Fig. 2b), given that Ge isotope fractionation occurs both during weathering (Baronas et al. (2017a); see also Section 3.2) and during marine sediment authigenesis (Baronas, 2017). These results are however consistent with the study of Rouxel et al. (2006) showing that deep sea marine clays have δ74Ge values
identical to bulk silicate Earth. The negligible Ge isotopic fractionation of the solids is a result of the low chemical mobility of Ge, i.e., strong retention during clay neoformation, as indicated by continuously increasing clay Ge/Si ratios with continued weathering (Kurtz et al., 2002). The undetectable δ74Ge fractionation of river-transported sediments is therefore qualitatively consistent with the conceptual model of Bouchez et al. (2013), given that typically only a small portion of Ge (<1-2 %) is exported in dissolved form. The behavior of δ74Ge in this case contrasts with that of δ30Si and δ7Li systems, where the neoformed clays are often strongly depleted in heavier isotopes relative to primary silicates, because a significant proportion of these elements (often upwards of 10 %) is exported in dissolved form (Gaillardet et al., 2014, also see Section 3.3.2).
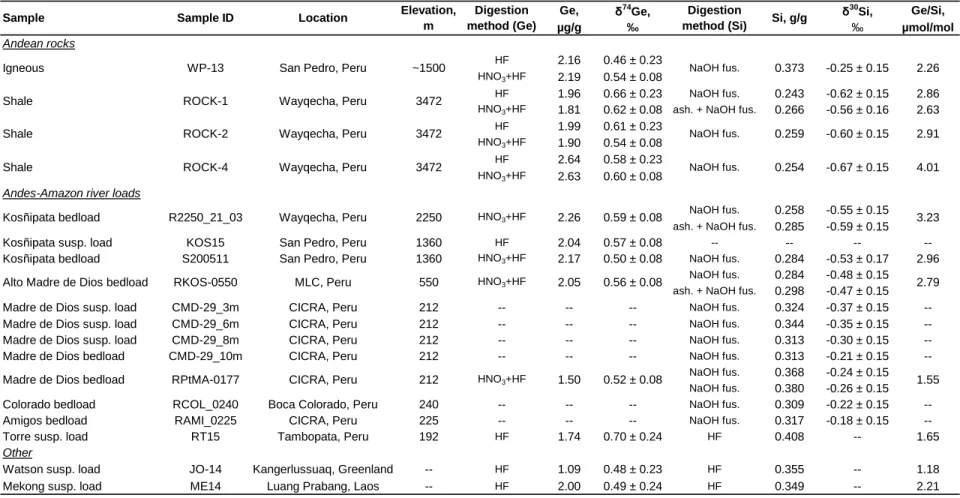
Table 1: Sample details, dissolved Ge and Si concentrations, and isotopic compositions in the world’s rivers studied here.
Ge, Si, Ge/Si, δ30
Si,
pmol/L µmol/L µmol/mol ‰
North America this study
Baronas et al. (2017a)
Mississippi* (Aug 2011) MI11 New Orleans, USA 2011-08-20 29.954 -90.063 mixed 266 166 1.60 2.17 ± 0.24 2.01 ± 0.22 --Mississippi* (Jul 2015) GRO001622 New Orleans, USA 2015-07-07 29.920 -90.140 mixed 215 147 1.46 2.60 ± 0.30 -- 1.70 ± 0.15 Kaweah KW13 Sierra Nevada mts., USA 2013-08-31 34.680 -118.840 gran. 690 210 3.29 2.32 ± 0.07 -- --Lone Pine Creek LPC13 Sierra Nevada mts., USA 2013-08-17 36.595 -118.140 gran. 94 164 0.57 2.46 ± 0.24 -- --Kern (North Fork) KN09 Sierra Nevada mts., USA 2009-03-21 35.916 -118.444 mixed 614 327 1.88 2.70 ± 0.25 2.75 ± 0.22 --Kern* (Lower) KL09 Sierra Nevada mts., USA 2009-03-21 35.916 -118.444 gran. 299 36 8.31 2.56 ± 0.24 3.04 ± 0.22 4.23 ± 0.20 San Gabriel (North Fork) SGN13 San Gabriel mts., USA 2013-07-28 34.343 -117.725 gran. 68 256 0.27 5.20 ± 0.24 5.61 ± 0.22 2.13 ± 0.15 Santa Clara SC13 San Gabriel mts., USA 2013-12-19 34.348 -119.052 sed. 205 414 0.50 3.38 ± 0.08 -- --Hondo* RH08 Los Angeles, USA 2008-12-20 34.098 -118.021 urban 172 290 0.59 5.17 ± 0.24 5.50 ± 0.22 --Los Angeles River* LAR13 Los Angeles, USA 2013-11-21 33.804 -118.205 urban 4011 155 25.9 0.93 ± 0.43 -- --Mackenzie CAN10-(11+14) Tsiigehtchic, Canada 2010-09-07 67.458 -133.727 mixed 64 65 0.98 2.57 ± 0.09 -- 1.15 ± 0.15 Liard CAN10-(46+48) Fort Simpson, Canada 2010-09-13 61.823 -121.298 mixed 55 89 0.62 2.76 ± 0.22 -- 0.96 ± 0.22 Peel CAN10-(03+05) Fort McPherson, Canada 2010-09-07 67.430 -134.906 sed. 76 62 1.22 3.30 ± 0.09 -- 0.96 ± 0.15 Fraser FR15 Fort Langley, Canada 2013-09-30 49.180 -122.567 gran. 39 77 0.51 1.67 ± 0.28 -- 1.12 ± 0.15
Greenland
Watson JO-14 Kangerlussuaq, Greenland 2014-08-27 67.010 -50.682 gneiss 55 33 1.66 0.86 ± 0.24 -- -0.12 ± 0.15
Volcanic islands
Waimano OA14-1 Oahu, Hawai'i 2014-03-01 21.433 -157.922 bas. 47 201 0.24 2.05 ± 0.28 -- --Uhva OA14-2 Oahu, Hawai'i 2014-03-01 21.485 -157.871 bas. 91 492 0.19 3.53 ± 0.28 -- 0.86 ± 0.15 Kahaua OA14-3 Oahu, Hawai'i 2014-03-01 21.548 -157.877 bas. 198 399 0.50 2.54 ± 0.28 -- --Molokai ML09 Molokai, Hawai'i 2009-03-29 21.141 -157.015 bas. 809 823 0.98 2.61 ± 0.24 2.33 ± 0.22 --Iao Valley MA09 Maui, Hawai'i 2009-03-31 20.876 -156.557 bas. 120 354 0.34 3.17 ± 0.24 3.63 ± 0.22 --Ytra Ranga YR15 Hella, Iceland 2015-08-05 63.846 -20.394 bas. 273 364 0.75 3.97 ± 0.23 -- 1.13 ± 0.15 Grande Riviere de Goyave AN-14-(42-44) Basse-Terre, Guadeloupe 2014-06-14 16.205 -61.654 bas. 77 366 0.21 3.59 ± 0.23 -- 1.22 ± 0.15
Asia & Oceania
Changjiang* (Nov 2014) CJ14 Nanjing, China 2014-11-12 32.016 118.676 mixed 262 131 2.00 2.72 ± 0.24 -- --Changjiang* (Jan 2015) CJ15 Nanjing, China 2015-01-10 32.016 118.676 mixed 264 121 2.18 2.50 ± 0.24 -- --Mekong ME14 Luang Prabang, Laos 2014-03-29 19.896 102.136 sed. 240 171 1.41 2.91 ± 0.24 -- --Nam Xong NX14 Vang Vieng, Laos 2014-04-01 18.922 102.445 sed. 84 305 0.28 3.90 ± 0.11 -- --Otira OT14 Southern Alps, New Zealand 2015-01-31 -42.851 171.560 sed. 233 66 3.54 1.61 ± 0.24 --
--Central & South America
Taconazo LS01 La Selva, Costa Rica 2010-05-14 10.432 -84.013 bas. 107 120 0.89 2.58 ± 0.12 -- 0.29 ± 0.13 Kosñipata (Aug 2013) MMD-02 Andes mts., Peru 2013-08-11 -13.058 -71.545 sed. 90 236 0.38 -- 4.96 ± 0.22 0.94 ± 0.15 Kosñipata (Oct 2015) KOS15 Andes mts., Peru 2015-10-25 -13.058 -71.545 sed. 76 192 0.40 3.19 ± 0.28 -- --Carbon MMD-05 Andes mts., Peru 2013-08-12 -12.889 -71.355 sed. 258 188 1.37 -- 3.30 ± 0.22 --Madre de Dios MMD-28 Foreland-floodplain, Peru 2013-08-16 -12.580 -70.096 sed. 107 128 0.84 -- 3.24 ± 0.22 0.82 ± 0.15 Madre de Dios MMD-32 Puerto Maldonado, Peru 2013-08-18 -12.563 -69.176 sed. 147 163 0.90 -- 3.72 ± 0.22 1.08 ± 0.15 Inambari MMD-29 Puerto Maldonado, Peru 2013-08-16 -12.719 -69.752 mixed 211 160 1.32 -- 3.17 ± 0.22 0.74 ± 0.15 Piedras MMD-34 Puerto Maldonado, Peru 2013-08-19 -12.519 -69.248 sed. 113 393 0.29 -- 4.72 ± 0.22 1.53 ± 0.15 Solimões (Jun 2005) AM-05-(05-08) Manacapuru, Brazil 2005-06-04 -3.325 -60.549 sed. 106 158 0.67 2.43 ± 0.09 -- --Solimões (Dec 2014) AM14-36 Manacapuru, Brazil 2014-12-10 -3.317 -60.550 sed. 134 155 0.87 2.01 ± 0.24 -- 1.02 ± 0.15 Negro AM14-40 Manaus, Brazil 2014-12-11 -3.167 -60.004 sed. 70 90 0.78 2.00 ± 0.28 -- 0.56 ± 0.15 Madeira AM06-(34-43) Foz Madeira, Brazil 2006-03-19 -3.408 -58.791 sed. 146 153 0.95 2.50 ± 0.09 -- --Amazon AM06-(23-30) Iracema, Brazil 2006-03-18 -3.318 -58.828 sed. 119 145 0.82 2.54 ± 0.09 -- 0.88 ± 0.15
River
** Dominant lithology. bas. = basaltic; gran. = granitic; sed. = sedimentary.
δ74 Ge, ‰ Dom. lith. ** Long., ° Lat., ° Time sampled Sampling location Sample ID
All samples were taken at the surface (0m), with the following exceptions: AM-05-(05-08) composite of 0-21m; AM06-(23-30) composite of 0-45m (two depth profiles); AM06-(34-43) composite of 0-15m; AN-14-(42-44) composite of surf. samples taken at Duclas and at the mouth; CAN-10-(03+05) composite of 2.5 and 8.5m; CAN-10-(11+14) composite of 5 and 19.4m; CAN-10-(46+48) composite of 1.5 and 4.8m.
* Affected by anthropogenic activity. The Mississippi, Hondo, and Los Angeles rivers are incorporate significant industrial and urban runoff. Changjiang chemistry is affected by extensive irrigation and farming of rice paddies in the floodplain (Ding et al., 2004). Lower Kern river was sampled downstream of a dam reservoir in which water chemistry is strongly modified by diatom growth (Baronas et al., 2017a).
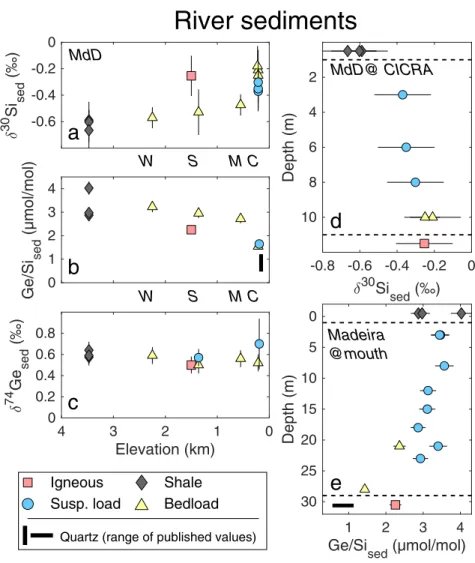
Previous work has shown how the hydrodynamic sorting of sediments in large rivers can result in variations of the elemental (Bouchez et al., 2011) and Li isotope composition of sediments with depth (Dellinger et al., 2014). In deep and wide river channels, the flow velocity and turbulence are lower, allowing larger and denser grains (in many cases quartz and other primary minerals) to preferentially settle into bedload, while smaller clay grains remain suspended (e.g., Bouchez et al., 2011). If there is chemical difference between the fine and the coarse sediments, this can be observed in large river depth profiles. Here we show that hydrodynamic sorting of sediments also affects the δ30Si and Ge/Si composition of samples in the Andes-Amazon system (Fig. 3). At high elevations, the bedload composition of shallow, turbulent streams is indistinguishable from the shale-dominated bedrock (Fig. 3a-c). However, with decreasing elevation along the Andes-Amazon transect, the riverine bedload δ30Si increases and Ge/Si decreases (Fig. 3a,b) - the opposite from an expected weathering signal but expected if hydrodynamic sorting is affecting the bedload composition. Quartz, although not measured in this location, typically has the lowest Ge/Si ratios of all silicate minerals (Mortlock & Froelich, 1987; Kurtz et al., 2002) and higher δ30Si relative to fine sediments (Bayon et al., 2018) and becomes progressively enriched in the river bedload relative to the suspended load during downstream transport (Bouchez et al., 2011), explaining the distinctive trend with elevation in Ge/Si and δ30Si compositions.
The sediment depth profile in the Madre de Dios river is also expected to show a gradient in δ30Si due to sorting, with lower δ30Si near the surface (due to dominance of clay phases) and higher values at depth. The observed trend (Fig. 3d) is consistent with this interpretation, although it must be noted that the trend is small relative to the analytical uncertainty. Nevertheless, a similar sorting effect is seen in Ge/Si signatures further downstream after the Madre de Dios joins other Andean tributaries to become the Madeira River (Fig. 3e, Appendix Table B1). This observation is again consistent with a hydrodynamic separation of clays (high Ge/Si) from heavier igneous minerals (low Ge/Si) (Table 2). However, it is difficult to tell whether the clays carried in suspended load are secondary weathering products formed within the watershed, or derived primarily from the Andean shales (Dellinger et al., 2014) and concentrated near the surface due to sorting.
In contrast to δ30Si and Ge/Si, the downstream sorting effect is not reflected in δ74Ge values of the bedloads in the Andes-Amazon (Fig. 3c), which implies that quartz and other heavier minerals have δ74Ge values similar to the clay-rich suspended load or that these phases add little Ge. Although we lack depth profile data for δ74Ge, the observation from bedload-elevation trend is again consistent with limited Ge isotope fractionation observed in solid samples and the very limited range of δ74Ge in various silicate rocks, despite variations in Ge/Si (Rouxel et al., 2006).
-0.6 -0.4 -0.2 0 30 Si sed
a
0 1 2 3 4 Ge/Si sed (µmol/mol)b
0 1 2 3 4 Elevation (km) 0 0.2 0.4 0.6 0.8 74 Ge sedc
-0.8 -0.6 -0.4 -0.2 0 30Si sed 2 4 6 8 10 Depth (m)d
1 2 3 4 Ge/Sised (µmol/mol) 0 5 10 15 20 25 30 Depth (m)e
River sediments
Madeira @mouth MdD@ CICRA MdD W S M C W S M C Bedload Igneous Shale Susp. loadQuartz (range of published values)
Figure 3: Effects of sediment sorting on δ74Ge, δ30Si, and Ge/Si of solids in the Andes-Amazon. a) δ30Si, b) Ge/Si, and c) δ74Ge relationship with elevation in the Andes-Amazon transect in Madre de Dios watershed (Table 2). Site naming convention retained from Torres et al. (2015) and Torres et al. (2016) (the latter in parentheses): W = Kosñipata Riv. at Wayqecha (Mountain-1); S = Kosñipata Riv. at Sen Pedro (Mountain-2); M = Alto Madre de Dios Riv. at MLC (Mountain-front); C = Madre de Dios Riv. at CICRA (Foreland-floodplain). d) δ30Si and e) Ge/Si composition of suspended sediment as a function of depth in the Amazon floodplain. Also shown is the composition
Table 2: Ge and Si concentrations and isotope compositions of rocks and river sediments. Different digestion methods are described in detail in Appendix A; fus. = fusion, ash. = ashing. For Peru locations, see Torres et al. (2015).
Ge, δ74
Ge, δ30Si, Ge/Si,
µg/g ‰ ‰ µmol/mol
Andean rocks
HF 2.16 0.46 ± 0.23 HNO3+HF 2.19 0.54 ± 0.08
HF 1.96 0.66 ± 0.23 NaOH fus. 0.243 -0.62 ± 0.15 2.86 HNO3+HF 1.81 0.62 ± 0.08 ash. + NaOH fus. 0.266 -0.56 ± 0.16 2.63
HF 1.99 0.61 ± 0.23 HNO3+HF 1.90 0.54 ± 0.08
HF 2.64 0.58 ± 0.23 HNO3+HF 2.63 0.60 ± 0.08 Andes-Amazon river loads
NaOH fus. 0.258 -0.55 ± 0.15
ash. + NaOH fus. 0.285 -0.59 ± 0.15
Kosñipata susp. load KOS15 San Pedro, Peru 1360 HF 2.04 0.57 ± 0.08 -- -- -- --Kosñipata bedload S200511 San Pedro, Peru 1360 HNO3+HF 2.17 0.50 ± 0.08 NaOH fus. 0.284 -0.53 ± 0.17 2.96
NaOH fus. 0.284 -0.48 ± 0.15
ash. + NaOH fus. 0.298 -0.47 ± 0.15
Madre de Dios susp. load CMD-29_3m CICRA, Peru 212 -- -- -- NaOH fus. 0.324 -0.37 ± 0.15 --Madre de Dios susp. load CMD-29_6m CICRA, Peru 212 -- -- -- NaOH fus. 0.344 -0.35 ± 0.15 --Madre de Dios susp. load CMD-29_8m CICRA, Peru 212 -- -- -- NaOH fus. 0.313 -0.30 ± 0.15 --Madre de Dios bedload CMD-29_10m CICRA, Peru 212 -- -- -- NaOH fus. 0.313 -0.21 ± 0.15
--NaOH fus. 0.368 -0.24 ± 0.15
NaOH fus. 0.380 -0.26 ± 0.15
Colorado bedload RCOL_0240 Boca Colorado, Peru 240 -- -- -- NaOH fus. 0.309 -0.22 ± 0.15 --Amigos bedload RAMI_0225 CICRA, Peru 225 -- -- -- NaOH fus. 0.317 -0.18 ± 0.15 --Torre susp. load RT15 Tambopata, Peru 192 HF 1.74 0.70 ± 0.24 HF 0.408 -- 1.65 Other
Watson susp. load JO-14 Kangerlussuaq, Greenland -- HF 1.09 0.48 ± 0.23 HF 0.355 -- 1.18 Mekong susp. load ME14 Luang Prabang, Laos -- HF 2.00 0.49 ± 0.24 HF 0.349 -- 2.21
Sample ID
Sample Digestion
method (Ge)
Digestion
method (Si) Si, g/g Elevation, m Location 3.23 1.55 0.52 ± 0.08 1.50 Madre de Dios bedload
550
212 2250
Alto Madre de Dios bedload
HNO3+HF CICRA, Peru RPtMA-0177 0.56 ± 0.08 2.05 HNO3+HF MLC, Peru RKOS-0550 2.79 ROCK-4 Shale 0.59 ± 0.08 2.26 HNO3+HF Wayqecha, Peru R2250_21_03 Kosñipata bedload 3472 Wayqecha, Peru ROCK-1 Shale 4.01 -0.67 ± 0.15 0.254 NaOH fus. 3472 Wayqecha, Peru 3472 Wayqecha, Peru ROCK-2
Shale NaOH fus. 0.259 -0.60 ± 0.15 2.91
2.26 -0.25 ± 0.15 0.373
3.2
Global riverine Ge isotope and Ge/Si composition
Dissolved riverine Ge is primarily derived from weathering of silicate rocks, whereas carbonate and evaporite minerals typically contain negligible amounts of Ge (Burton et al., 1959). Rivers draining industrialized areas have been shown to exhibit elevated Ge concentrations, most often due to contamination via Ge-rich coal and fly-ash (Froelich et al., 1992). The dataset presented in this study includes various rivers from around the globe, with a focus on relatively pristine catchments. The riverine dissolved Ge isotope composition (δ74Geriv) ranges from 0.86 ± 0.24 to 5.20 ± 0.24
‰ (n = 40), with a standard deviation of 1.02 ‰ (Table 1, Figs 1b and 4), expanding the previously reported range (Baronas et al., 2017a). All rivers measured to date are isotopically heavier than the silicate rocks from which the dissolved Ge is sourced (δ74Gerock = 0.4 – 0.8 ‰; Rouxel & Luais (2017)). Consistent with the previous smaller dataset of Baronas et al. (2017a), there is no identifiable relationship between riverine δ74Ge composition and the dominant watershed lithology (Table 1, Fig. 4), major element proxies (e.g., Ca/Na; not shown, data given in Appendix Table B2), or degree of anthropogenic contamination.
Using the signatures of the major rivers in this dataset (Amazon, Changjiang, Mackenzie, Mekong, and Fraser), the flux-weighted global δ74Geriv value can be estimated, using the mean
river discharge as reported by Milliman & Farnsworth (2011). On this basis, the mean Ge flux-weighted δ74Geriv value is calculated to be 2.62 ± 0.16 ‰ (flux-weighted uncertainty, including
10% error on water discharge and analytical errors of Ge and δ74Ge measurements), significantly lower than the previous preliminary estimate of 3.5±1.5 ‰ (Baronas et al., 2017a). The Mississippi, Changjiang, and Mekong rivers included here are know to be significantly affected by hydrothermal or anthropogenic inputs (Baronas et al., 2016; Han et al., 2015). Excluding these rivers has no effect on global δ74Geriv(2.56±0.15 ‰) but strongly impacts Ge/Sirivwhich is reduced from 0.90±0.06
μmol/mol to 0.68 ± 0.05 μmol/mol, bringing it to closer agreement with the previous estimate of 0.54 μmol/mol that was primarily based on small pristine streams (Froelich et al., 1992).
The large rivers analyzed in this study represent ∼24% of the global water discharge (Milliman & Farnsworth, 2011) and ∼20-30% of the estimated riverine Ge flux to the ocean (there is uncertainty due to anthropogenic contamination). The Amazon River Ge flux (∼0.7 Mmol/y) is higher than all the other rivers in this study combined (∼0.5 Mmol/y) and therefore exerts a strong influence on the calculated flux-weighted composition. The Ge/Si of the Amazon river at Obidos has been measured to vary between 0.57 and 0.79 μmol/mol (n = 3; see Appendix Table B3 and Gaillardet et al. (1999, 2014)). Measurements of the three major Amazon tributaries (Solimões, Madeira, and Negro) all show a remarkably narrow δ74Ge range of 2.0-2.5 ‰ (Table 1). Furthermore, although only two data points are available, there does not appear to be a large seasonal δ74Ge variation in the Solimões (2.0-2.4 ‰). We note that there is currently no δ74Ge data available for two other major Amazon tributaries, the Tapajos and the Trombetas. Considering all of the above, we propose a conservative mean (pristine) discharge-weighted global δ74Gerivof 2.6 ± 0.5
‰, adopting the value calculated above, with a higher arbitrary uncertainty which is intermediate between the flux-weighted analytical uncertainty of large rivers (0.15 ‰, likely an underestimate) and standard deviation of all river samples measured to date (1.0 ‰, likely an overestimate). We expect that this value should encompass any potential inaccuracies due to as of yet unsampled rivers or unconstrained temporal variations in large rivers. For Ge/Si, the Froelich et al. (1992) estimate of 0.54 ± 0.10 μmol/mol is retained. Time-series measurements of the Amazon and other major rivers of the world are needed to refine these values further.
3.3
Mechanisms controlling Ge and Si isotope composition of rivers
3.3.1 Controls on dissolved Ge composition of rivers
The ~5 ‰ range observed globally in dissolved δ74Gerivcomposition is considerable, given the
relatively small mass difference between74Ge and70Ge. As discussed above, such high apparent fractionation is consistent with the fact that only a few percent of Ge is exported in the dissolved phase during weathering (Gaillardet et al., 2014), making it more sensitive to isotopic fractionation in the dissolved load (Bouchez et al., 2013).
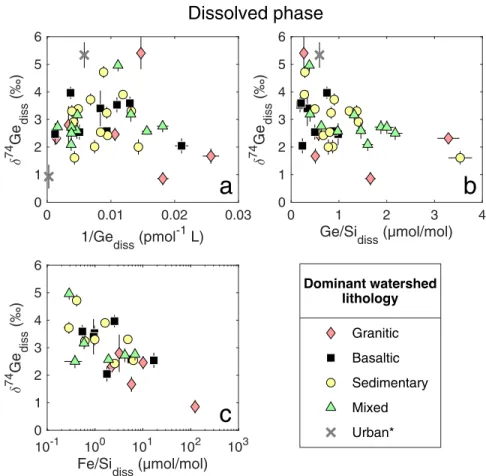
There is no observable relationship between δ74Gerivand dissolved Ge concentration (Fig. 4a),
which is not unexpected, given that Ge concentration can be influenced by a number of factors that do not affect δ74Geriv, such as dilution by rain water and concentration by evaporation. A more
robust negative correlation is observed between dissolved riverine δ74Ge and Ge/Si signatures (Fig. 4b). Ge/Si ratios are primarily fractionated by the formation of secondary weathering products, such as refractory oxides and aluminosilicate clays (Mortlock & Froelich, 1987; Kurtz et al., 2002) and the same process appears very likely to be responsible for δ74Gerivfractionation as well.
0 0.01 0.02 0.03 1/Ge diss (pmol -1 L) 0 1 2 3 4 5 6 74 Ge diss
a
0 1 2 3 4 Ge/Si diss (µmol/mol) 0 1 2 3 4 5 6 74 Ge dissb
10-1 100 101 102 103 Fe/Sidiss (µmol/mol) 0 1 2 3 4 5 6 74 Ge dissc
Dissolved phase Granitic Basaltic Sedimentary Mixed Urban* Dominant watershed lithologyFigure 4: Dissolved δ74Ge composition in rivers draining various lithologies (as designated in Table 1). a) δ74Ge as a function of Ge concentration reciprocal. b) δ74Ge as a function of Ge/Si ratio. c) δ74Ge as a function of Fe/Si ratio.
*Small rivers draining primarily urban areas and with largely paved riverbeds. The Los Angeles river is not shown due to its very high Ge/Si (25.9 μmol/mol).
The good correlation between δ74Gerivand dissolved Fe/Si (Fig. 4c) provides further indication
of the important role that iron might play in Ge isotope dynamics. The siderophilic character of Ge is well documented (Bernstein & Waychunas, 1987; Mortlock & Froelich, 1987; Pokrovsky et al., 2006), including isotopic fractionation of Ge during adsorption and co-precipitation with Fe oxides (Pokrovsky et al., 2014). It is therefore likely that iron oxides in particular strongly affect δ74Gerivsignatures.
Finally, it is possible that riverine δ74Ge is also fractionated by Ge association with organic complexes, such as humic acids (Pokrovski & Schott, 1998), potentially explaining the correlation with dissolved Fe, as the latter is well known to associate with organic compounds (e.g., Allard et al., 2004). However, this is unlikely to provide a systematic explanation for observed compositions, given the similarity in δ74Ge between the DOC-rich Negro River and the DOC-poor Solimões or Madeira (Table 1).
3.3.2 Isotopic fractionation of Ge and Si during secondary weathering processes
Due to precipitation, adsorption, and/or biological uptake, only a fraction of a given element (X) initially released during the dissolution of primary minerals may remain in solution. Previous studies have shown that this fraction, often referred to as fXdiss, where X is the element of interest, can be estimated utilizing a conservative solute that is not significantly incorporated into secondary mineral phases (or taken up by plants), for example, Na (Gislason et al., 1996):
fXdiss = (X/Na)(X/Na)diss
rock (1)
where subscript rock refers to the elemental ratio associated with solute release via primary mineral dissolution, which can often be approximated by analyzing river-transported sediments or using the composition of the Upper Continental Crust (UCC), if river sediment data is unavailable. For accurate fXdiss estimates, dissolved Na concentrations need to be corrected for cyclic salt (rain and evaporite) inputs.
Given that silicate rocks have a limited range of Ge/Si, δ74Ge, and δ30Si compositions (Rouxel & Luais, 2017; Frings et al., 2016), the initial dissolution of their constituent minerals during weath-ering should result in negligible elemental or isotopic fractionation. The variations in dissolved riverine composition should then depend primarily on the degree of removal from solution (fXdiss) and the fractionation factor (α) associated with this removal. Assuming the catchment behaves like a steady state flow-through reactor ("batch" model) (Georg et al., 2006a; Bouchez et al., 2013) yields a linear functional relationship between the elemental or isotopic ratio R and fdiss:
Rdiss = Rrock α+ fXdiss(1 – α)
(2) where α is the fractionation factor (often referred to as the partitioning coefficient in the case of elemental fractionation). In cases where the exchange between the dissolving and precipitat-ing phases is limited, the solution composition may be better described by a Rayleigh equation (Rayleigh, 1902), resulting in a power-law relationship between R and fdiss:
Applying either Eq. 2 or 3 to measurements of river waters assumes that the riverine composition represents a single flowpath of the evolved weathering fluid, and can therefore be represented by a single fXdiss value. Due to the non-linearity of these relationships, this assumption can lead to spurious results if fluids that have undergone variable extents of reaction (and associated isotopic fractionation) are mixed. To account for the effects of mixing, Druhan & Maher (2017) have proposed a revised Rayleigh model that takes into account the mixing of variable water transit times, therefore offering a more realistic representation of the catchment hydrology. As shown by Druhan & Maher (2017), the use of an exponential water transit time distribution results in a relationship between Rdiss and fdiss that is identical to Eq. 2. Equation 2 is derived from a simple mass-balanced chemical fractionation between any two phases (Appendix C1) and was initially applied to elemental mantle-crust differentiation (Hofmann, 1988). From here on we therefore refer to this model as the "mixed open system" model, to acknowledge that both an exponential fluid transit time distribution and open system isotopic exchange between fluids and solids yield the same relationship between Rdissand fdiss. We note that the exact water transit time distribution
in rivers is currently unconstrained. The shape of this distribution in different rivers and its effect on solute isotope signatures requires additional work that is outside the scope of this study.
10-3 10-2 10-1 100 fdissGe 0 1 2 3 4 5 74 Ge diss - 74 Ge rock = -5 = -3 = -1 = -1 = -3 = -5
a
10-3 10-2 10-1 100 fdissSi 0 1 2 3 4 5 30 Si diss - 30 Si rock = -3 = -2 = -1 = -3 = -2 = -1b
Granitic Basaltic Sedimentary Mixed Urban* Dominant watershed lithology Frings et al. (2016) Rayleigh model Mixed open system modelKL09
KL09
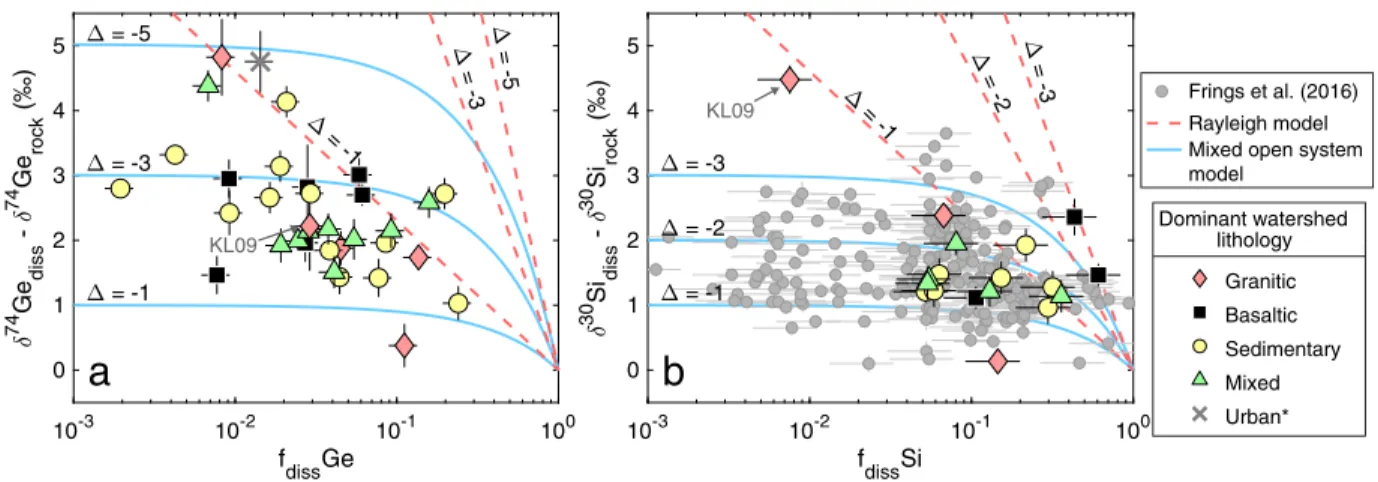
Figure 5: Dissolved δ74Ge (a) and δ30Si (b) composition in rivers as a function of fdissGe and fdissSi, respectively, i.e., the fraction of each element remaining in solution after uptake by secondary weathering phases and biota (see Eq. 1). Lines show theoretical fluid composition evolution with a range of isotope fractionation factors (Δsolid–diss) for both models discussed in text (see Section 3.4.1).
*Small rivers draining primarily urban areas and with largely paved riverbeds.
The relationship between the isotopic composition of Si and Ge and the fraction of each element remaining in solution is shown in Fig. 5. The individual fGediss and fSidiss values for the rivers presented here are given in Appendix Table C1. There are three main take-aways from this compilation. First, both in the case of δ74Gediss and δ30Sidiss, the majority of the data is best explained by the mixed open system model, whereas the Rayleigh model predicts heavier isotopic composition than observed, even for relatively low fractionation factors (Fig. 5). This is not surprising, considering the complex hydrological structure of catchments which results in both continuous chemical interaction of fluids with the rocks (open system behavior) and mixing of fluids with variable transit times (Druhan & Maher, 2017). The one clear exception that requires
a Rayleigh model is the Lower Kern River (KL09) δ30Sidiss composition (Fig. 5b). This strong fractionation is caused by diatom drawdown of Si in a dam reservoir, which we discuss in Section 3.4.
Second, fGediss values are generally about an order of magnitude lower than most fSidiss values, although the latter do span a wide range (Fig. 5, Table C1). This difference is consistent with the contrasting δ74Ge and δ30Si behavior in weathered river sediments, as discussed in Section 3.1.
Finally, the relationships of fGediss vs δ74Gediss and fSidiss vs δ30Sidiss are both weak. This is likely because mixed open system behavior reduces the variability in δdiss at low fdiss values (i.e.
in Fig. 5 the solid lines plateau at low fdiss values in log-space). Nevertheless, significant scatter is observed in both δ74Gediss and δ30Sidiss at any given fdiss value, suggesting that substantial isotopic variability of these solutes is caused by other factors, such as 1) variable reaction products, mechanisms, and rates, resulting in different isotope fractionation factors (Pokrovsky et al., 2014; Frings et al., 2016); 2) variable water transit time distributions (Druhan & Maher, 2017); 3) other isotope fractionation mechanisms not reflected in this simple model, e.g., element cycling by vegetation or other biota; or 4) any combination of the above. Additional insights are required in order ascertain the relative roles of these processes on isotopic ratios.
3.4
Ge/Si-isotope multi-proxy: biological vs. secondary fractionation
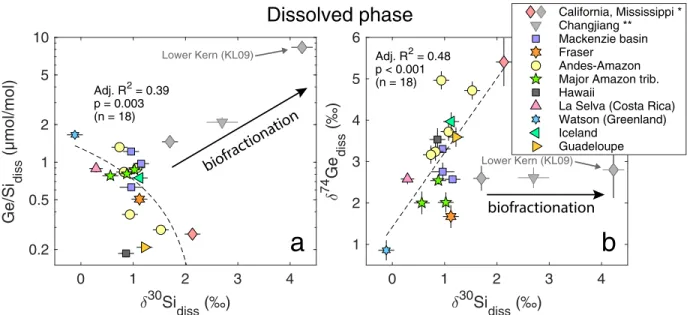
It has been previously demonstrated that the coupled use of δ30Si and Ge/Si can qualitatively deconvolve biological fractionation from that associated with secondary mineral precipitation, since Ge/Si is fractionated in the opposite sense by plants (depleted Ge/Si) relative to secondary minerals (enriched Ge/Si), while δ30Si becomes depleted during both of these processes (e.g., Cornelis et al., 2011). This dual-proxy approach can also be applied on a global scale by comparing the δ30Si and Ge/Si signatures in rivers. Although global compilations of both δ30Si (Frings et al., 2016) and Ge/Si (Froelich et al., 1992) exist, they rely on separate sets of samples, and the potentially large (or poorly constrained) temporal-variability of these signatures has until now complicated the robust comparison of these proxies in riverine signatures on a global scale. As discussed above, each river represents a mixture of subsurface flowpaths and the dashed trends in Fig. 6 can therefore be conceptualized as an expression of variable intra-catchment mixing between two universal end-members (unfractionated and strongly fractionated fluids), or more realistically a continuous probability distribution of fluid compositions. Importantly, the negative correlation between riverine δ30Sidissand Ge/Sidiss(Fig. 6a) demonstrates that to a first-order these signatures
are controlled by secondary mineral precipitation, with notable exceptions where strong biological fractionation is observed. In contrast, biofractionation (as suggested by the offset along a positive slope in Fig. 6a) appears to have little effect on δ74Gediss (no slope in Fig. 6b).
While the qualitative observations provided above are useful, ultimately, the complexity of natural systems means that the isotopic data of a single solute is often insufficient to quantitatively reconstruct the combination of processes that have taken place to impart that signature. However, the combination of proxies can, in certain cases, be used to deconvolve the dominant first order effects controlling isotopic signatures. Below, we propose a model that utilizes the combination of riverine Si and Ge concentrations and isotopic signatures to 1) constrain biological vs. secondary phase uptake of Si and Ge; and 2) refine the empirical estimates of biological and secondary phase isotope fractionation factors of Si and Ge.
0 1 2 3 4 30Si diss 0.2 0.5 1 2 5 10 Ge/Si diss (µmol/mol) Adj. R2 = 0.39 p = 0.003 (n = 18)
a
0 1 2 3 4 30Si diss 1 2 3 4 5 6 74 Ge diss Adj. R2 = 0.48 p < 0.001 (n = 18)b
Dissolved phase
California, Mississippi *Changjiang ** Mackenzie basin Fraser
Andes-Amazon Major Amazon trib. Hawaii
La Selva (Costa Rica) Watson (Greenland) Iceland Guadeloupe biofractiona tion biofractionation Lower Kern (KL09) Lower Kern (KL09)
Figure 6: Relationship of dissolved δ30Si with Ge/Si (a) and with δ74Ge (b) in global rivers. Note the log scale of y-axis in panel a. Statistical parameters refer to the linear regression fit (dashed line). The gray points are samples affected by biological fractionation or anthropogenic disturbance and are not used in the regression: *The Mississippi and Lower Kern rivers, as discussed above; **The Changjiang river, affected by extensive rice paddy agriculture in the floodplain. For the Changjiang, the plotted δ30Si and error bars show the range of values determined by Ding et al. (2004), Ge/Si and δ74Ge data from this study (Table 1).
3.4.1 Ge/Si-isotope fractionation model: description
Within the mixed open system (Eq. 2), the distribution of elemental or isotopic ratios between multiple phases i can be described by a simple mass balance:
Rrock =Õ RifXi = RsecfsecX + RbiofXbio+ RdissfXdiss (4)
where fXis the molar fraction of species X in the denominator of ratio R. Equation 4 represents the uptake of a portion of Si and Ge in secondary mineral and biological phases (subscripts sec and bio, respectively). The equivalence of Eqs 2 and 4 in both two and three end-member cases is demonstrated in Appendix C1.
The individual fractionation factors associated with each process are defined as: αRsec= Rsec
Rdiss (5)
αRbio= Rbio
Rdiss (6)
Finally, maintaining mass balance requires that
fsec+ fbio+ fdiss = 1 (7)
Applying Eqs. 4-7 to Ge/Si fractionation (R = Ge/Si, X = Si) and rearranging yields: 16
fSisec =
Ge/Sirock
Ge/Sidiss – fSidiss(1 – αGe/Sibio ) – αGe/Sibio
αGe/Sisec – αGe/Sibio
(8) As discussed in Section 3.1, river sediment Ge/Si and Si/Na ratios can be affected by dilution with Ge- and Na-poor quartz, especially in the bedload (Fig. 3), which can bias the fSidissand fGediss estimates. To minimize this possibility, we calculate the fraction of Si remaining in solution as:
fSidiss = Si/NadissGe/SiGe/Narock
sed (9)
where Ge/Nasedis the ratio measured in river sediments and Ge/Sirockis the ratio of weathering
silicates. In the absence of robust constraints (e.g. suspended sediment depth profiles) Ge/Sirock was taken to be intermediate between the UCC and acidic quartz-free rocks (Ge/Sirockvalues used for each modeled sample are given in Appendix Table C1). This approach assumes that river bedload Ge/Nasedis a good approximation of primary Ge/Narock, which may not be exactly true. Nevertheless, it results in a more robust estimate of fSidiss because Ge/Na is much less affected by the quartz content of the rocks or sediments than Si/Na (compare UCC and average acidic rock values in Table C1).
Partitioning coefficients αGe/Sisec and αGe/Sibio have been determined by previous workers in a number of settings (often referred to as Kd or Kw) and generally are in the range of 1.2-3 for αGe/Sisec
(Murnane & Stallard, 1990; Froelich et al., 1992) and 0.005-0.56 for αGe/Sibio (Derry et al., 2005; Blecker et al., 2007; Meek et al., 2016). These ranges were used to calculate a range of fSisec and fSibiofor the rivers presented here, with a few exceptions (Table C1; see Appendix C1 for details).
The mass partitioning of Ge between the three phases can be simply obtained from: Ge/Sii = Ge/Sirockf
Ge i
fSii (10)
where i = diss, sec, or bio. Using known Ge/Si partition coefficients (Eqs. 5-6), Eq. 10 allows the calculation of fGesecand fGebio.
Eq. 4 can then be applied to Si and Ge isotope ratios, calculating R30/28diss and R74/70diss (see Appendix C1 for an explicit expression). This is done by assigning random values to the respective αsecand αbiofactors and other input parameters from within the range determined in previous studies (Table C2). The α30/28 (often approximated as Δ30Si in ‰ notation) values are summarized in Frings et al. (2016) and were conservatively assigned as -3 to 0 ‰ for both Δ30Sisecand Δ30Sibio.
There are very few previous estimates of possible Δ74Gesec values and no estimates of Δ74Gebio.
Therefore, a very conservative range of -6 to +6 ‰ has been applied to each.
The calculated R30/28diss and R74/70diss ratios are then compared to the measured values (Table 1). If either of the calculated values is outside of the 2 S.D. analytical uncertainty of the measured value, the whole set of calculations is discarded. The process is repeated 1 million times (i.e., a Monte Carlo approach), retaining only those runs where measured and calculated values agreed within the 2 S.D. analytical tolerance. This approach is immune to auto-correlation effects between variables and allows us to assess the full uncertainty of modeling results given the wide possible range of some input parameter values.
3.4.2 Ge/Si-isotope fractionation model: results and discussion
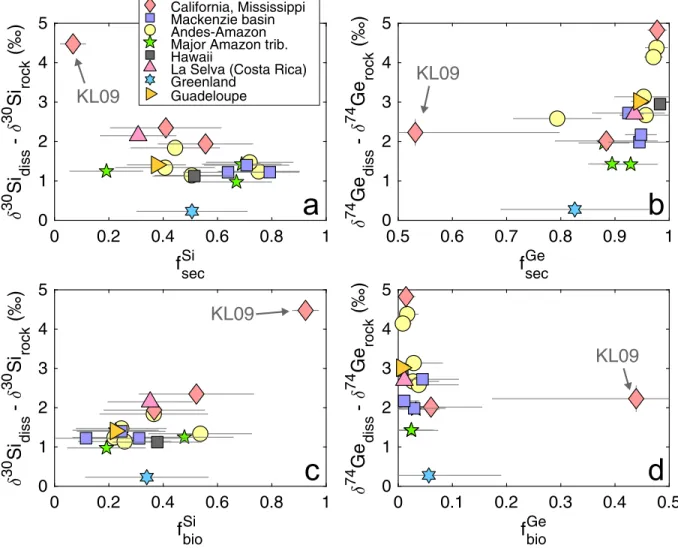
The detailed modeling results are summarized in Appendix Table C3. Excluding the dammed Lower Kern river sample KL09 (see discussion below), the calculated fraction of Si taken up by secondary weathering phases (fSisec) in the sampled rivers ranges from (median±1σ) 19 ± 14% to 79 ± 11% (avg. 54%) and the fraction of Si taken up biologically (fSibio) ranges from 12 ± 11% to 54 ± 19% (avg. 32 %). In contrast, Ge uptake was strongly dominated by secondary phases, with very little biological uptake: fGesecbetween 79-98 % (avg. 92%) and fGebiobetween 1-6 % (avg. 3 %).
0 0.2 0.4 0.6 0.8 1 fsecSi 0 1 2 3 4 5 30 Si diss - 30 Si rock 0.5 0.6 0.7 0.8 0.9 1 fsecGe 0 1 2 3 4 5 74 Ge diss - 74 Ge rock 0 0.2 0.4 0.6 0.8 1 fbioSi 0 1 2 3 4 5 30 Si diss - 30 Si rock 0 0.1 0.2 0.3 0.4 0.5 fbioGe 0 1 2 3 4 5 74 Ge diss - 74 Ge rock KL09 California, Mississippi Mackenzie basin Andes-Amazon Major Amazon trib. Hawaii
La Selva (Costa Rica) Greenland Guadeloupe KL09 KL09 KL09
a
b
d
c
Figure 7: The relationship between the degree of measured apparent isotopic fractionation of dissolved riverine Si and Ge composition and the degree of removal via secondary weathering (a-b) and biological uptake (c-d), as modeled using dissolved Ge/Si composition (see Section 3.4 for model discussion). Lower Kern River sample (KL09) was taken downstream of a dam reservoir and shows an extreme degree of biological Si and Ge uptake by freshwater diatoms. KL09 is out of range in panel b. Symbols are plotted as medians and horizontal error bars as 1 standard deviation of the calculated range of values.
Again excluding sample KL09, neither fSisec nor fSibio shows a strong relationship with the apparent fractionation of riverine δ30Sidiss (Fig. 7a,c; adj. R2 ≈ 0 in each case), suggesting that
both processes fractionate δ30Sidiss to a similar degree. Apparent δ74Gediss fractionation, on the other hand, shows a significant positive correlation with fGesec(Fig. 7b; adj. R2 = 0.32), suggesting that riverine δ74Gediss signatures are primarily determined by fractionation during the formation of secondary weathering phases.
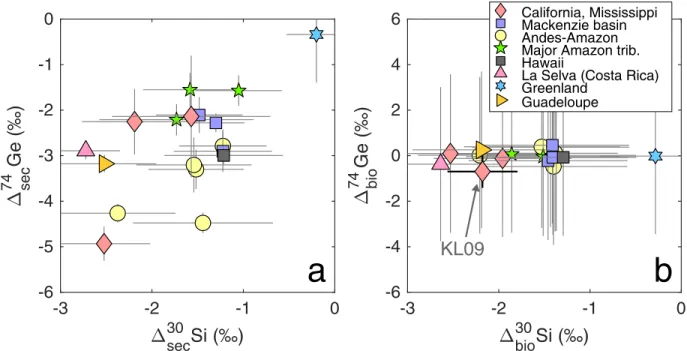
In cases where either fXsecor fXbiodominates the uptake of element X, the value of the fractionation factor ΔXsecor ΔXbio, respectively, can be refined using the measured δXdissvalue, using the approach described above (Eqs. 4-10 and Appendix C1). The detailed results are given in Appendix Table C3 and Figs. C4-C5. Excluding the glacial Watson River in West Greenland (discussed below), the calculated Δ74Gesec ranges from –4.9 ± 0.4 to –1.6 ± 0.4 ‰ (median±1σ), whereas Δ30Sisec
ranges from –2.7 ± 0.4 to –1.1 ± 0.5 ‰. However, due to the fact that Si uptake is more evenly distributed between biological and secondary phases in most rivers, neither Δ30Sisecnor Δ30Sibio
can be determined precisely (Fig. 8). Similarly, Δ74Gebiocannot be determined precisely because only a very small fraction of Ge is usually taken up biologically, having little impact on δ74Gediss. The one exception is Lower Kern River (KL09), where there is extensive biological uptake of Si and Ge by diatoms within a dam reservoir. Using the mixed open system ("batch") model results in an unrealistically large Δ30Sibioof –4.6 ± 0.3 ‰ (Table C3, Fig. C4). If instead a Rayleigh model (Eq. 3) is used for the biological uptake step, a Δ30Sibio of –2.1 ± 0.4 ‰ is calculated, in better
agreement with previous studies of diatom δ30Si fractionation (Frings et al., 2016). The biological uptake and fractionation of Ge isotopes in the Kern River dam reservoir can be modeled even more accurately by taking into account the difference in the composition of rivers entering and exiting the reservoir (Baronas et al., 2017a). Modeling the biological uptake of Ge as a Rayleigh process yields the only reliable estimate of Δ74Gebioat –0.7 ± 0.7 ‰. This result suggests that δ74Gediss is likely to be less affected by biological uptake, in agreement with the qualitative observations described above (Fig. 6b) and with marine diatom culture experiments (Rouxel & Luais, 2017).
The Watson River (JO-14) draining the Russel and Leverett glaciers in West Greenland also deserves a separate mention, given that the isotopic fractionation factors calculated for its watershed were significantly smaller compared with all other rivers (Δ30Sisecof –0.2±0.3 ‰ and Δ74Gesecof
–0.3±1.1 ‰; Fig. 8, Table C3). Lower δ30Sidisscomposition was previously observed in Icelandic glacial rivers (e.g., Georg et al., 2007). In contrast, δ7Lidiss in glacial West Greenland rivers was
strongly fractionated, most likely during Li uptake by Fe oxides derived from pyrite oxidation (Wimpenny et al., 2010). The isotopic fractionation of Mg (Wimpenny et al., 2011) and Fe (Stevenson et al., 2017) in Greenland appears to be primarily controlled by incongruent dissolution of primary minerals rather than the precipitation of secondary phases. Similar incongruency might affect riverine Ge/Sidiss, δ30Sidiss, and δ74Gediss of the Watson River, potentially invalidating the modeling results here, given that the model assumes congruent dissolution of primary minerals. However, it is notable that using a global riverine clay dataset Bayon et al. (2018) have suggested limited δ30Si fractionation in cold and arid environments, in agreement with our results from West Greenland. Overall, it appears that glacial weathering results in distinct geochemical and isotopic signatures in streams, and further research is needed to understand the mechanisms responsible.
With the exception of Greenland, the range of empirical Δ74Gesec values determined here is
consistent with previous experimental (Pokrovsky et al., 2014) and ab initio modeling (Li & Liu, 2010) studies of Ge removal by Fe oxide phases which determined Δ74Gesec = –4.4 to – 1.7 ‰.
Additional studies are needed to determine Δ74Gesec associated with the formation of various
-3 -2 -1 0 sec 30 -6 -5 -4 -3 -2 -1 0 sec 74
a
-3 -2 -1 0 bio 30 -6 -4 -2 0 2 4 6 bio 74b
California, Mississippi Mackenzie basin Andes-Amazon Major Amazon trib. HawaiiLa Selva (Costa Rica) Greenland
Guadeloupe
KL09
Figure 8: The relationship between the Si and Ge isotope fractionation factors associated with secondary weathering (a) and biological uptake (b). Symbols are plotted as medians and error bars as 1 standard deviation of the calculated range of values. Note that for most samples, the value of Δbio could not be accurately determined (i.e. the error bars span 1 st.dev. of the whole conservative range of pre-assigned values). The notable exception was the Lower Kern (KL09) sample, where biological fractionation was modeled as a Rayleigh process in a dam reservoir with additional constraints on δ74Ge mass balance in the reservoir (Section 3.4.2).
can explain the majority of currently available riverine δ74Gediss data. In the case of Si, most
experimentally determined aluminosilicate and Fe- and Al-oxide Δ30Sisec factors fall in the -2 to
0 ‰ range (Frings et al., 2016), also in agreement with the majority of the values determined here (Fig. 8, Appendix Table C3).
3.4.3 Ge/Si-isotope fractionation model: limitations and implications
Fundamentally, river waters and sediments average processes taking place on a range of spatial and temporal scales within heterogeneous catchments. Inevitably, information is lost when large catchments are represented by a small number of samples, as was done in this study. This can hamper quantitative efforts, although in some cases, averaging by processes such as mixing of waters can be helpful in reducing complexity (see discussion above and Druhan & Maher (2017)). Currently, most of the uncertainty in these modeling results is introduced by the poor constraints on αGe/Sisec and especially αGe/Sibio values, with the calculated fsec and fbio estimates particularly
sensitive to these parameters. The range of αGe/Sibio values reported for various plants is especially wide, spanning three orders of magnitude (Derry et al., 2005; Blecker et al., 2007; Meek et al., 2016, Table C2). Surveys of representative soils and plants are therefore required to obtain better catchment-specific estimates of αGe/Sibio .
In addition, analyses of primary and secondary mineral assemblages in river sediments (along 20
with relevant thermodynamic experimental data) could help significantly improve the catchment-averaged estimates of all αsec parameters (assuming dominantly equilibrium fractionation). In the
case of dominantly kinetic fractionation, the addition of time-series data and better constraints on water transit times within a catchment (again, along with relevant kinetic experimental data) would also result in more accurate estimates of fractionation factors.
Given all of the above, the results of this modeling effort should be treated as preliminary. However, this modeling framework serves as an example of how a fully integrated multi-proxy approach can be used to move away from purely qualitative observations, opening the possibility to quantitatively deconvolve multiple isotope-fractionating biogeochemical processes. Finally, obtaining robust locally or globally relevant constraints on biological uptake, silicate weathering, and their associated isotopic fractionation on the continents would greatly benefit paleorecord-based investigations of the climate-weathering feedback.
4
Conclusions
We have analyzed the dissolved δ74Ge and Ge/Si composition of 31 rivers worldwide, including the Amazon, Changjiang, Mekong, and Mackenzie rivers. Combined with the previous dataset of Baronas et al. (2017a), the δ74Ge values range from 0.9 to 5.5 ‰ with a discharge-weighted global average at 2.6 ± 0.5 ‰. Several samples of river suspended and bedload sediments exhibit δ74Ge that is indistinguishable from silicate bedrock (0.4 - 0.8 ‰), consistent with low Ge solubility and transport predominantly in the solid phase. In contrast, we have observed fractionation in δ30Si of bedload and suspended load samples due to sorting of particle sizes during transport in a large river system draining the eastern Andes.
A simple model coupling the fractionation of Ge/Si, δ74Ge, and δ30Si has enabled us to attempt the first quantitative deconvolution of Ge and Si uptake by secondary mineral phases vs. biota (plants or freshwater diatoms). Modeling results indicate that, depending on the river, 12-54% (avg. 32%) of initially released Si is taken up biologically, whereas secondary phases remove 19-79 % (avg. 54 %), with 3-39% (avg. 13%) remaining in the dissolved phase. In contrast, most dissolved Ge is taken up by secondary phases (79-98 %). The isotopic fractionation factors associated with secondary phase uptake are estimated to range from -2.7 to -1.1 ‰ for δ30Si and -4.9 to -1.6 ‰ for δ74Ge. The biological fractionation of Ge by freshwater diatoms was calculated as –0.7 ± 0.7 ‰.
Overall, we have demonstrated how a multi-proxy approach, in this case coupling Ge/Si, δ74Ge, and δ30Si fractionation, can help put quantitative constraints on biogeochemical processes like the precipitation of secondary weathering phases and the biological uptake of solutes by living organisms.
5
Acknowledgements
Financial support was provided by US National Science Foundation (NSF) grants OCE 1061700 and OCE 1260692 to DEH. JJB was additionally supported by a CUAHSI Pathfinder graduate student fellowship, an InterRidge research fellowship, and a John Montagne Award from GSA Quaternary Geology and Geomorphology Division. The Andes-Amazon component of this work was supported by US NSF grants EAR 1455352 and EAR 1227192 to AJW. Support for OR was provided by the Institut Carnot Ifremer EDROME and LabexMer ANR-10-LABX-19-01. We thank Emmanuel Ponzevera for analytical assistance with Ge isotope measurements at Ifremer and Yi Hou for help with Si concentration analyses at USC. We are extremely grateful to the following people who helped collect the global river samples used in this study: Valier Galy, Sarah Rosengard, Paulina Piñedo-Gonzalez, Bernhard Peucker-Ehrenbrink, Mathieu Dellinger, Mia Bennett, Lincoln Pitcher, Gen Li, Shilei Li, Sophie Opfergelt, Kevin Burton, Philip Pogge von Strandmann, Rachael James, and Jane Hammond. Sample collection in Peru was accomplished with additional help from Kathryn Clark, Sarah Feakins, Emily Burt, Camilo Ponton, and a number of field assistants over the years, as well as field support from ACCA Peru, Manu Learning Centre, and Incaterra. We also thank Patrick Frings for sharing his riverine δ30Si data compilation. This manuscript was improved by the constructive comments of Philip Pogge von Strandmann and two anonymous reviewers. We thank Derek Vance for editorial handling.
References
Allard T, Menguy N, Salomon J, Calligaro T, Weber T, Calas G, Benedetti MF (2004) Revealing forms of iron in river-borne material from major tropical rivers of the Amazon Basin (Brazil).
Geochimica et Cosmochimica Acta68:3079–3094.
Baronas JJ, Hammond DE, Berelson WM, McManus J, Severmann S (2016) Germanium-silicon fractionation in a river-influenced continental margin: The Northern Gulf of Mexico. Geochimica
et Cosmochimica Acta178:124–142.
Baronas JJ, Hammond DE, McManus J, Wheat CG, Siebert C (2017a) A global Ge isotope budget.
Geochimica et Cosmochimica Acta203:265–283.
Baronas JJ, Torres MA, Clark KE, West AJ (2017b) Mixing as a driver of temporal variations in river hydrochemistry: 2. Major and trace element concentration dynamics in the Andes-Amazon transition. Water Resources Research 53.
Baronas JJ (2017) Germanium and silicon isotope geochemistry in terrestrial and marine low-temperature environments Ph.D. diss., University of Southern California.
Bayon G, Delvigne C, Ponzevera E, Borges A, Darchambeau F, De Deckker P, Lambert T, Monin L, Toucanne S, André L (2018) The silicon isotopic composition of fine-grained river sediments and its relation to climate and lithology. Geochimica et Cosmochimica Acta 229:147–161. Berner R, Lasaga A, Garrels R (1983) The carbonate-silicate geochemical cycle and its effect
on atmospheric carbon dioxide over the past 100 million years. American Journal of
Sci-ence283:641–683.
Bernstein LR, Waychunas GA (1987) Germanium crystal chemistry in hematite and goethite from the Apex Mine, Utah, and some new data on germanium in aqueous solution and in stottite.
Geochimica et Cosmochimica Acta51:623–630.
Blecker SW, King SL, Derry LA, Chadwick OA, Ippolito JA, Kelly EF (2007) The ratio of germanium to silicon in plant phytoliths: Quantification of biological discrimination under controlled experimental conditions. Biogeochemistry 86:189–199.
Bouchez J, von Blanckenburg F, Schuessler JA (2013) Modeling novel stable isotope ratios in the weathering zone. American Journal of Science 313:267–308.
Bouchez J, Gaillardet J, France-Lanord C, Maurice L, Dutra-Maia P (2011) Grain size control of river suspended sediment geochemistry: Clues from Amazon River depth profiles. Geochemistry,
Geophysics, Geosystems12:n/a–n/a.
Burton J, Culkin F, Riley J (1959) The abundances of gallium and germanium in terrestrial materials. Geochimica et Cosmochimica Acta 16:151–180.
Cornelis JT, Delvaux B, Georg RB, Lucas Y, Ranger J, Opfergelt S (2011) Tracing the origin of dissolved silicon transferred from various soil-plant systems towards rivers: a review.