Publisher’s version / Version de l'éditeur:
Physical Review A, 68, 2, p. 023406, 2003
READ THESE TERMS AND CONDITIONS CAREFULLY BEFORE USING THIS WEBSITE. https://nrc-publications.canada.ca/eng/copyright
Vous avez des questions? Nous pouvons vous aider. Pour communiquer directement avec un auteur, consultez la
première page de la revue dans laquelle son article a été publié afin de trouver ses coordonnées. Si vous n’arrivez pas à les repérer, communiquez avec nous à PublicationsArchive-ArchivesPublications@nrc-cnrc.gc.ca.
Questions? Contact the NRC Publications Archive team at
PublicationsArchive-ArchivesPublications@nrc-cnrc.gc.ca. If you wish to email the authors directly, please see the first page of the publication for their contact information.
NRC Publications Archive
Archives des publications du CNRC
This publication could be one of several versions: author’s original, accepted manuscript or the publisher’s version. / La version de cette publication peut être l’une des suivantes : la version prépublication de l’auteur, la version acceptée du manuscrit ou la version de l’éditeur.
For the publisher’s version, please access the DOI link below./ Pour consulter la version de l’éditeur, utilisez le lien DOI ci-dessous.
https://doi.org/10.1103/PhysRevA.68.023406
Access and use of this website and the material on it are subject to the Terms and Conditions set forth at
Direct imaging of rotational wave-packet dynamics of diatomic
molecules
Dooley, P.; Litvinyuk, I.; Lee, Kevin; Rayner, David; Spanner, Michael;
Villeneuve, D.; Corkum, Paul
https://publications-cnrc.canada.ca/fra/droits
L’accès à ce site Web et l’utilisation de son contenu sont assujettis aux conditions présentées dans le site LISEZ CES CONDITIONS ATTENTIVEMENT AVANT D’UTILISER CE SITE WEB.
NRC Publications Record / Notice d'Archives des publications de CNRC:
https://nrc-publications.canada.ca/eng/view/object/?id=88393726-b4c1-493c-92f9-1e29a38616a8 https://publications-cnrc.canada.ca/fra/voir/objet/?id=88393726-b4c1-493c-92f9-1e29a38616a8Direct imaging of rotational wave-packet dynamics of diatomic molecules
P. W. Dooley,1,2I. V. Litvinyuk,1Kevin F. Lee,1,2D. M. Rayner,1M. Spanner,1,3D. M. Villeneuve,1 and P. B. Corkum1,2
1Steacie Institute for Molecular Sciences, National Research Council of Canada, 100 Sussex Drive, Ottawa, Ontario, Canada K1A 0R6
2
Department of Physics & Astronomy, McMaster University, 1280 Main Street West, Hamilton, Ontario, Canada K1S 5P3 3Department of Physics, University of Waterloo, Waterloo, Ontario, Canada N2L 3G1
~Received 11 April 2003; published 25 August 2003!
We use linearly polarized 45 fs pulses to create rotational wave packets in N2and O2. We Coulomb explode
molecules with a high-intensity circularly polarized pulse and use an ion imaging detector to measure a series of two-dimensional projections of the wave packet’s angular distribution in 27 fs increments. We highlight the evolving wave packet near the first, second, sixth, and tenth full revival times and also near the one-eighth, one-quarter, one-half, and three-quarter fractional revivals.
DOI: 10.1103/PhysRevA.68.023406 PACS number~s!: 33.80.Rv, 33.80.Gj
I. INTRODUCTION
The translational and rotational behavior of gas phase molecules can be controlled using the large Stark shifts pro-duced by intense laser pulses @1#. Such pulses have been used to trap @2#, focus @3#, and spin molecules @4#. The ability of intense laser pulses to produce rotational wave packets @5– 8# that exhibit transient molecular alignment is of par-ticular interest. Aligned molecules are advantageous for ap-plications such as surface scattering research @9#, surface ca-talysis @10#, and surface processing @11#.
Strong field alignment requires an anisotropic polarizabil-ity leading to different Stark shifts along at least two molecu-lar axes. If the laser field is applied adiabatically, the mol-ecule aligns with its most polarizable axis along the laser polarization direction @5– 8#. If the pulse duration is short relative to the molecular rotational period, the molecule ex-periences an impulse toward alignment @12,13#. In that case, the resulting rotational wave packet exhibits transient ment after the pulse is over. For linear molecules, the align-ment is reproduced in a series of full revivals at intervals of one fundamental rotational period. Rotational wave packets can also be produced by rapidly truncating an adiabatic aligning pulse @14#.
Many applications benefit from molecular alignment @9–11,15,16#. The presence of a strong aligning laser field is not a perturbation, however, and can interfere with subse-quent measurements. Therefore, transient alignment has the advantage of producing field-free aligned molecules for short pulse experiments @12#.
To extract quantitative information in the molecular frame from measurements made in the laboratory frame, the com-plete angular distribution function must be known. There are two approaches to obtaining the angular distribution func-tion. ~1! The amplitude and phase of all rotational states that are thermally or nonthermally populated must be measured. This could be achieved by Fourier transforming a single time-dependent parameter characteristic of the wave packet’s dynamics and comparing the result to a numerical simulation for similar aligning pulse parameters @13#. ~2! The distribu-tion funcdistribu-tion can be measured directly at a particular time. In
this paper, we demonstrate the latter approach and illustrate the equivalence of the two methods.
In our experiments, a 45 fs linearly polarized ‘‘aligning’’ pulse creates a wave packet that exhibits macroscopic field-free molecular alignment at well-defined time delays. We observe the time evolution of the wave packet using an in-tense, circularly polarized ‘‘exploding’’ pulse. At each time delay, molecules are multiply ionized by the exploding pulse and undergo rapid dissociation ~Coulomb explosion!. The re-sultant atomic ion fragments are analyzed to yield the three-dimensional velocity of each immediately following the Coulomb explosion. For a diatomic molecule, such initial velocities are parallel to the molecular axis if the dissociation is rapid. Hence, we directly measured the distribution of mo-lecular orientations for the rotational wave packet at various points during its time evolution.
We use a circularly polarized exploding pulse and con-sider only angles within the plane of polarization. This is important because Coulomb explosion is most efficient for molecules oriented parallel to the laser polarization @17#. With circular polarization, the ionization probability depends solely upon the out-of-plane angle @18#. Since the in-plane angle is unbiased, our measured angular distributions accu-rately reflect the actual molecular ensemble.
Our work is presented as follows. Our general experimen-tal approach is described in the following section. Experi-ments conducted to characterize the Coulomb explosion of N2 and to select N31 ions originating from the N
251
→N211N31 dissociation channel are described in Sec. II. In Sec. III, revival structures of N2 rotational wave packets ~derived from the measured N31 angular distributions! are
presented, modeled, and compared with O2 revival
struc-tures. The effects of centrifugal deformation, nuclear spin, and aligning pulse intensity on the revival structures are dis-cussed. In Sec. IV, we present measured angular distributions corresponding to full and fractional rotational revivals in N2 and O2. Of particular interest is the 1/8 revival in O2 that
occurs in a featureless region of the alignment revival struc-ture. Our time-dependent angular distributions are depicted as polar representations, intensity maps, and projections onto basis states.
II. EXPERIMENTAL CONFIGURATION
The laser system consisted of a Ti:sapphire oscillator and regenerative amplifier and produced linearly polarized, 800
mJ, 800 nm wavelength pulses at a repetition rate of 500 Hz. The pulse duration after the regenerative amplifier was mea-sured to be 39 fs usingSPIDER@19# and estimated to be 45 fs
in the experimental chamber. A Mach-Zehnder interferom-eter was used to divide the laser output into aligning and exploding pulses, to introduce a relative time delay, and to recombine the two beams collinearly. A telescope was in-stalled in the aligning pulse arm of the interferometer to de-crease the beam diameter by a factor of 2. This produced an aligning focus whose minimum cross-sectional area and con-focal parameter were each four times greater than those of the exploding pulse and ensured that only those molecules upon which the aligning pulse had acted most strongly were exploded. A quarter wave plate was used to circularly polar-ize the exploding pulse. The interferometer’s beam combiner was used at near-normal incidence to preserve the polariza-tion states of the two pulses. The 10mJ aligning and 200mJ exploding pulses entered an ultrahigh-vacuum experimental chamber and were focused by an on-axis parabolic mirror ( f /2, f 550 mm) into a well-collimated beam of nitrogen molecules.
The experimental chamber consisted of three differen-tially pumped sections separated by two 1 mm diameter skimmers. Operating pressures in the source, intermediate, and explosion subchambers were 731025 mbar, 131028
mbar, and 231029 mbar, respectively. A molecular jet was
produced by expanding 33 mbar of N2 through a circular
aperture ~100mm diameter! into the source chamber. Colli-mation of the jet was achieved using the two skimmers and a piezoelectric slit mounted in the explosion chamber. Beyond the slit, the cross section of the molecular beam was rectan-gular (1.5 mm340mm). The laser propagation direction was along the thin ~40 mm! dimension of the molecular beam. Geometric constraints limited the molecular beam’s transverse translational temperature to ,0.01 K. The mea-sured longitudinal temperature was 90 K.
Since the molecular beam thickness was approximately equal to the aligning focus’ confocal parameter, target mol-ecules were confined to the high-intensity region of the aligning focal volume. The number density of the molecular beam was ;1010 molecules/cm3beyond the slit, correspond-ing to ;10 molecules within the overlap region of the align-ing laser and molecular beams. While the interaction vol-umes of the two foci were approximately equal, the confocal parameter of the exploding focus was a factor of 4 smaller than that of the aligning focus. As a result, less than one molecule per laser pulse was present in the high-intensity region of the exploding focus, i.e., the region in which the most highly charged Coulomb explosion channels were ac-tive. By selecting a high-charge Coulomb explosion channel, we probed only those molecules located at the center of the aligning focal volume.
A uniform acceleration time-of-flight mass spectrometer ~100 V/cm, 240 mm ion flight length, 70 mm internal diam-eter! was used for ion collection and analysis. The mass
spectrometer axis, molecular beam, and laser beams were mutually orthogonal. Ion impact data were recorded using a helical delay line imaging detector ~Roentdek DLD-80! @20# in conjunction with five current preamplifiers, five constant-fraction discriminators, and a multiple hit time-to-digital converter ~LeCroy TDC3377!. Using this data acquisition system, the ion arrival time and two-dimensional impact po-sition were recorded for up to 16 ions per laser pulse. The ion impact data were used to determine the initial, three-dimensional velocity vector for each Coulomb explosion fragment and hence the orientation of the exploded molecule.
III. COULOMB EXPLOSION DIAGNOSTIC EXPERIMENTS
To perform accurate imaging of rotational wave packets using our technique, an appropriate Coulomb explosion channel must be selected. Strong field ionization of N2using
our 431015W/cm2 exploding pulse produced parent ions ranging from N21 to N261. Dissociation of the parent ions
produced fragments ranging from N1to N31@Fig. 1~a!#. The
six active fragmentation channels can be identified from a correlation map analogous to that discussed by Frasinski
et al. @21# @Fig. 1~b!#. For accurate imaging, a high-charge dissociation channel must be selected to ensure that the mol-ecule dissociates before molecular reorientation can occur. This criterion ensures that the momenta of fragment ions are parallel to the molecular axis. For our exploding pulse, the two most highly charged Coulomb explosion channels were N251→N211N31and N261→N311N31@boxes 5 and 6 in
Fig. 1~b!, respectively#.
The limitations of our detection electronics also influ-enced our choice of Coulomb explosion channel. The pulse pair resolution of each of our five constant-fraction discrimi-nators is ;15 ns. As a result, certain molecular orientations are detected less efficiently for explosion channels that pro-duce identical fragments ~such as N261→N311N31). This
nonuniform detection efficiency for symmetric dissociation channels gives rise to the unshaded ‘‘dead zone’’ which runs diagonally through boxes 1, 4, and 6 in Fig. 1~b!. All mo-lecular orientations are ~in principle! equally detectable for asymmetric channels, however @as evidenced by the continu-ous dark streaks in boxes 2 and 5 in Fig. 1~b!#. Therefore, our wave-packet imaging was performed using only frag-ments originating from the asymmetric N251→N211N31
channel.
Conservation of momentum was used to select N21 and N31 fragments originating from the desired N251→N21
1N31 dissociation channel. The total N21 and N31 yields @Figs. 2~a! and 2~b!# are composed of overlapping contribu-tions from various explosion channels. To identify fragments produced via the desired channel, we rely on the fact that the vector sum of a N21 fragment’s momentum (p
21) and a
N31 fragment’s momentum (p31) is zero if they originate from the same N251 parent ion. We imposed this constraint
experimentally by summing the momenta of each possible N212N31 pair recorded for each laser pulse @Fig. 2~c!#. Only those fragment pairs that satisfied the condition p21 1p31,15 atomic units @i.e., the gray areas in Figs. 2~a! and
2~b!# were considered to have originated from the desired channel and retained. The imposition of this constraint clearly shows that the N251→N211N31channel is
charac-terized by fragment kinetic energies in the 15–25 eV range @Figs. 2~a! and 2~b!#.
IV. WAVE-PACKET REVIVAL STRUCTURES The time evolution of the wave packet produced by the aligning pulse can be written as a sum over the molecular
rotational states:
C~ t !5
(
J
aJe2i(EJ/\)tuJ,M
&
, ~1!where EJ are the energy eigenvalues, uJ,M
&
are sphericalharmonics, and M are with respect to the polarization axis of the aligning pulse. Note that the cylindrical symmetry of the optical potential prevents the coupling of different M values. For convenience, we omit the M dependence of the kets in the following discussion. For the lowest vibrational state of the molecule (v50), the rotational energies are given by
EJ'hcB0J(J11), where h is Planck’s constant, c is the
speed of light in vacuum, and B0 is the ground state rota-tional constant. For wave packets containing high-uJ
&
states, centrifugal distortion of the molecule must be taken into ac-count. In such cases, the energy eigenvalues becomeEJ5hc@B0J~ J11!1DeJ2~ J11!2#, ~2!
FIG. 1. ~a! Nitrogen fragment time-of-flight spectrum. Coulomb explosion of N2using our exploding pulse produces N1, N21, and
N31 fragments via numerous dissociation channels. Some
unex-ploded N221 is also observed. ~b! N2Coulomb explosion
correla-tion map. For each exploding pulse, the individual detector impact times of all possible nitrogen fragment pairs are plotted against each other. Each numbered box contains fragment pair data for a specific dissociation channel ~see legend!. Within each box, the dark diag-onal ~top left to bottom right! streak results from correlated frag-ment pairs, i.e., fragfrag-ments originating from the same N2molecule.
The diffuse shading within each box stems from false coincidences. The narrow unshaded region ~diagonal from bottom left to top right! arises from the 16 ns pulse pair resolution of the constant fraction discriminator used for fragment impact timing.
FIG. 2. Selection of N251→N211N31 channel. The kinetic
energy spectra for N21 and N31 fragments consist of overlapping
contributions from various Coulomb explosion channels @black re-gions in panels ~a! and ~b!, respectively#. Panel ~c! is a histogram of the three-dimensional momentum sum for all N21-N31 fragment
pairs. The desired N251→N211N31 channel was selected by
re-taining only low (,15 atomic units! total momentum pairs and exhibits a characteristic 15–25 eV fragment energy @gray regions in panels ~a! and ~b!#.
where De is the deformation constant for the nonvibrating
molecule @22#. For N2, B051.989 581 cm21 and De
55.7631026cm21@23#.
We observed the field-free evolution of the rotational wave packet created by the aligning pulse by Coulomb ex-ploding N2 at successive time delays ~27 fs increments!. The
peak intensity of the aligning pulse (1.431014W/cm2) was
chosen to achieve alignment without ionizing N2. At each
delay, 2000 N31 fragments originating from the N 251
→N211N31 dissociation channel ~i.e., those with kinetic energies in the 15–25 eV range! were collected. The three-dimensional initial velocity vector for each N31 fragment ~which was collinear with the preexplosion orientation of the parent molecule! was then calculated.
The molecular alignment axis ~i.e., the polarization axis of the linearly polarized aligning pulse! lay in the polariza-tion plane of the circularly polarized exploding pulse ~Fig. 3!. We measured the angleqbetween the alignment axis and the projection of each three-dimensional fragment velocity onto the polarization plane. Since the exploding pulse was circularly polarized, the Coulomb explosion probability was independent of the angleq. Hence, experimentalq distribu-tions are unbiased and depend solely upon the actual en-semble of molecular orientations.
Raw q distributions were normalized using a ‘‘back-ground’’qdistribution to ensure that a slightly elliptical (« 50.97) exploding pulse polarization did not bias the deter-mination of molecular orientations. The backgroundq distri-bution was obtained in a single pulse experiment by explod-ing an isotropic ensemble of molecules.
While we measure complete time-dependent q distribu-tions, it is typical ~in the revival literature! to plot the first moment of such distributions (
^
cos2q&
in our case! as a function of time. The measuredqdistributions are presented and discussed in Sec. V. In keeping with convention, we characterized the degree of alignment at eachaligning-exploding delay by calculating
^
cos2q&
for each normalizedq distribution. In our scheme,
^
cos2q&
50.5 reflects an iso-tropic distribution of molecular orientations while^
cos2q&
51 indicates complete alignment. The limiting case in which all molecules are perpendicular to the alignment axis is de-noted by
^
cos2q&
50. Note that our measured projection angle q differs from the azimuthal angle of a spherical co-ordinate systemu~for which
^
cos2u&
51/3 reflects an isotro-pic distribution!.The time evolution of the N2 alignment parameter
^
cos2q&
is depicted in Fig. 4~a!. Prior to the arrival of the aligning pulse ~i.e., t,0), the molecular ensemble is isotro-pic ~i.e.^
cos2q&
50.50). The arrival of the aligning pulse is followed by a prompt net alignment (t5T050.067 ps).Ne-glecting centrifugal distortion, eachuJ
&
state within the rota-tional wave packet accumulates phase with a different angu-lar frequency given byvJ5
1
2J~ J11!v1, ~3!
wherev154pB0c is the fundamental phase frequency, i.e.,
that of u1
&
. Thus, the constituentuJ&
states rapidly dephase with respect to each other and the initial net alignment quickly dissipates. The baseline for t.0 is higher than the isotropic value^
cos2q&
50.5, however. Known hereafter as ‘‘incoherent alignment,’’ this baseline shift is due to the first term in Eq. ~A6! and can be understood as follows. Initially ~i.e., t,0), the relative uJ&
state populations were given by a thermal Boltzmann distribution and M values were uni-formly populated for eachuJ&
state. The aligning pulse modi-fies the uJ&
state distribution by inducing various rotational excitations and deexcitations via Raman transitions. Since there exists a lower bound for Raman deexcitation ~i.e., u0&! but no such limit for excitation, the resulting wave packet exhibits net rotational excitation, i.e.,^
J&
packet.^
J&
thermal.The laser-molecule interaction does not alter the distribution of M values, however. Thus, rather than being uniformly distributed, the angular momentum vectors of each uJ
&
state in the wave packet are preferentially oriented perpendicular to the aligning pulse polarization. In terms of molecular ori-entation, this corresponds to a small but persistent net align-ment of the ensemble and an elevated experialign-mental baseline ~i.e.,^
cos2q&
.0.50) for t.0.
Since the wave packet evolves in a field-free environ-ment, the uJ
&
states eventually begin to rephase. When the accumulated phases of each uJ&
state are equal ~to within multiples of 2p!, the initial net alignment is reproduced in an event known as a full wave-packet revival. Since J(J11) is even for all J, all angular frequencies vJ are integermul-tiples of the fundamental frequency v1 @Eq. ~3!#. Therefore,
the time of the first full revival, t5T01T1, is determined by
v1according to T152p/v15(2B0c)2158.383 ps. The net
alignment associated with the first full revival (t5T01T1
58.462 ps) maximizes 8.395 ps after the initial alignment at time T0 @Fig. 4~a!#. Since the time increment in the experi-ment was 27 fs, the result is in agreeexperi-ment with expectation. FIG. 3. Definition of observation angle q. Since N251→N21
1N31 is a prompt dissociation channel, the momentum of each fragment is parallel to the molecular axis. Thus, a single fragment momentum measurement is sufficient to determine a molecule’s ori-entation. The three-dimensional momentum of each N31 fragment
was projected onto the polarization plane of the exploding pulse. The angle q between the momentum projection and the molecular alignment ~i.e., aligning pulse polarization! axis was then measured.
Significant net alignment and ‘‘antialignment’’ also occur near fractional revival times t5T01Th, where Th5hT1for
h514, 1 2,
3
4. During thehrevival, the accumulated phases of states uJ
&
anduJ12&
differ by 2ph modulo 2p. Forh512, the relative phases of alluJ&
states differ by integer multiples of p. At the half revival, the sets of even uJ&
states corre-sponding to J50,4,8, . . . and odd uJ&
states given by J 53,7,11, . . . are precisely in phase with each other. How-ever, they are p out of phase with the set consisting of J 52,6,10, . . . and J51,5,9, . . . . The net result is destructive interference along the alignment axis and a localization of the wave packet in the plane perpendicular to it. Hence, sig-nificant net antialignment is expected at the first half-revival time t5T01T1/254.259 ps. In fact, the minimum value of^
cos2q&
occurred at t54.271 ps @Fig. 4~a!#, in excellentagreement with the predicted half-revival time.
Full revivals of the wave packet occur at integer multiples of the first revival time, i.e., t5T01Tn, where Tn5nT1 for
n51,2,3, . . . . The time evolution of the N2 alignment
pa-rameter for the first, second, sixth, and tenth full wave-packet revivals (n51,2,6,10) is depicted in Figs. 5~a!–5~d!, respectively. The measured ~predicted! times of maximum net alignment for each revival were t58.462 ps ~8.450 ps!, 16.857 ps ~16.832 ps!, 50.476 ps ~50.364 ps!, and 83.990 ps ~83.895 ps!. Each full revival occurred slightly later than predicted. The time lag results from a perturbation of the angular frequenciesvJdue to centrifugal distortion that was
neglected in Eq. ~3!. Note that the time evolution of the
alignment parameter
^
cos2q&
is not identically reproduced for each revival. While the n51 data @Fig. 5~a!# exhibit in-version symmetry about t;8.4 ps, the modulation structure becomes increasingly asymmetric, i.e., ‘‘chirped,’’ for each successive revival. The observed chirp is a further conse-quence of the additional nonlinearity introduced into the vJfrequency spectrum by centrifugal distortion.
The rotational wave packet’s creation by the aligning pulse and its subsequent time evolution were numerically simulated ~see the Appendix for details!. Results for a 48.4 fs full width at half maximum sin2 pulse of peak intensity 1.731014W/cm2 are depicted in Fig. 5. An initial rotational temperature of 105 K was assumed. The model quite suc-cessfully predicts the times corresponding to maximum net alignment as well as the chirp of the revival structure. Unlike the model, the baseline of the experimental data decreases gradually toward an isotropic value of
^
cos2q&
50.5 with each successive revival. The decay is not due to molecular collisions since the mean collision time is ;0.1 s, nor is it a result of molecules entering and leaving the laser foci since molecules travel less than 0.1 mm during the measurement. The observed decay is most likely an artifact due to a slight relative shift of the exploding pulse focus with aligning-exploding delay. In such a case, the overlap between aligning and exploding foci would degrade with increasing delay and consequently the exploded molecules would exhibit decreas-ing incoherent alignment.The Fourier transform of the time-dependent alignment
FIG. 4. ~a!^cos2q&revival structure for N2. The variation of^cos2q&with aligning pulse-exploding pulse delay is depicted. Prior to
wave-packet creation (t,0), the molecular ensemble is isotropic and^cos2q&50.50. The aligning pulse creates a rotational wave packet at
t50 which exhibits maximum field-free alignment at t50.067 ps. Thereafter, an elevated baseline (^cos2q&;0.56) due to incoherent
alignment was observed. Significant net alignment and antialignment are observed during the first revival (t58.462 ps) and half revival (t54.271 ps) of the wave packet, respectively. ~b!–~d! Plots of measured ~dots! and simulated ~lines! N2q distributions. The molecular
alignment axis lies along q50° and q5180° and is therefore horizontal in each figure. The rotational wave packet exhibits significant net alignment prior to the half revival @t54.137 ps; panel ~b!# and during the first revival @panel ~d!#. Net antialignment is observed during the half revival @panel ~c!#. For clarity, the areas of the simulated plots are two-thirds those of the measured distributions.
parameter
^
cos2q&
yields information regarding the distribu-tion ofuJ&
states which comprise the rotational wave packet. The result is a spectrum of beat frequencies Dv between statesuJ&
anduJ1N&
whose magnitudes are proportional to the product of the quantum amplitudes uaJuuaJ1Nu ~see theAppendix for details!. Neglecting centrifugal distortion, the beat frequencies DvJ,J1Nare given by
DvJ,J1N5 EJ1N \ 2 EJ \ 5@2NJ1N 2 1N#v1 2 . ~4!
For a diatomic molecule, DJ50,2, and the dominant beat frequencies are
DvJ,J125~ 4J16 !
v1
2 . ~5!
The time dependence of
^
cos2q&
stems directly from theFourier sum of such frequency components. The Fourier transform of the time variation of
^
cos2q&
spanning one full period of the N2 revival structure @i.e., 0–9 ps, Fig. 4~a!# isdepicted in Fig. 6~a!. The observed beat frequencies are in accord with the predictions of Eq. ~5!. The corresponding distribution of uJ
&
states is approximately Gaussian, spansJ;4 to J;22, and has a mean value of J;13.
The nuclear spin statistics of N2are evident in the Fourier transform of its revival structure. Since 14N has nuclear spin
I51, the molecule’s total nuclear spin can take on the values T50, 1, or 2 and N2 exists in ortho (T50,2; J even! and
para (T51; J odd! forms. Since a state with total nuclear spin T has degeneracy 2T11, the expected statistical weights of ortho-N2 and para-N2 are 6 ~i.e., 115) and 3,
respectively. Hence, the relative abundance of ortho-N2
ver-sus para-N2 is 2:1. This is reflected in the ;2:1 intensity
alternation between spectral lines corresponding to J even and J odd in the Fourier transform @Fig. 6~a!#. Conversely,
16O has nuclear spin I50. Hence, O
2exists in a single form
for which only odd uJ
&
states are populated. The Fourier transform of the alignment parameter^
cos2q&
for two fullperiods of the O2revival structure is depicted in Fig. 6~b!. As
expected, only spectral lines corresponding to odduJ
&
states appear, whose positions are given by Eq. ~5!.The different nuclear spin statistics of N2and O2 are also
evident in their revival structures. At the first quarter revival ~i.e., t5T01
1
4T1), the phase difference ~modulo 2p!
be-tween states uJ
&
anduJ12&
isp/2. Near the quarter-revival time, the evenuJ&
states form a secondary wave packet while the odd uJ&
states form another. The two secondary wave packets are oppositely localized. That is, when one second-FIG. 5. Selected full revivals for N2. The measured timedepen-dence of ^cos2q&~dots! for the ~a! first, ~b! second, ~c! sixth, and
~d! tenth wave-packet revivals is depicted. Also shown are the re-sults of the numerical model ~line; see the Appendix! that success-fully predicts the times of maximum net alignment as well as the chirp that centrifugal distortion introduces in the revival structure.
FIG. 6. Fourier transforms of ~a! N2 and ~b! O2revival
struc-tures. Each spectrum represents the decomposition of a molecular revival structure into beat frequencies between constituent uJ& states. In both cases, the observed beat frequencies are in accord with the prediction DvJ,J125(4J16)(v1/2). For O2, only odd
uJ&states are populated. N2, however, exists in both ortho (J even!
and para (J odd! forms. The ;2:1 intensity alternation in ~a! arises from the 2:1 relative abundance of ortho-N2versus para-N2.
ary packet is principally distributed along the alignment axis, the other is localized primarily in the perpendicular plane. For a wave packet in which even and odd uJ
&
states are equally populated, the opposite localizations would cancel at the time of the quarter revival and no net alignment ~or an-tialignment! would be observed. In the case of N2, both evenand odd uJ
&
states are populated but twice as much popula-tion exists in even states than in odd states. As a result, the temporary localization of the even secondary wave packet is only partially canceled by its odd counterpart. Thus, some net N2 alignment and antialignment is observed near t5T0114T152.163 ps @Fig. 4~a!#. In the case of O2, however, odd
uJ
&
states alone are populated. Since only a single localized wave packet exists at the time of a quarter revival, strong net alignment and antialignment is observed in the vicinity of the 2.25 and 2.75 revivals (t526.293 ps and t532.059 ps, re-spectively! for O2 ~Fig. 7!.We investigated the dependence of the N2 revival struc-ture on aligning pulse intensity in the vicinity of the first half revival ~Fig. 8!. The baseline value of
^
cos2q&
increases monotonically as the aligning pulse intensity is increased from 0.431014W/cm2to 3.431014W/cm2, reflecting an in-creased degree of incoherent alignment. The revival structure amplitude increases up to an intensity of 2.031014W/cm2.This behavior is as expected since the aligning pulse inten-sity reflects the depth of the associated optical potential well. The higher the aligning intensity, the deeper the potential well, and the larger the range of trapped uJ
&
states. As ob-served, the maximum degree of alignment increases with the number of rotational states present in the superposition. At aligning intensities greater than 2.031014 W/cm2,signifi-cant ionization of the N2 molecules occurs and consequently
the revival structure amplitude decreases.
As the aligning pulse intensity is increased, the alignment parameter
^
cos2q&
also varies more rapidly with time ~Fig. 8!. To better illustrate this effect, a single-cycle sinusoid wasfitted to each revival structure shown in Fig. 8. The oscilla-tion frequencyvosccorresponding to each sinusoid increases
monotonically over the intensity range for which little N2 ionization occurs, i.e., 0.431014 W/cm2 to 2.031014W/cm2 ~Fig. 9!. This trend can be understood in terms of the central uJ
&
state of the rotational wave packet. According to Eq. ~A6!, the revival structure’s dominant oscillation frequencyvosc corresponds to the beat frequency DvJ8,J812 between FIG. 7. ^cos2q&revival structure of O2. The time variation of
^cos2q&is depicted, spanning the second and third full revivals as
well as the 2.25, 2.5, and 2.75 fractional revivals. Since only odd uJ& states are populated in O2, the 2.25 and 2.75 revivals are not
suppressed ~as is the case in N2; Fig. 4!.
FIG. 8. Intensity variation of half revival for N2. The time
variation of ^cos2q&in the vicinity of the first half revival is de-picted for several aligning pulse intensities. The baseline increases with aligning intensity. The amplitude of the revival structure in-creases for intensities up to 2.031014W/cm2. The transition from
peak net alignment to maximum net antialignment becomes more rapid as the aligning intensity is increased.
FIG. 9. Intensity variation of instantaneous frequency for N2.
The dominant oscillation frequencies vosc, of the measured N2
re-vival structures ~Fig. 8! as a function of aligning pulse intensity are shown ~black circles!. The central rotational states uJ11& of the corresponding wave packets are shown on the right axis. The in-crease in the central rotational state corresponds to a deepening of the optical potential well with aligning intensity. For comparison, the most populated rotational state of the 105 K molecular beam is plotted at zero intensity ~gray circle!.
the wave packet’s two most highly populated uJ
&
states J8
and J8
12. Hence, the central rotational state of the wave packet ~i.e., J8
11) can be determined from the measured value of voscusing Eq. ~5!. As shown in Fig. 9, the centralrotational state is also observed to increase with aligning intensity. This is as expected since increasing the aligning intensity produces a deeper optical potential well and an in-creased value of J
8
11.V. TIME-DEPENDENT ANGULAR DISTRIBUTIONS We observe a molecule’s rotational dynamics by directly imaging molecular qdistributions at various moments dur-ing the time evolution of its rotational wave packet. While conventional revival structures ~i.e., plots of
^
cos2q&
vs time! such as Fig. 4~a! reflect net wave packet behavior, our time-dependent q distributions yield considerably more in-sight regarding the actual distributions of molecular orienta-tions.To illustrate the utility of our imaging technique,
mea-sured q distributions corresponding to significant points in the revival structure of N2 @Fig. 4~a!# are presented. The
molecular alignment axis lies alongq50° andq5180° and is therefore horizontal in ourq-distribution plots @Figs. 4~b!– 4~d!#. During the first full wave packet revival (t 58.462 ps), the wave packet exhibits significant net align-ment. This is reflected by measured ~dots! and simulated ~line! angular distributions @Fig. 4~d!# that are strongly peaked about the alignment axis and a corresponding peak value of
^
cos2q&
in the revival structure @Fig. 4~a!#. The simulated angular distribution was obtained using the ap-proach described in the Appendix followed by a projection of the entire wave packet onto the plane of polarization of the exploding pulse. At the half-revival time (t54.271 ps), mol-ecules lie predominantly in the plane perpendicular to the alignment axis. As a result, the correspondingqdistributions @Fig. 4~c!# are concentrated primarily along q590° and q5270° and
^
cos2q&
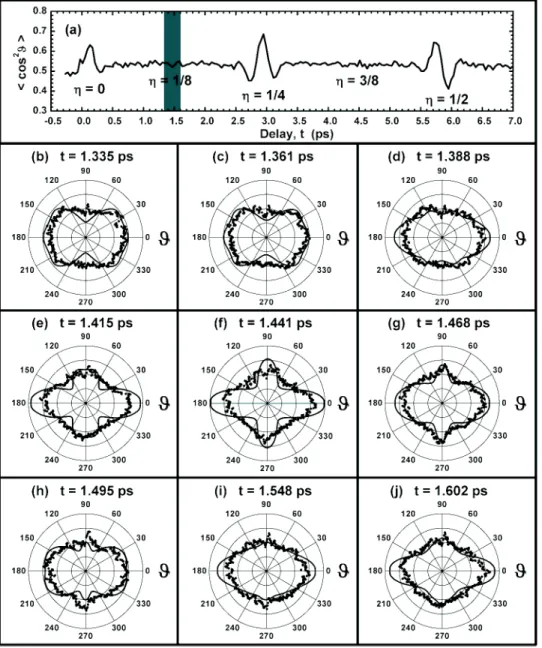
attains its minimum value. At t 54.137 ps, the wave packet exhibits significant net align-ment @Fig. 4~b!# just prior to the first half revival which givesFIG. 10. ~a! Revival structure of O2. Locations of thehth
reviv-als are shown. The 1/8 revival oc-curs in the shaded region. ~b!–~j! Plots of O2 q distributions near
the 1/8 revival. The measured dis-tributions ~dots! follow the evolu-tion of the model results ~lines!. Each measured distribution con-tains the results of 25 000 determi-nations of molecular orientation.
rise to a peak value of
^
cos2q&
.Since they reflect net wave packet behavior,
^
cos2q&
re-vival structures @such as Figs. 4~a!, 5, and 7# are useful for identifying times that correspond to significant net alignment or antialignment. Instances of net behavior are rare during the evolution of a rotational wave packet, however. Hence,
^
cos2q&
revival structures consist of a relatively flat baseline punctuated by regions of peaks and troughs. While such baselines indicate a wave packet’s degree of time-independent incoherent alignment, they provide no insight regarding molecular angular distributions at such times. Al-though minimal net alignment is observed in such baselineregions, the corresponding angular distributions can differ considerably. For instance, q distributions for the isotropic case @analogous to a circle ~s! in Figs. 4~b!– 4~d!#, a plus (1), a cross (3), and an asterisk (*) would each yield a net alignment parameter of
^
cos2q&
50.5. To distinguish such qualitatively different distributions, an angle-resolved imag-ing technique is required.Since we measure a molecular angular distribution at each time delay, we can follow a wave packet’s evolution even during periods of minimal net alignment. As an illustration, we present the results of imaging performed in the vicinity of the 1/8 revival in O2 (t;1.4 ps). The 1/8 revival occurs in the baseline region of the
^
cos2q&
revival structure of O2@Fig. 10~a!#. Figures 10~b!–10~j! depict both measured ~dots! and simulated ~lines!qdistributions in the vicinity of the 1/8 revival. The value of
^
cos2q&
is approximately equal for each distribution and the time increment for most of those shown is just 27 fs. Nevertheless, we can qualitatively re-solve such structures as a bowtie @Fig. 10~c!#, a plus @Fig. 10~f!#, and a butterfly @Fig. 10~h!#.Our time-dependent angular distributions can be com-pactly represented using the scheme of Fig. 11. Intensity maps for the measured @Fig. 11~a!# and simulated @Fig. 11~b!# angular distributions in the vicinity of the 1/8 revival of O2 are depicted. White, gray, and black represent regions
of high, intermediate, and low probability density, respec-tively. Although the 27 fs temporal resolution introduces a noticeable graininess, the measured intensity map captures FIG. 11. Intensity maps of ~a! measured and ~b! simulated O2q
distributions near the 1/8 revival. The q distribution ~in degrees! at each time delay is plotted and labeled by shades of gray. Low prob-ability density is represented by black, high density by white. Al-though grainy ~due to the 27 fs experimental time increment!, the measured intensity map captures the essence of the molecular dy-namics.
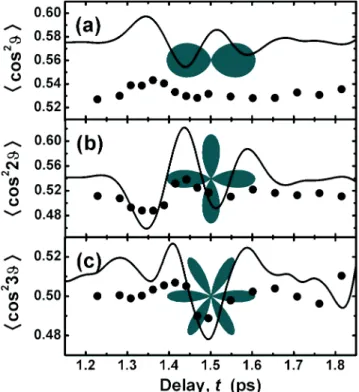
FIG. 12. Projections of O2 q distributions onto angular basis
states. Time-dependent projections of the measured ~dots! and simulated ~line! q distributions onto the ~a! cos2q, ~b! cos22q, and
~c! cos23q basis states are depicted in the vicinity of the 1/8 revival
of O2. Polar representations of the basis states are superimposed in
gray.
the essential features of the molecular dynamics. Incoherent alignment is manifested by light streaks along the alignment axis ~i.e.,q50°, 180°, and 360°). Dark regions centered at
q590° and q5270° reflect the appearance of the bowtie distribution @Fig. 10~c!# at t51.361 ps. The plus distribution @Fig. 10~f!# appears at t51.441 ps as four bright centers ~at
q50°, 90°, 180°, 270°, and 360°) with two intervening diamond-shaped dark regions. A lower contrast replica of the plus distribution occurs at t51.602 ps @Fig. 10~j!#. As a re-sult, the corresponding centers and diamonds are less distinct in the intensity maps.
We can also represent our measured q distributions
S(q,t) by projecting them onto an angular basis set of our choosing. For example, we can expand the angular data in terms of squared cosines, i.e., S(q,t)5(n50` cn(t)cos2(nq).
Note that the n51 term of this expansion corresponds to the
^
cos2q&
revival structure used throughout this work to char-acterize the degree of wave-packet alignment along the aligning pulse polarization @e.g., Fig. 10~a!#. Since we mea-sure S(q,t), however, we can also compute higher-order^
cos2(nq)&
revival structures corresponding to other terms of the expansion. To illustrate this, projections of the measured ~dots! and simulated ~lines! O2 angular distributions in thevicinity of the 1/8 revival onto the n51,2,3 states of the cos2(nq) basis are shown in Fig. 12.
Of practical interest is our ability to efficiently search for an arbitrary target angular distribution F(q) using our technique, even during data acquisition. This can be achieved in the laboratory by monitoring the generalized revival structure
G~ t !5
E
S~q,t !F~q!dq
E
S~q,t !dqE
F~q!dq. ~6!
Peaks in G(t) denote times at which the measured angular distribution best corresponds to the target distribution, just as peaks in a
^
cos2q&
revival structure indicate times of maxi-mum net molecular alignment.VI. CONCLUSIONS AND PERSPECTIVES
Using molecular Coulomb explosion as a probe, we di-rectly image rotational wave packets and obtain
^
cos2q&
re-vival structures for N2 and O2 with up to 27 fs timeresolu-tion. We have presented angular distributions corresponding to net field-free molecular alignment of N2 during a full ro-tational wave-packet revival as well as net antialignment dur-ing a half revival. Further, we have presented a series of angular distributions that reflect the rich dynamical behavior near the eighth-revival in O2 for which no significant align-ment occurs.
The ability to produce field-free ensembles of aligned molecules has enabled us to measure the directional depen-dence of the multiphoton ionization rate of N2 @15#. In the future, the ability to minimize orientational averaging should simplify experiments involving ultrafast electron diffraction
@24#, electron self-diffraction @16#, and photoelectron angular distributions @25#.
To perform rotational imaging, we measured the three-dimensional velocity vector of a single ion fragment per mol-ecule. However, we can also measure and correlate the three-dimensional velocities of multiple ion fragments. Technically, this permits optically triggered Coulomb explo-sion imaging @26# of the internal dynamics of small and in-termediate polyatomic molecules.
APPENDIX: CALCULATION OF WAVE-PACKET DYNAMICS
The calculation of the aligning pulse-molecule interaction and the resulting field-free rotational revivals was performed as follows. The aligning pulse interacts with the molecular wave function through the nonresonant ac Stark shift @5#
iC~u,t !5@BJ22U~ t !cos2~u!#C~u,t !, ~A1! where u is the angle between the laser polarization and the molecular axis, J is the angular momentum operator, B is the rotational constant of the molecule in question, and
U~ t !51
4~ai2a'!E
2~ t !. ~A2!
Here ai and a' are the polarizability components parallel
and perpendicular to the molecular axis and E(t) is the elec-tric field strength. The pulse shapes considered have the form
E2~ t !5E 0 2 sin2
S
pt 2tonD
, ~A3!where E0is the electric field amplitude andtongives the time
for the pulse to rise from zero to peak amplitude ~and is also the full width at half maximum of the pulse!. The evolution of the wave function over the duration of the aligning pulse was calculated numerically using a Crank-Nicholson scheme @27# inuJ,M
&
space.With the rotational superposition at the end of the pulse written as
C05
(
J aJuJ,M
&
, ~A4!
the field-free evolution of the wave packet becomes
C~ t !5
(
J
aJe2i ~ EJ/\ ! tuJ,M
&
, ~A5!where EJ5B0J(J11)2De@J(J11)#2. Note that
cylindri-cal symmetry of the potential well prevents the coupling of different M values. The time-dependent measure of align-ment is given by
^
cos2u&
5
^
C~ t !ucos2uuC~t!&
5
(
J uaJu 2C J,J, M1uaJuuaJ12u 3cos~ DvJ,J12t1wJ,J12!CJ,J12,M, ~A6! whereCJ,J, M5
^
J, Mucos2uuJ,M&
,CJ,J12,M5
^
J, Mucos2uuJ12,M&
, ~A7!DvJ,J125
EJ12
\ 2
EJ
\ ,
and wJ,J12 denotes the relative phase between the states
uJ,M
&
anduJ12,M&
at the start of the field-free evolution. The alignment signal was further averaged over an initial distribution of angular states at a given temperature T.Centrifugal distortion was included by writing the BJ2 operator as B0J(J11)2De@J(J11)#2 inuJ,M
&
space @22#with B051.989 581 cm21 and De55.7631026cm21 for
N2 and B051.4297 cm21 and De54.83931026 cm21 for
O2 @23#. Further corrections to the kinetic energy arising
from vibrational excitation can be neglected since fewer than one in 105 N2 or O2 molecules are vibrationally excited at
temperatures below 300 K @22#.
The initial rotational temperature T, the electric field am-plitude E0, and the duration of the pulsetonwere varied until
the calculated revival structure best matched the measured revivals. The comparison was done using the Fourier trans-form of the alignment signal @Eq. ~A1!# which readily yields the distribution of populateduJ,M
&
states through the ampli-tude termsuaJuuaJ12u labeled by the corresponding beatfre-quencies DvJ,J12'B0(4J16). The best agreement resulted
for an initial rotational temperature of T5105 K and align-ing pulse parameters of ton548.4 fs and E0251.731014
W/cm2.
The calculation captures many features of the revival structure well. The times of maximum net alignment as well as the chirp of the revival structure are well reproduced. The calculated and experimental magnitudes of the baseline and the signal oscillations differ, however. Some ~if not all! of this discrepancy is due to aperture effects of the exploding pulse that have not been fully incorporated into the model calculation.
@1# P.B. Corkum, Ch. Ellert, M. Mehendale, P. Dietrich, S. Hankin, S. Aseyev, D. Rayner, and D. Villeneuve, Faraday Discuss. 113, 47 ~1999!.
@2# T. Takekoshi, B.M. Patterson, and R.J. Knize, Phys. Rev. Lett. 81, 5105 ~1998!.
@3# H. Stapelfeldt, Hirofumi Sakai, E. Constant, and P.B. Corkum, Phys. Rev. Lett. 79, 2787 ~1997!.
@4# J. Karczmarek, J. Wright, P. Corkum, and M. Ivanov, Phys. Rev. Lett. 82, 3420 ~1999!; D.M. Villeneuve, S.A. Aseyev, P. Dietrich, M. Spanner, M.Yu. Ivanov, and P.B. Corkum, ibid. 85, 542 ~2000!; M. Spanner and M.Yu. Ivanov, J. Chem. Phys. 114, 3456 ~2001!; M. Spanner, K.M. Davitt, and M.Yu. Ivanov,
ibid. 115, 8403 ~2001!.
@5# B. Friedrich and D. Herschbach, Phys. Rev. Lett. 74, 4623 ~1995!.
@6# T. Seideman, J. Chem. Phys. 103, 7887 ~1995!.
@7# W. Kim and P.M. Felker, J. Chem. Phys. 104, 1147 ~1996!. @8# H. Sakai, C.P. Safvan, J.J. Larsen, K.M. Hilligsøe, K. Hald,
and H. Stapelfeldt, J. Chem. Phys. 110, 10 235 ~1999!; J.J. Larsen, H. Sakai, C.P. Safvan, I. Wendt-Larsen, and H. Stapelfeldt, ibid. 111, 7774 ~1999!; J.J. Larsen, K. Hald, N. Bjerre, H. Stapelfeldt, and T. Seideman, Phys. Rev. Lett. 85, 2470 ~2000!.
@9# B. Friedrich, D.P. Pullman, and D.R. Herschbach, J. Phys. Chem. 95, 8118 ~1991!.
@10# V.A. Cho and R.B. Berstein, J. Phys. Chem. 95, 8129 ~1991!. @11# T. Seideman, Phys. Rev. A 56, R17 ~1997!.
@12# J. Ortigoso, M. Rodrı´guez, M. Gupta, and B. Friedrich, J. Chem. Phys. 110, 3870 ~1999!; T. Seideman, Phys. Rev. Lett. 83, 4971 ~1999!.
@13# F. Rosca-Pruna and M.J.J. Vrakking, Phys. Rev. Lett. 87, 153902 ~2001!; F. Rosca-Pruna and M.J.J. Vrakking, J. Chem.
Phys. 116, 6567 ~2002!; 116, 6579 ~2002!.
@14# V. Kalosha, M. Spanner, J. Herrmann, and M.Yu. Ivanov, Phys. Rev. Lett. 88, 103901 ~2002!; D.M. Villeneuve, S.A. Aseyev, A. Avery, and P.B. Corkum, Appl. Phys. B: Lasers Opt. 74, S157 ~2002!; J. Underwood, M. Spanner, M.Yu. Ivanov, J. Mottershead, B.J. Sussman, and A. Stolow, Phys. Rev. Lett. 90, 223001 ~2003!.
@15# I.V. Litvinyuk, K.F. Lee, P.W. Dooley, D.M. Rayner, D.M. Vil-leneuve, and P.B. Corkum, Phys. Rev. Lett. 90, 233003 ~2003!. @16# H. Niikura, F. Le´gare´, R. Hasbani, A.D. Bandrauk, M.Yu. Ivanov, D.M. Villeneuve, and P.B. Corkum, Nature ~London! 417, 917 ~2002!.
@17# L.J. Frasinski, K. Codling, P. Hatherly, J. Barr, I.N. Ross, and W.T. Toner, Phys. Rev. Lett. 58, 2424 ~1987!; T. Zuo, S. Chelkowski, and A.D. Bandrauk, Phys. Rev. A 48, 3837 ~1993!; T. Seideman, M.Yu. Ivanov, and P.B. Corkum, Phys. Rev. Lett. 75, 2819 ~1995!; E. Constant, H. Stapelfeldt, and P.B. Corkum, ibid. 76, 4140 ~1996!.
@18# Ch. Ellert and P.B. Corkum, Phys. Rev. A 59, R3170 ~1999!. @19# C. Iaconis and I.A. Walmsley, Opt. Lett. 23, 792 ~1998!. @20# S.E. Sobottka and M.B. Williams, IEEE Trans. Nucl. Sci. 35,
348 ~1988!; O. Jagutzki, V. Mergel, K. Ullmann-Pfleger, L. Spielberger, U. Meyer, R. Do¨rner, and H. Schmidt-Bo¨cking, Proc. SPIE 3438, 322 ~1998!.
@21# L.J. Frasinski, K. Codling, and P.A. Hatherly, Science 246, 1029 ~1989!.
@22# G. Herzberg, Molecular Spectra and Molecular Structure:
Vol-ume I—Spectra Of Diatomic Molecules, 2nd ed. ~Krieger, Malabar, FL, 1989!.
@23# K.P. Huber and G. Herzberg ~data prepared by J.W. Gallagher and R.D. Johnson III!, in ‘‘NIST Chemistry WebBook,’’ NIST Standard Reference Database Number 69, edited by P.J.
strom and W.G. Mallard, National Institute of Standards and Technology, Gaithersburg, MD, 2001 ~http:// webbook.nist.gov!.
@24# J.C. Williamson, J. Cao, H. Ihee, H. Frey, and A.H. Zewail, Nature ~London! 386, 159 ~1997!.
@25# O. Geßner, Y. Hikosaka, B. Zimmerman, A. Hempelmann, R.R. Lucchese, J.H.D. Eland, P.-M. Guyon, and U. Becker,
Phys. Rev. Lett. 88, 193002 ~2002!.
@26# Z. Vager, R. Naaman, and E.P. Kanter, Science 244, 426 ~1989!; P.W. Dooley, V.R. Bhardwaj, and P.B. Corkum, in
Pro-ceedings of the International Conference on Lasers ’99 ~STS Press, McLean, VA, 2000!, p. 8.
@27# W.H. Press et al., Numerical Recipes, 2nd ed. ~Cambridge University Press, Cambridge, England, 1992!.