UNIVERSITÉ DE MONTRÉAL
THREE-DIMENSIONAL DECOMPOSITION OF GROUND-REACTION FORCES UNDER BOTH FEET DURING GAIT USING PARAMETRIC CURVE MODELING
BAHARE SAMADI
INSTITUT DE GÉNIE BIOMÉDICAL ÉCOLE POLYTECHNIQUE DE MONTRÉAL
MÉMOIRE PRÉSENTÉ EN VUE DE L’OBTENTION DU DIPLÔME DE MAÎTRISE ÈS SCIENCES APPLIQUÉES
(GÉNIE BIOMÉDICAL) AOÛT 2016
UNIVERSITÉ DE MONTRÉAL
ÉCOLE POLYTECHNIQUE DE MONTRÉAL
Ce mémoire intitulé:
THREE-DIMENSIONAL DECOMPOSITION OF GROUND-REACTION FORCES UNDER BOTH FEET DURING GAIT USING PARAMETRIC CURVE MODELING
présenté par: SAMADI Bahare
en vue de l’obtention du diplôme de : Maîtrise ès sciences appliquées a été dûment accepté par le jury d’examen constitué de :
M. BALAZINSKI Marek, Docteur ès sciences, président
M. RAISON Maxime, Doctorat, membre et directeur de recherche M. ACHICHE Sofiane, Ph. D., membre et codirecteur de recherche M. BALLAZ Laurent, Ph. D., membre et codirecteur de recherche Mme PÉRIÉ-CURNIER Delphine, Doctorat, membre
DEDICATION
“Don't ever give up. Don't ever give in. Don't ever stop trying. Don't ever sell out. And if you find yourself succumbing to one of the above for a brief moment, pick yourself up, brush yourself off, whisper a prayer, and start where you left off. But never, ever, ever give up.” Richelle E. Goodrich
ACKNOWLEDGEMENTS
This thesis would not have been possible without the help of many people, so I would like to thank: My supervisors Professor Maxime Raison and Professor Sofiane Achiche, who mentored me during my Master’s education. I sincerely appreciate the chance of working alongside not only genuine scientists but also amazing human beings. Their support, patience, indulgence, guidance and encouragement, made my studies intriguing, fun and fruitful. I would also like to appreciate Professor Laurent Ballaz, my research co-director for his precious guidance.
I am also grateful to Fondation Universitaire Pierre Arbour, for their offered financial support during my Master’s.
I would like to show my gratitude to the volunteer participants to gait analysis evaluation as part of my research project for their time and patient. I would like to thank Hamzeh Alizadeh, who advised me to pursue my studies in biomechanics field, Audrey Parent who was always available for consultation and Qin Fang Chua for her invaluable assistance.
A great thank to the researchers, students and trainees of the Marie Enfant Rehabilitation Center and Laboratory of Professor Achiche for making both friendly and rewarding this research experience. I would also to thank my friends for their support, friendship and help: Nolwenn, Yasaman, Aurélie, Parya, Atta, Afarin, AmirMasoud, Farhad, Shahin, Farshad, Forough, Katayoon and Majid. And my family, especially my parents, who guide me in the right direction all through my life, my brother Payman for his unconditional love and inspiration.
RÉSUMÉ
Introduction: La mesure tridimensionnelle des forces de réaction au sol (FRS-3D) est un
élément important de l'analyse de la démarche. En effet, lors de l'évaluation fonctionnelle des patients en réadaptation, cette mesure permet de calculer les centres de pression, les paramètres spatio-temporels ainsi que les couples articulaires. Pour obtenir les FRS-3D sur plusieurs cycles de marche, l’utilisation de longues plateformes est nécessaire. Cependant, les systèmes de mesure de ce type posent un problème puisqu'ils fournissent uniquement une résultante des FRS-3D pour les deux pieds combinés. En plus, aucune méthode n'a précédemment été validée sur un nombre raisonnablement élevé de participants.
Objectif: Cette étude vise à développer une méthode automatisée en utilisant des courbes
paramétriques en forme de « S » pour augmenter la précision de la décomposition des FRS-3D pendant les phases de double-appui, aux profils gauche et droit et ceci, le long des axes tridimensionnels X, Y et Z.
Méthodes: Trente adultes en bonne santé, âgés en moyenne de 24.8 ans (écart-type (ÉT) : 3.1
ans), dont 17 hommes, et ayant en moyenne un poids de 70.6 kg (ÉT : 11.4), ont marché naturellement, à pieds-nus, sur un plancher équipé de plateformes de force séparées. La méthode de modélisation de la décomposition de forces a été appliquée aux FRS-3D en considérant différentes fonctions paramétriques telles qu'une fonction polynomiale du 3ième ordre, une sinusoïde et des sinusoïdes sigmoïdes. Pour valider cette méthode, les valeurs de FRS-3D décomposées ont été comparées à celles des FRS-3D enregistrées par plateformes de forces indépendantes et ceci pour chacun des sujets de l'étude. Une erreur globale est calculée en comparant la norme des valeurs de FRS-3D décomposées à celle de FRS-3D enregistrées par les
plateformes de forces indépendantes. Notons que la norme globale des FRS-3D est calculée par la moyenne quadratique des valeurs de FRS-3D le long de chaque axe.
Résultats: Pour les 30 sujets à l'étude, la plus faible erreur moyenne relative entre les FRS-3D
globales calculées et celles enregistrées par plateformes de forces indépendantes étaient de 2.9% (ÉT :1.6%) en appliquant la fonction sinusoïde pour la force verticale (V), de 6.6% (ÉT :4.4%) en employant la fonction sinusoïde sigmoïde pour la force antéro-postérieure (AP) et de 9.5% (ÉT :3.6%) en décomposant par la fonction sinusoïde sigmoïde la force médio-latérale (ML), générant une erreur globale calculée de 3.2% (ÉT : 1.9%) sur les FRS-3D.
Discussion: Cette étude a proposé une méthode automatisée pour la décomposition des FRS-3D
lors de la marche, qui utilise des paramètres cinétiques, et qui a été validée sur 30 sujets. Cette méthode peut être mise en œuvre pour obtenir la FRS-3D en temps réel (0.4, 0.8, 0.9 microsecondes pour V, AP, ML respectivement pendant la phase de double-appui) sur plusieurs cycles de marche sur les grandes plateformes. Cette méthode pourrait être étendue à l'analyse de divers mouvements comme la course, la danse, la marche avec un support ainsi que pour les études de réhabilitation.
ABSTRACT
Introduction: Three-dimensional ground reaction forces (3D-GRF) measurement is an important
aspect of gait analysis to compute centers of pressure, spatial-temporal parameters and joint torques for functional evaluation in rehabilitation. To obtain these 3D-GRF on several gait cycles, a long measurement platform is required. However, the difficulty of such measurement systems arise from the fact that the unique force platform provides the resultant of GRF for the two feet combined. Therefore, one needs to decompose the 3D-GRF into components under each foot. Indeed, both feet are placed on the same force platform, which solely provides the global resultant of left and right foot together. Furthermore, no method has been previously validated on reasonable number of participants.
Objective: This study aims to develop an automatic method using s-type parametric curve
modeling to increase the accuracy of decomposition of 3D-GRF during double stance into left and right profiles and along X, Y and Z axes.
Methods: Thirty healthy adults (age: 24.8 (Standard Deviation (SD): 3.1) years, 17 males,
weight: 70.6 (SD: 11.4) kg) walked naturally barefoot on a floor equipped with separate force platforms. The decomposition modeling method was applied to global 3D-GRF using different parametric curve functions as in 3rd order polynomial, sine and sine-sigmoid functions. To validate this method, the decomposed 3D-GRF was compared to the 3D-GRF independently recorded for each subject. A global error is calculated based on global GRF, which is the comparison between the decomposed global 3D-GRF and recorded global 3D-GRF. The global 3D-GRF is obtained by computing the square root of the sum of the second exponential of GRF along each axis.
Results: For the 30 subjects, the relative average errors between the decomposed GRF by best
function and the 3D-GRF independently recorded by force platforms were equal to 2.9% (SD: 1.6%) decomposed by sine function for the vertical forces, 6.6% (SD: 4.4%) decomposed by sigmoid function for the antero-posterior forces and 9.5% (SD: 3.6%) decomposed by sine-sigmoid function and for the Medio-lateral forces, providing a global error on global forces of 3.2% (SD: 1.9%) on the 3D-GRF.
Discussion: This study proposed an automatic method for 3D-GRF decomposition during gait
analysis using kinetics parameters and was tested on 30 subjects. The method can be implemented to obtain the 3D-GRF in real-time (0.4, 0.8, 0.9 microseconds for V, AP, ML respectively during one double stance phase) for several gait cycles on long platforms and could be extended to various movement analyses such as running, dancing, walking with a support and for rehabilitation studies.
TABLE OF CONTENTS
DEDICATION ... III
ACKNOWLEDGEMENTS ... IV
RÉSUMÉ ... V
TABLE OF CONTENTS ... IX
LIST OF TABLES ... XII
LIST OF FIGURES ... XIII
LIST OF SYMBOLS AND ABBREVIATIONS ... XV
CHAPTER 1 INTRODUCTION ... 1
CHAPTER 2 LITERATURE REVIEW ... 4
2.1 Studies on determination of gait events ... 4
2.2 Studies on GRF decomposition ... 4
2.3 Problem ... 9
2.4 Summary of the problem ... 12
CHAPTER 3 RATIONALE OF THE PROJECT ... 13
3.1 General objective ... 13
3.2 Specific objective ... 13
3.3 Hypothesis ... 13
3.4 Research questions ... 13
CHAPTER 4 ARTICLE 1: “DECOMPOSITION OF THREE-DIMENSIONAL GROUND-REACTION FORCES UNDER BOTH FEET DURING GAIT USING PARAMETRIC CURVE MODELING” ... 14
4.1 Presentation of the article ... 14
4.3 Introduction ... 18
4.4 Methods ... 20
4.4.1 Participants ... 20
4.4.2 Set-up and procedure for data collection ... 20
4.4.3 Computed parameters and GRF decomposition ... 20
4.5 GRF error analysis ... 29 4.6 Results ... 30 4.7 Discussion ... 35 4.8 Conclusion ... 36 CHAPTER 5 METHODS ... 42 5.1 Experiments ... 42 5.1.1 Participants ... 42 5.1.2 Equipment set-up ... 42
5.1.3 Procedure of data collection ... 44
5.1.4 Computed parameters and GRF decomposition procedure ... 44
CHAPTER 6 RESULTS ... 46
6.1 Observation on GRF during double stance phase ... 46
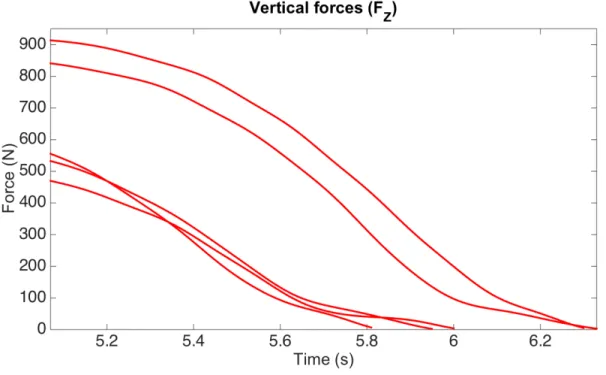
6.1.1 Observation on vertical (Fz) forces ... 46
6.1.2 Observation on antero-posterior (Fy) forces ... 46
6.1.3 Observations on Medio-lateral (Fx) forces ... 47
6.2 Observation on the results ... 48
6.2.1 The mean relative error using s-type curve fitting model and spline cubic interpolation ... 48
6.2.2 Duration of 3D-GRF decomposition ... 49
CHAPTER 7 GENERAL DISCUSSION ... 51
7.1 Discussion on procedures and methods to compute the parameters of the functions .... 51
7.2 The limits of the proposed method ... 52
CHAPTER 8 CONCLUSION AND RECOMMENDATIONS ... 54
BIBLIOGRAPHY ... 56
LIST OF TABLES
Table 4.1: Statistical results of the 30 participants. ... 34
Table 4.2: Comparison of the number of subjects fitted with each method. ... 35
Table 6.1: Comparison of mean relative error using parametric curve fitting model and spline interpolation model to decompose 3D-GRF ... 49
Table 6.2: Duration of 3D-GRF decomposition procedure using different models ... 49
LIST OF FIGURES
Figure 1.1: Gait cycle phases [10] ... 2
Figure 2.1: Temporal summation of left and right GRF profiles for successive steps [8]. ... 5
Figure 2.2: Time evolution of the vertical components of the GRFs approximated by splines (solid line) and the corresponding measured GRFs (dotted line); the total measured vertical GRFs are also presented in dotted lines during the double stances [7] ... 6
Figure 2.3: Predicted GRF from the artificial neural network method (mean (thick line) ± 1 SD (thin lines), described as the mean of 10 folds) vs. measured GRF (mean ± 1 SD (shaded area)) in the double support phase [23] ... 7
Figure 2.4: Illustration of total GRF (black line), real GRF (large gray line), GRF from our method (black dashed line) and GRF from Ren’s method (black pointed line) for the foot leaving the ground [24]. ... 8
Figure 2.5: Right (dashed), left (dot-dashed) GRF and the sum during double stance phase (line). TC, TM and TO (Instants TC, TM and TO correspond to the detected FC (foot contact), maxima FCoP (center of pressure) and FO (foot off) gait events respectively) correspond to the detected FC, maxima FCoP and FO gait events respectively. Arrows mark the additional points for improvements [25]. ... 9
Figure 2.1: Recorded vertical GRF during double stance phase of 5 different individuals ... 10
Figure 2.2: Recorded antero-posterior GRF during double stance phase of 5 different individuals ... 11
Figure 2.3: Recorded medio-lateral GRF during double stance phase of 5 different individuals .. 11
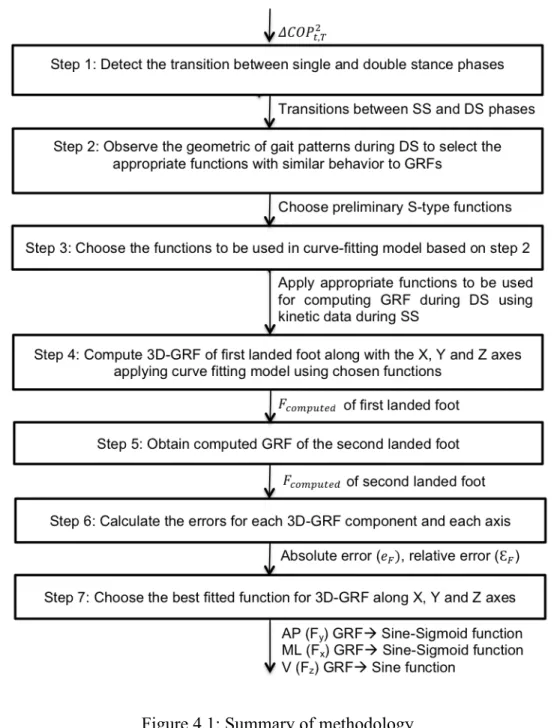
Figure 4.1: Summary of methodology ... 21
Figure 4.2: Focus on the human body walking on the force platforms. ... 22
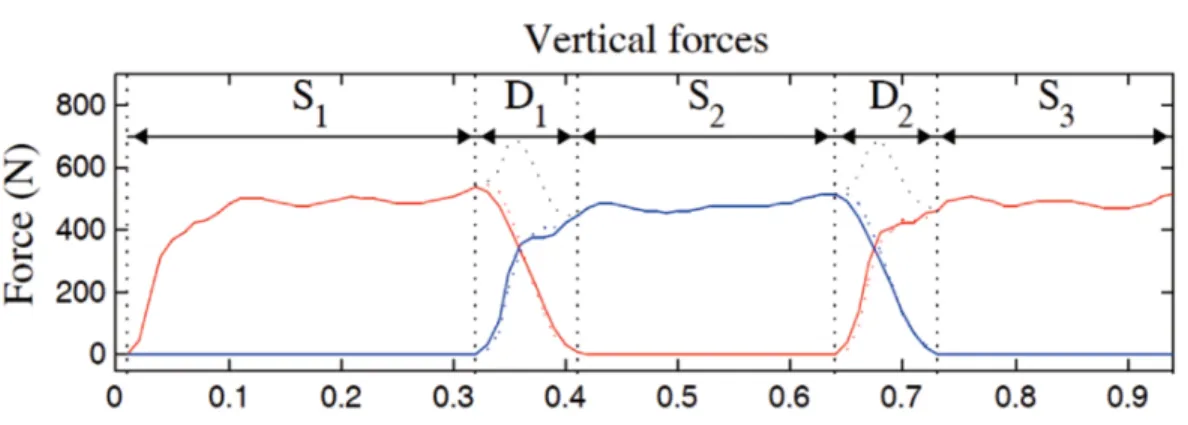
Figure 4.3a: Antero-posterior (AP) forces during SS1, DS and SS2, b. Medio-lateral (ML) forces during SS1, DS and SS2, c. Vertical (V) forces during SS1, DS and SS2. ... 32
Figure 5.1: Motion analysis laboratory ... 43
Figure 6.1: Antero-posterior GRF during DS of two different individuals ... 47
Figure 6.2: Medio-lateral GRF during DS of two different individuals ... 48
Figure A.1.A – Medio-Lateral ground reaction forces for 30 subjects ... 59
Figure A.1.B – Antero-posterior ground reaction forces for 30 subjects ... 60
LIST OF SYMBOLS AND ABBREVIATIONS
3D Three-dimensional
AP Antero-posterior ground reaction force
BM Body mass
COP Centre of pressure
DS Double stance phase of gait cycle GRF Ground reaction forces
ML Medio-lateral ground reaction force SD Standard deviation
SS Single stance phase
CHAPTER 1
INTRODUCTION
Nowadays studies on gait analysis cover a wide range of interests and domains; i.e. clinical purposes in terms of computing centers of pressure, spatial-temporal parameters, joint torques, movements recognition and health monitoring [1], [2] and civil engineering in terms of understanding the interactions between the foot, the structure and the dynamical behavior of the structure underneath it [3]. These interests lead to the need of recording ground reaction forces (GRF) during gait.
For this purpose, separate force platforms, long force platforms and treadmills equipped with force platforms are generally used. However, there are some advantages and disadvantages in using both of them. Using the single platforms provides the possibility of directly having GRF under each foot; meanwhile it may lead to the need of performing numerous gait trials to obtain valid cycles, where both steps are fully inside the force platforms. Furthermore, even when the 3D-GRF is obtained they can be a result of undesirable targeted steps. In fact the participants might unconsciously change their gait patterns in terms of targeting their steps to hit the separate platforms and therefore altering their natural gait pattern and the 3D-GRF values [4], [5].
In gait studies, there are always attempts to avoid long evaluation time and targeted footsteps. This may have undesirable impact on the results of studies concerning muscular fatigue contents as well as individuals with impaired gait and children [6]. Thus, it might be possible to reduce the number of trials by arranging starting positions of each subject to make the stances coincide with the force platforms [7]. It has been reported that changing only 10% in step length has a significant impact on GRF [5], [7], [8].By using unique force platforms, obtaining the desired cycles is not complicated but the recorded GRF represent the total forces under both feet. To have better understanding of gait pattern and GRF during walking in individuals, it is needed to have GRF separately under each foot.
The gait cycle is composed of 60% of stance phase when foot is in contact with the ground and 40% of swing phase where foot is in the air [9]. The stance phase includes the single stance phase when there is one foot in contact with the ground and the double stance phase when both feet are in contact with the ground. The need for decompose GRF is obviously needed during DS, which is about 25% of each gait cycle (Figure 1.1).
Figure 1.1: Gait cycle phases [10]
The decomposition methods are usually based on kinetics and kinematics variables of SS before and after DS as well as gait velocity. Kinematics parameters during gait are referred to the human joints and segments movements independent of forces, which are recorded by motion capture systems. They include displacements, velocities and accelerations that happen in the articulations during gait. Kinetics parameters are the forces that cause human movements. It is composed of internal and external forces. The source of internal forces is muscle activity or the friction in the muscles and joints, and the external forces come from the ground or external loads [11].
Although some methods have been proposed to decompose 3D-GRF, to the author’s knowledge, they mainly use, kinematics parameters and gait speed. However, the kinetics parameters have better predictability than the kinematics parameters with gait speed [12].
Consequently, this thesis aims to propose an automatic s-type parametric curve-fitting model to decompose 3D-GRF along the three axes (X, Y, Z) under left and right profiles. This method can be applied without the need of a motion capture system by using kinetics parameters of the single stance phase before the double stance phase.
The main characteristic needed for the method proposed in this thesis is to be easily implemented in various populations and domains such as functional evaluation in rehabilitation [1]. Indeed, in clinical populations including children and adults, the gait analysis play an important role in their pre-treatment assessment, surgical decision making and postoperative follow-up[13].
The rest of this document is organized as following. In chapter 2, state-of-the-art is presented. The objective of this master project is discussed in chapter 3. Chapter 4 is an article that was submitted to report the final results of this project. Chapter 5 thoroughly explains the methodology. The results of the study is demonstrated in chapter 6. A discussion over the results of this project is presented in chapter 7; and chapter 8 is the conclusion and recommendations of possible implementations concerning the motion analysis.
CHAPTER 2
LITERATURE REVIEW
Research works related to ground reaction forces decomposition can be divided into two main categories: 1.Studies concerning detection of gait events, which are the transition between single stance phase (SS) and double stance phase (DS); and 2.Studies concerning decomposition ground reaction forces (GRF) itself. However, to decompose GRF, it remains essential to detect phase transition. In this chapter, first we present a comprehensive literature review on these two main categories and then explain the problem of this research project.
2.1 Studies on determination of gait events
Begg (2000) [14] proposed a method to detect the transition between SS and DS, assuming that a local minimum is present in GRF patterns before and after each DS. This assumption is the major limitation of applying this method, since minima are not systematically present in natural GRF patterns [7].
O’Connor et al. (2006) [15] detected the transition between SS and DS automatically based on a simple velocity curve derived from heel and toe marker trajectories, using a motion capture system.
Zeni et al. (2008) [16] proposed two automatic algorithms using solely kinematics data to detect gait events. Both of the algorithms were based on the positional changes of the foot markers. The major problem of these two studies is the need for a motion capture system.
2.2 Studies on GRF decomposition
Davis and Cavanagh (1993) proposed a method to decompose vertical (V) GRF under each foot using a unique large force platform [8]. Their method was based on examining side-to-side oscillations of the measured center of pressure (COP), and detecting the phase transition when the COP exceeds a certain threshold. They calculated the individual GRF profiles by means of solving two simultaneous equations. One equation defined the equilibrium of forces in the vertical direction, and the other one defined the equilibrium of moments about an antero-posterior axis of the force platform. Although their study was the most cited on decomposing V GRF [17]– [21], some uncertainties exist in their proposed method. For example, the detection of phases on the basis of examining side-to-side oscillations of the global COP may not be an accurate method
for children due to their lower weight or subjects with impaired gait, since the oscillations of the global COP may not be performed properly. However, in numerous cases, the COP path of Medio-lateral (ML) forces does not systematically show a clear side-to-side inflection point as presented by Davis and Cavanagh. The robustness of the method has not been largely tested on different participants with diverse gait patterns. They validated their method on one healthy adult only, walking with three different speeds (Figure 2.1) [8].
Figure 2.1: Temporal summation of left and right GRF profiles for successive steps [8].
Ballaz et al. (2013) [7] (a study from our laboratory) developed the first automatic method to detect the SS and DS transition using difference of COP in the horizontal plane between two given time instants. They also proposed the first automatic method to decompose the V GRF profiles during the DS by using cubic spline curve interpolation. In a cubic spline interpolation, a series of cubic polynomials are fitted between the first and the last points of the DS, while the obtained curve is continuous and smoothed [22]. The proposed decomposition method was based on predicting GRF applying cubic spline curve interpolation by modeling the curve of the first
foot leaving the ground (Figure 2.2). The foot that first leaves the ground has a smoother curve compared to the second foot.
Therefore the decomposed GRF of the second foot was obtained by differentiating between the total force and the decomposed force of the first foot leaving the ground. The mean relative error for V GRF was 3.8%. They validated their method on 6 typically developed children performing a total of 36 stances. However, the decomposition of the other components of GRF i.e. ML and antero-posterior (AP) were not studied. Whereas the interpolation method is less suitable for clinical gait, since the transition is not always smooth [21].
Figure 2.2: Time evolution of the vertical components of the GRFs approximated by splines (solid line) and the corresponding measured GRFs (dotted line); the total measured vertical GRFs
are also presented in dotted lines during the double stances [7]
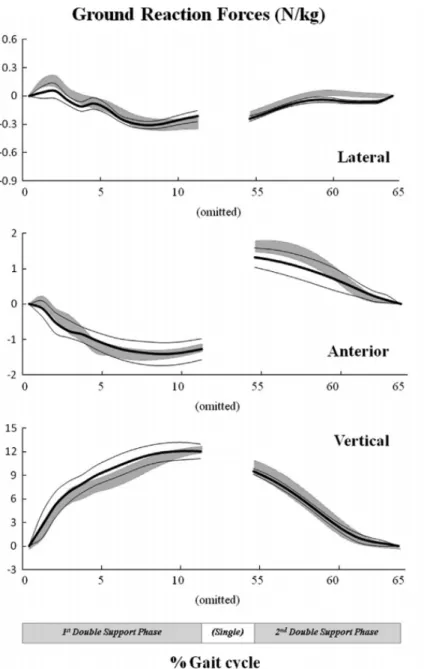
Oh et al. (2013) [23] predicted forces and moments during SS and DS. They applied a genetic algorithm-general regression neural network; using 14 kinematics parameters of gait during SS. They used the experimental data of the 43 subjects as training data and validated their method on 5 healthy adults (Figure 2.3). The mean relative errors were up to 11.7%. The major practical limitation of their method to compute GRF was as this method would require a motion capture system and a training process when the targeted population is changed.
Figure 2.3: Predicted GRF from the artificial neural network method (mean (thick line) ± 1 SD (thin lines), described as the mean of 10 folds) vs. measured GRF (mean ± 1 SD (shaded area)) in
the double support phase [23]
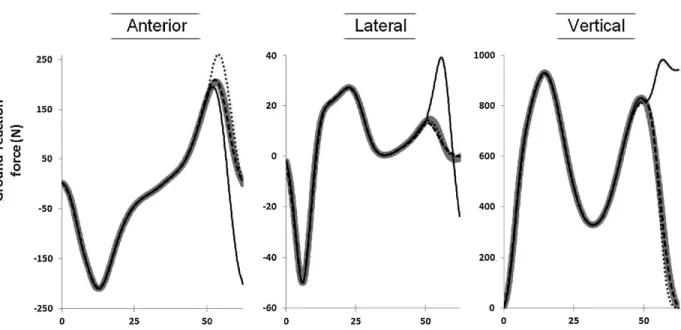
Villeger et al. (2014) [24] succeeded to propose a method in decomposing the 3D-GRF with mean relative error up to 18.01%. In their proposed method, a shape coefficient was adjusted using GRF kinematic parameters, including the gait velocity, during single stance phase. This coefficient was optimized by a non-linear least-square curve fitting to fit the predicted signals
with the recorded GRF. Then the GRF were decomposed to left and right profiles performing a multiple regression (Figure 2.4). But again the same limitation, which is the need of motion capture system, exists.
Figure 2.4: Illustration of total GRF (black line), real GRF (large gray line), GRF from our method (black dashed line) and GRF from Ren’s method (black pointed line) for the foot leaving
the ground [24].
Meurisse et al. (2015) [21] proposed a method to determine GRF based on the distance covered by COP. The developed algorithm was a revision of Davis and Cavanagh method [8]. However they validated their method on V GRF only and not on 3D-GRF.
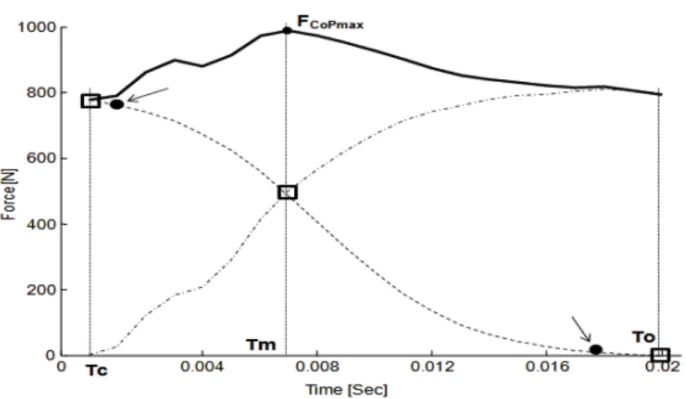
Hijazi and Makssoud (2015) [25] proposed a hyperbolic tangent function to decompose V GRF by defining the parameters of the function. The parameters were determined by iterations on a compatible computer using MATLAB® (Mathworks®, USA). They obtained the function parameters by minimizing the sum of the squared parameters. Marquardt parameter [26] was considered as initial value of the parameters. The iteration procedure was defined to stop at 10-7 for the residual sum of square. They tested their proposed method on one healthy adult walking with three different gait velocity. However, the method was not validated by comparing recorded GRF and decomposed GRF (Figure 2-5). Therefore the accuracy of their proposed model is
questionable. In addition the number of iterations for each parameter vary from 72 to 151 which can be considered as a long time procedure.
Figure 2.5: Right (dashed), left (dot-dashed) GRF and the sum during double stance phase (line). TC, TM and TO (Instants TC, TM and TO correspond to the detected FC (foot contact), maxima FCoP (center of pressure) and FO (foot off) gait events respectively) correspond to the detected FC, maxima FCoP and FO gait events respectively. Arrows mark the additional points for
improvements [25].
2.3 Problem
As cited above, the major limitation of the methods used for the decomposition of 3D-GRF, is the need for a motion capture system [23], [24]. Furthermore, most of the studies concerning GRF focus on the decomposition of V GRF only [7], [8], [21], [25] and ignore the other two axes. The geometric curve pattern of ML and AP GRF are more variable during gait in comparison to the vertical GRF. This variability can be explained due to the small magnitudes of ML and AP GRF, in comparison to the V GRF [27]. Therefore applying decomposition methods on ML and AP
GRF are more complex than for V GRF. Some others studies focus on the detection of gait events (DS and SS) and not decomposing 3D-GRF [15], [16], [28]–[30] . Due to the fact that GRF decomposition methods are applied only during DS, it is essential to detect the transition between phases while using long single force platforms in gait analysis. Furthermore, the number of participants in most of the above-mentioned research works, was generally quite low, ranging from one single participant to 7 participants; whereas the current research project used 30 healthy subjects, and can be implemented without the need of a motion capture system.
The general geometric curve pattern of GRF during double stance phase presented in [7], [21], [23]–[25], [31] and the recorded experimental data of this research project (Figures 2.1-2.3) showed the similarity between the profiles of the GRF and s-type functions. s-type functions are referred to the mathematical functions that produce s-type shapes [32]. This is the reason why we chose to use different types of s-type functions to compute GRF during DS.
Figure 2.7: Recorded antero-posterior GRF during double stance phase of 5 different individuals
2.4 Summary of the problem
The literature review has identified the followings:
• There is not any report study on decomposing 3D-GRF that does not use a motion capture system.
CHAPTER 3
RATIONALE OF THE PROJECT
3.1 General objective
The general objective of this project is to develop a method to increase the accuracy of decomposition of 3D-GRFs under each foot and along X, Y and Z axes using s-type parametric curve modeling.
3.2 Specific objective
The specific objective of this project is defining the best s-type function.
3.3 Hypothesis
The research hypothesis of this project is by using s-type parametric curves using gait information from SS will yield more accurate results than the literature for predicting GRF along X, Y and Z axes.
3.4 Research questions
The main research question of this project is:
How to decompose GRF during DS applying s-type parametric curve fitting models without using a motion capture system?
The complementary research questions are:
• What are the mathematical functions the most suited for modeling 3D-GRF?
• Is there one unique function that can model the 3D-GRF with minimal errors along X, Y and Z axes?
• Does the hypothesis lead to better results than the results using spline interpolation method?
CHAPTER 4
ARTICLE 1: “DECOMPOSITION OF
THREE-DIMENSIONAL GROUND-REACTION FORCES UNDER BOTH FEET
DURING GAIT USING PARAMETRIC CURVE MODELING”
4.1 Presentation of the article
DECOMPOSITION OF THREE-DIMENSIONAL GROUND-REACTION
FORCES UNDER BOTH FEET DURING GAIT USING PARAMETRIC
CURVE MODELING
The following article was submitted on July 2016. This article presented the results of this master research project, submitted to ‘Gait and Posture journal’.
As first author, the M.Sc. candidate has 75% of contribution.
“Decomposition of three-dimensional ground-reaction forces under both feet during gait using parametric curve modeling”
Bahare Samadi a,b*, Sofiane Achiche c, Laurent Ballaz b,d, Maxime Raison a,b,c
a Rehabilitation Engineering Chair Applied to Pediatrics, Polytechnique Montréal and
Sainte-Justine UHC, Montreal (Qc), Canada
b Research Center – Sainte-Justine UHC, Montreal (Qc), Canada
c Department of mechanical engineering, Polytechnique Montréal, Montreal (Qc), Canada
d Department of physical exercise sciences, Université du Québec à Montréal (UQAM), Montreal
* Corresponding author: Bahare Samadi
Rehabilitation Engineering Chair Applied to Pediatrics (RECAP), Polytechnique Montréal, Principal building, room A530,
2500, Chemin de Polytechnique Montreal, Quebec
Canada H3T 1J4
Tél. : +1 (514) 340-4711 # 3345
Email address: [email protected] Conflict of interest: None
4.2 Abstract
Introduction: Obtaining the three-dimensional ground reaction forces (3D-GRF) requires a
platform path, such as a long platform or several juxtaposed platforms. The main shortcoming of these platform paths is that during double stance phases of gait, both feet can be placed on the same force platform causing the need for decomposing the 3D-GRF into left-foot and right-foot profiles. Objective: The current study presents an automatic method using s-type parametric curve modeling to increase the accuracy of decomposition of 3D-GRF during double stances under each foot, along X, Y, and Z axes. Methods: Thirty healthy adults walked naturally on a floor equipped with separate force platforms. The decomposition method was applied to the global 3D-GRF using 3rd order polynomial, sine, and sine-sigmoid functions. The computed 3D-GRF was compared to the 3D-3D-GRF independently recorded by force platforms for each subject.
Results: The relative average error between the computed 3D-GRF and the recorded 3D-GRF
were equal 3.2±1.9%. In details for the vertical, antero-posterior, and medio-lateral forces, these errors were 2.9±1.6%, 6.6±4.4%, and, 9.5±3.6%, respectively. The computation times were up to 0.9 ms during one double stance phase in MATLAB®. Discussion and conclusion: This study proposed an automatic 3D-GRF decomposition method, tested on 30 subjects. The global error on the GRF is the best one in the literature. The process works in real-time, enabling to be implemented on platform paths. The perspectives are to validate the method for various populations with musculo-skeletal disorders, extend it to various movement analyses, and compute the corresponding spatio-temporal parameters without the use of any motion capture system.
Keywords: gait; prediction of 3D ground reaction force; force platforms; double stance phase decomposition; s-type parametric curve modeling
Abbreviations:
3D: Three-dimensional AP: Antero-posterior COP: Centre of pressure DS: Double stance
GRF: Ground reaction forces ML: Medio-lateral
SD: Standard deviation
SS1: Single stance phase before the double stance phase SS2: Single stance phase after the double stance phase V: Vertical
4.3 Introduction
Ground reaction forces (GRF) under each foot are crucial to different domains ranging from biomechanics, to compute centers of pressure and spatio-temporal parameters [1–3], health monitoring [4,5] and structural dynamics, to model the interaction between the foot and the structure [1,6].
Three-dimensional ground reaction forces (3D-GRF) are traditionally recorded using separate platforms under each foot, but it may lead to a large number of trials to get a valid cycle i.e. both steps inside the force platforms separately, which is both time consuming and difficult to achieve [7]. In fact, the participants might unconsciously change their gait patterns in terms of targeting their steps to hit the separate platforms and therefore altering their natural gait pattern and consequently the 3D-GRF [7]. Changing only 10% in step length has a significant impact on GRF [8–10]. Moreover, increasing the number of trials leads to muscular fatigue and can hence also affect the results [11,12].
Therefore, the interest in using other means such as single long force platforms and force measuring shoes and insoles has emerged as substitute solutions for more accurate gait analysis. Measuring shoes and insoles, can only be used for measuring vertical forces and pressures, which is not a reliable clinical measure of 3D-GRF solely due to its sensitivity to any action or reaction changing the ground reaction force vector [13,14].
Consequently using unique force platforms emerges as a practical method to facilitate and accelerate the procedure of recording GRF data for a varied population [15]. The remaining challenge is to decompose the global 3D-GRF under each foot, since the long force platform only provides the resultant of GRF for the two feet combined.
Decomposing the GRF has been a challenge for more than two decades. First Davis and Cavanagh (1993), proposed a method to decompose vertical GRF profiles [8]. They validated their method on only one healthy adult walking with three different speeds. To detect the transition between phases, their proposed method was based on the analysis of the side-to-side oscillations of the global center of pressure (COP). In numerous cases, the COP path of medio-lateral forces does not systematically show a clear side-to-side inflection point [9]. Meurisse et al.
(2015) [16], developed their method based on Davis and Cavanagh idea, but only to decompose vertical GRF.
Ballaz et al. (2013) were the first authors to propose an automatic method to detect SS and DS transition based on the difference of COP in the horizontal plane between two given time instants. They also proposed an automatic method to decompose vertical GRF profiles by using interpolation splines with an average error of 3.8%, tested on 6 typically developed children [9,17]. However spline interpolations do not consider the typical patterns of GRF which are not always smooth, therefore potentially leads to inaccuracies [16].
Hijazi and Makssoud (2015) [18] proposed a method tested on one healthy adult, using a model based on hyperbolic tangent function to decompose vertical (V) GRF. The robustness of the method can be questionable since they did not validate their method by comparing the computed GRF to the recorded GRF. However, their model was sensitive to the quality of initial values of parameters.
The studies discussed above could not achieve to decompose GRF along the two other axes, which are antero-posterior (AP) and medio-lateral (ML) axes. However, they remain essential to 3D-GRF decomposition, since they are recognized as more variable force indicators than the V GRF [19]. It can be explained by their relative small magnitudes in comparison to the vertical forces [20].
Recently, Oh et al. (2013) [21] and Villeger et al. (2014) [22] decomposed 3D-GRF by applying genetic algorithm-general regression neural network and multiple regression parameter models, respectively. The major practical limitation to compute GRF in these methods is the need for motion capture systems.
Some studies have been also performed only to detect the transition of the phases using motion capture systems [23–26].
Consequently as of today, no method has been proposed for the decomposition of 3D-GRF solely using force platform measurements. Furthermore, no method has ever been tested on at least 30 subjects to enable large group statistics.
The aim of this study is to develop an automatic method that decomposes global 3D-GRF under each foot during the DS by using s-type parametric curve modeling. This method would be
suitable for any platform path, whether a long force platform or juxtaposed platforms, and without need of a motion capture system.
4.4 Methods
4.4.1 Participants
Thirty healthy adults volunteered for this study with an average age of 24.8 (standard deviation (SD): 3.09 year), range: 20-34; 17 male.
4.4.2 Set-up and procedure for data collection
The experimental procedure was explained for each participant and all participants provided written informed consent prior to test.
To record left and right GRF independently measured on two platforms during untargeted gait, the participants were asked to walk naturally barefoot at their own preferred speed, looking straight ahead without targeting their steps on the platforms. The trials with both steps inside the force platforms were systematically used for this study.
A low-pass filter with a 4th order Butterworth using a 4Hz cut-off frequency was applied to the GRF to remove the noise.
4.4.3 Computed parameters and GRF decomposition
To have a better understanding of the global approach used in this paper, the complete steps of the procedure are summarized in figure 4.1 and detailed in the following sub-sections.
Figure 4.1: Summary of methodology
DS: Double stance, SS: Single stance, 3D-GRF: Three dimensional ground reaction forces,: Computed GRF by proposed method,: Individually measured GRF on each platform during DS under each foot, : Total recorded GRF on the platforms,: GRF under the second landed foot, AP: Antero-posterior GRF, ML: Medio-lateral GRF, V: Vertical GRF
To detect the transition between SS and DS (step 1), first the center of pressure (COP) of each force platform was obtained and then the global COP was computed. The peak of (Eq. 1) was then compared with the constant thresholds to detect the phase transitions.
(1)
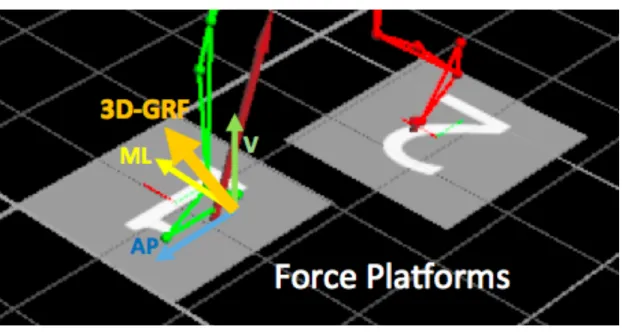
where y axis is aligned with the AP, x axis is aligned with the ML ,and z axis is aligned with the V direction (Figure 4.2):
- is the vector of the local COP position for each platform;
- is squared Euclidian norm in the horizontal plane between two given time instants t and t + T of the global center of pressure.
Figure 4.2: Focus on the human body walking on the force platforms.
V: Ground reaction forces (GRF) along with the vertical axis, ML: GRF along with the X axis, AP: GRF along with the Y axis, 3D-GRF: Global GRF (Eq. 22, 23), which is the norm of the V,
A preliminary study was performed using a curve fitting method on the recorded GRF during DS to choose the best functions to fit to the GRF. For this purpose. MATLAB® (Mathworks, Natick, Massachusetts, U.S.A.) lsqnonlin curve fitting tool, which solves nonlinear data fitting problems was used. The initial values were specified by iteration.
Although some differences do occur due to different walking behavior [20] (Step 2), the observation showed that in average the best functions, fitted for GRF components during DS, were chosen as 3rd order polynomial, sine and sine-sigmoid as shown in the equations 2-5 respectively (Step 3).
(2)
(3)
(4)
= + (5)
where is the time samples of experimentally recorded GRF during DS. The GRF were computed by applying the selected functions (Step 4).
It is worth noting that in our proposed method to compute the parameters of each function, we do not need to solve any non-linear least square problems. We defined the parameters on the basis of the kinetic information during SS before the DS and the fact that the value of the force in the modeled foot is equal to zero as soon as it leaves the ground. However, we found the relation between the function parameters and forces and temporal information [18].
The following sub-sections present the computation of the parameters for
4.4.3.1 Computation of the 3rd order polynomial function
To compute the GRF during DS using 3rd order polynomial function, the equations 6-9 are used (Figure 4.3a). These equations are defined using the kinetic parameters during SS1 provided by force platforms: (6) (7) (8) (9) where:
- x0 (1 1) is the last time of the first single stance phase (SS1) before the DS;
- (1 1) is the value of GRF in the last frame of SS1;
- (1 1) is the mean slope of GRF for the last 5 frames of SS1 (the last 5 frames were chosen to describe the slope tendency);
- xL (1 1) is the first frame of second single stance (SS2) after DS where the first foot leaves the floor;
- E (1 1) is the slope of the GRF of the first landed foot, at the first frame of SS2, which is equal to 0.
4.4.3.2 Computation of the sine function
To compute the GRF during DS using sine function, the required parameters for sine function are calculated by the equations 10-13:
(10)
(11)
(12)
(13)
where:
- (1 1) is amplitude of sine function;
- (1 1) is period of sine function;
- (1 1) is horizontal phase shift of sine function, defines the start point of sine function for each GRF in horizontal axis;
- (1 1) is vertical phase shift of sine function, defines where the computed curve should be started vertically;
- a (1 1) is a constant value that determines the appropriate codomain of sine function to adjust with the experimental GRF, which is equal to 0.6 for ML and AP GRF, and 0.5 for V GRF practically defined based on geometric pattern comparison between the experimental curve of GRF along each axis and a typical sine curve;
- (1 1) is the value of GRF in the last frame of SS1 (Figure 4.3a);
- b (1 1) is a constant value determines the required period of the sine function adjusted to the experimental GRF which is equal to 2, practically defined based on geometric pattern comparison between the experimental curve of GRF along each axis and a typical sine curve;
- x0 (1 1) is the last frame of SS1(Figure 4.3a);
- tDS (vector, n 1) is the duration of DS phase;
- c1 (1 1) is a constant value, determines the start point of sine function appropriate for GRF along each axis, which is equal to -20 for ML, +20 for AP, and 0 for V GRF, practically defined based on geometric pattern comparison between the experimental curve of GRF along each axis and a typical sine curve;
- c2 (1 1) is a constant value to calculate the required horizontal phase shift, practically defined on the basis of geometric pattern comparison between the experimental curve of GRF along each axis and a typical sine curve which is equal to 0.5;
- d (1 1) is a constant value defines the start point of sine function along the vertical axis, practically defined on the basis of geometric pattern comparison between the experimental curve of GRF along each axis and a typical sine curve which is equal to 0.5;
4.4.3.3 Computation of the sigmoid and sine-sigmoid functions
To compute GRF applying the sigmoid function, due to the pattern of the GRF during DS, we added the sine function to the first part of sigmoid function. Typical sigmoid functions start with a horizontal asymptote, however the GRF starts with an arch pattern. Therefore the first part (x0 to Q) is combination of sine and sigmoid functions and the rest (Q to xL) is fitted by only sigmoid function. Equations 14-16 show the calculation of sigmoid and sine-sigmoid functions’ parameters used to compute GRF. All of the equations were defined based on the kinetic parameters during SS1 and SS2 provided by force platforms:
(15) (16) (17) where - is a sigmoid function; - is a sine function;
- is the derivative of the sigmoid function;
- L (1 1) is a constant value obtained practically based on geometric pattern comparison between the experimental curve of GRF along each axis and a typical sigmoid curve, equal to 0.01 for ML, 2.4 for AP and 6.5 for V GRF. It defines the point where the added sine function to the sigmoid function should be terminated, whatever the value is bigger, the computed curve starts with bigger arc;
- (1 1) is the first time during DS where is equal to L;
- (1 1) is the codomain of sigmoid function, which is equal to , value of the GRF in the last frame of SS1;
- (1 1) is a constant value obtained practically based on the geometric curve pattern.it defines the slope of sigmoid curve, as it increases the curve is steeper, which is 11.5 for AP and ML GRF and 6.5 for V GRF;
- (18)
- tc (vector, n 1) is the time between x0 and when = L;
- x0 (1 1) is the last frame of the first SS before DS;
- (1 1) is the slope of GRF in the last 5 frames SS1;
- m (1 1) is a constant value defining center of sigmoid function during DS, obtained practically based on the geometric pattern comparison between the experimental curve of GRF along each axis and a typical sigmoid curve which is 0.5 for ML and V GRF and 0.6 for AP GRF;
- n (1 1) is a constant value defining the horizontal phase shift of the sigmoid function, which is 4 for ML and 15 for AP GRF;
- s is equal to 3, defining the vertical shift of sine function of the fitted curve.
The GRF of the second foot that lands obtained by subtracting the GRF of the first foot from the total GRF and is obtained as follows (step 5):
(19)
where,
- is a vector (n 1) of GRF of second foot that lands; is a Vector (n 1) of computed GRF of the first foot that lands.
4.5 GRF error analysis
During the DS, the mean absolute error (1 1) between calculated and recorded GRF is defined as (step 6):
| (20)
where
- [N] is a vector (n 1) of GRF computed by the proposed method;
- [N] is a vector (n 1) of individually measured GRF on each platform during DS;
- n is a vector that defines the number of recorded samples during the DS.
Finally the best function fitted for each axis was chosen based on the minimal value of mean relative error (step 7).
Complementarily, a mean relative error (1 1) is defined as follow:
(21)
where,
- (1 1) is maximal measured GRF during DS.
The mean global absolute and mean relative error of 3D-GRF were calculated with the chosen function for GRF along each axes, as bellow:
where,
- (1 1) is mean of global absolute error;
(23)
- [N] is a vector (n 1) of computed 3D-GRF calculated by best function for each axis;
(24)
- [N] is a vector (n 1) of independent recorded 3D-GRF by force platforms
(25)
- (1 1) is the mean of global relative error
- (1 1) is the maximal 3D-GRF during DS phase
4.6 Results
Figures 4.3a-c illustrate the results of computed GRF for one subject using all the functions predicting the GRF vs. the actual recorded GRF.
4.3a.
4.3c.
Figure 4.3a: Antero-posterior (AP) forces during SS1, DS and SS2, b. Medio-lateral (ML) forces during SS1, DS and SS2, c. Vertical (V) forces during SS1, DS and SS2.
Recorded trial on the FPFs (black), spline interpolation (magenta), parametric curve modeling using sine function (cyan), parametric curve modeling using sigmoid-sine function (blue), parametric curve modeling using 3rd order polynomial function (red).
SS1: The first single stance phase before double stance, DS: Double stance phase, SS2: Second single stance phase after double stance,: Value of GRF in the last SS1 frame, Slope of GRF in the last 5 frames of SS1, x0: Last frame of first single stance (SS) before double stance (DS), xL: First frame of second SS after DS where the first foot leaves the floor, FPFs: Force platforms
Table 4.1 presents the mean relative errors and the mean absolute errors normalized by body mass between the computed and measured GRF. The mean relative error obtained from using the different functions does not vary greatly, which can leads us to think that the functions were indeed selected properly. The minimal mean relative error calculated for each force component is shown in underlined bold.
Table 4.1: Statistical results of the 30 participants.
εmean, eabs , emax, and emin, respectively, mean relative error between computed and recorded ground reaction forces (GRF), mean absolute error between computed and recorded GRF normalized to body mass (BM), maximal and minimal absolute error. DS: Double stance; ML: Medio-lateral GRF (Fx); AP: Antero-posterior GRF (Fy); V: Vertical GRF (Fz)
Decomposed
method GRF εmean(%) ±SD eabs(N/Kg) /BM±SD emax (N) e(N) min
Spline interpolation [9] ML 10.2 ± 4.9 0.07 ± 0.04 12.9 1.3 AP 12.7 ± 6.5 0.3 ± 0.13 40.6 8.5 V 3.3 ± 2.0 0.5 ± 0.33 94.1 12.1 3rd order Polynomial ML 10.7 ± 4.6 0.1 ± 0.04 11.2 1.4 AP 14.8 ± 8.6 0.4 ± 0. 2 61.6 8.8 V 3.0 ± 2.0 0.4 ± 0.29 90.5 10.4 Sine ML 9.9 ± 3.9 0.1 ± 0.04 13.4 1.2 AP 10.7 ±5.7 0.3 ± 0.12 32.5 7.3 V 2.9 ±1.6 0.4 ± 0.23 79.4 11.4 Sigmoid ML 11.4 ± 5.1 0.1 ± 0.04 13.8 1.9 AP 9.1 ± 4.9 0.2 ± 0.10 26.5 4.0 V 3.1 ±1.7 0.4 ± 0.20 81.6 9.3 Sine-Sigmoid ML 9.5 ± 3.6 0.1 ± 0.04 11.8 1.0 AP 6.6 ± 4.4 0.2 ± 0.09 24.1 4.1 V 3.3 ±1.7 0.5 ± 0.23 79.5 13.2
Table 4.1 mainly presents a low mean relative error of 2.9% (SD: 1.6%) for the vertical forces using the sine function, and the values of 6.6% (SD: 4.4%) and 9.5% (SD: 3.6%) for antero-posterior and medio-lateral forces respectively using the sine-sigmoid function, were reported. It provides the global 3D-GRF error equal to 3.2% (SD: 1.9%) on global GRF.
Table 4.2 reports the number of subjects, fitted with minimal value of error for each modeling function and spline interpolation to observe the most fitted function along each axis.
Table 4.2: Comparison of the number of subjects fitted with each method.
Spline interpolation
Parametric curve fitting
3rd Order polynomial Sigmoid Sine Sine-Sigmoid
ML GRF 5 0 1 14 10
AP GRF 5 0 4 2 19
V GRF 3 8 5 9 5
During one DS, the computation times were 0.4, 0.8, and 0.9 ms for V, AP, and ML GRF decompositions respectively during one double stance phase, compared to 60 ms using spline curve interpolation for V, AP and ML GRF.
4.7 Discussion
The current study proposed a new method to improve the accuracy of decomposition of GRF during double stance phase (DS) of gait using s-type parametric curve modeling.
Table 4.1 mainly presents a low mean relative error of 2.9% (SD: 1.6%) for the vertical forces using the sine function, and the values of 6.6% (SD: 4.4%) and 9.5% (SD: 3.6%) for
antero-posterior and medio-lateral forces respectively using the sine-sigmoid function, were reported. It provides the global 3D-GRF error equal to 3.2% (SD: 1.9%) on global GRF.
Observing the behavior of GRF during DS (Figure 4.3a-c, appendix 1a-c), shows that the vertical GRF, unlike the AP and ML GRF, almost follows similar geometric patterns among the different subjects. It can justify the interest of studies decomposing V GRF solely [8,9,18] in comparison to studies decomposing GRF along X and Y axes [21,22] and also the lower value of relative error compared to AP and ML GRF.
Table 4.2 reports the number of subjects, fitted with minimal value of error for each modeling function and spline interpolation to observe the most fitted function along each axis.
Comparing our results with the cited ones, one can notice an increase up to 47% and 38% of mean relative errors in decomposition of ML and V GRF respectively proposed in [9,21,22]. We could also obtain maximum GRF difference normalized to body mass lower than 1 N/kg (0.1 N/kg, 0.1 N/kg, 0.9 N/kg, for AP, ML and V respectively) which is equivalent to the results presented in Villeger et. al [22].
Finally, the process works in real-time, enabling to be implemented on platform paths. Further, a translation of the code from MATLAB to a real-time dedicated process, e.g. in C++, would certainly reduce this time by a factor of 100.
The proposed decomposition method and the phase detection procedure are sensitive to the noise, therefore a low-pass filter were applied to the data base. It can be considered as the limitation of the method while implementing on the other data base with higher value of noise.
4.8 Conclusion
This study proposed an automatic 3D-GRF decomposition method during gait, tested on 30 subjects. The global error on the GRF, i.e. 3.2±1.9%, was obtained using sine-sigmoid function for AP and ML GRF, and sine function for V GRF. This error is the best one in the literature. Further, the process works in real-time, enabling to be implemented on platform paths. Consequently, the method is recommended to be implemented on devices to obtain the 3D-GRF on several gait cycles using platform paths, such as sensory floors [21,28] and treadmills [25] or conventional juxtaposed force platforms.
The perspectives are to validate the method for various populations with musculo-skeletal disorders, extend it to various movement analyses, such as gait with a cane or a walker, and compute the corresponding spatio-temporal parameters without the use of any motion capture system.
ACKNOWLEDGMENTS
The authors would like to thank the Pierre-Arbour Foundation for their support. Further, we are grateful to Audrey Parent for her help during the experimental recordings, Chin-Wei Huang and Qin Fang Chua for their assistance for the data analysis.
REFERENCES
[1] L.-N. Veilleux, M. Raison, F. Rauch, M. Robert, L. Ballaz, Agreement of spatio-temporal gait parameters between a vertical ground reaction force decomposition algorithm and a motion capture system, Gait Posture. 43 (2016) 257–264. doi:10.1016/j.gaitpost.2015.10.007.
[2] C.H. Soo, J.M. Donelan, Coordination of push-off and collision determine the mechanical work of step-to-step transitions when isolated from human walking, Gait Posture. 35 (2012) 292–297. doi:10.1016/j.gaitpost.2011.09.102.
[3] R. Kale Moyano, Human gait characterization using Kinect, (2015). http://repositori.upf.edu/handle/10230/25322 (accessed May 13, 2016).
[4] S. Hernandez, M. Raison, A. Torres, G. Gaudet, S. Achiche, From on-body sensors to in-body data for health monitoring and medical robotics: A survey, in: 2014 Glob. Inf. Infrastruct. Netw. Symp. GIIS, 2014: pp. 1–5. doi:10.1109/GIIS.2014.6934279.
[5] V. Marconi, H. Hachez, A. Renders, P.-L. Docquier, C. Detrembleur, Mechanical work and energy consumption in children with cerebral palsy after single-event multilevel surgery, Gait Posture. 40 (2014) 633–639. doi:10.1016/j.gaitpost.2014.07.014.
[6] N. Amiryarahmadi, W. Kropp, K. Larsson, Application of LMS Algorithm to Measure Low-Frequency Transient Forces from Human Walking, Acta Acust. United Acust. 102 (2016) 23–34. doi:10.3813/AAA.918921.
[7] E. Oggero, G. Pagnacco, D.R. Morr, S.R. Simon, N. Berme, Probability of valid gait data acquisition using currently available force plates, Biomed. Sci. Instrum. 34 (1997) 392–397. [8] B.L. Davis, P.R. Cavanagh, Decomposition of superimposed ground reaction forces into left
and right force profiles, J. Biomech. 26 (1993) 593–597.
[9] L. Ballaz, M. Raison, C. Detrembleur, Decomposition of the vertical ground reaction forces during gait on a single force plate, J. Musculoskelet. Neuronal Interact. 13 (2013) 236–243. [10] P.E. Martin, A.P. Marsh, Step length and frequency effects on ground reaction forces during
walking, J. Biomech. 25 (1992) 1237–1239.
[11] D. Janssen, W.I. Schöllhorn, K.M. Newell, J.M. Jäger, F. Rost, K. Vehof, Diagnosing fatigue in gait patterns by support vector machines and self-organizing maps, Hum. Mov. Sci. 30 (2011) 966–975. doi:10.1016/j.humov.2010.08.010.
[12] X. Qu, J.C. Yeo, Effects of load carriage and fatigue on gait characteristics, J. Biomech. 44 (2011) 1259–1263. doi:10.1016/j.jbiomech.2011.02.016.
[13] T. Marasovic, M. Cecic, V. Zanchi, Analysis and Interpretation of Ground Reaction Forces in Normal Gait, WTOS. 8 (2009) 1105–1114.
[14] F. Martínez-Martí, M.S. Martínez-García, S.G. García-Díaz, J. García-Jiménez, A.J. Palma, M.A. Carvajal, Embedded sensor insole for wireless measurement of gait parameters, Australas. Phys. Eng. Sci. Med. Support. Australas. Coll. Phys. Sci. Med. Australas. Assoc. Phys. Sci. Med. 37 (2014) 25–35. doi:10.1007/s13246-013-0236-7.
[15] L.N. Veilleux, M. Robert, L. Ballaz, M. Lemay, F. Rauch, Gait analysis using a force-measuring gangway: intrasession repeatability in healthy adults, J. Musculoskelet. Neuronal Interact. 11 (2011) 27–33.
[16] G.M. Meurisse, F. Dierick, B. Schepens, G.J. Bastien, Determination of the vertical ground reaction forces acting upon individual limbs during healthy and clinical gait, Gait Posture. 43 (2016) 245–250. doi:10.1016/j.gaitpost.2015.10.005.
[17] B. Samadi, M. Raison, C. Detrembleur, L. Ballaz, Real-time detection of reaction forces during gait on a ground equipped with a large force platform, in: 2014 Glob. Inf. Infrastruct. Netw. Symp. GIIS, 2014: pp. 1–3. doi:10.1109/GIIS.2014.6934268.
[18] H. Hijazi, H.E. Makssoud, Modeling of vertical ground reaction forces during double stance phase of the gait cycle for real-time treadmill measurements, in: 2015 Int. Conf. Adv. Biomed. Eng. ICABME, 2015: pp. 238–241. doi:10.1109/ICABME.2015.7323296.
[19] M. Yazji, M. Raison, C.-É. Aubin, H. Labelle, C. Detrembleur, P. Mahaudens, M. Mousny, Are the mediolateral joint forces in the lower limbs different between scoliotic and healthy subjects during gait?, Scoliosis. 10 (2015) S3. doi:10.1186/1748-7161-10-S2-S3.
[20] L. Ren, R.K. Jones, D. Howard, Whole body inverse dynamics over a complete gait cycle based only on measured kinematics, J. Biomech. 41 (2008) 2750–2759. doi:10.1016/j.jbiomech.2008.06.001.
[21] S.E. Oh, A. Choi, J.H. Mun, Prediction of ground reaction forces during gait based on kinematics and a neural network model, J. Biomech. 46 (2013) 2372–2380. doi:10.1016/j.jbiomech.2013.07.036.
[22] D. Villeger, A. Costes, B. Watier, P. Moretto, An algorithm to decompose ground reaction forces and moments from a single force platform in walking gait, Med. Eng. Phys. 36 (2014) 1530–1535. doi:10.1016/j.medengphy.2014.08.002.
[23] J.A. Zeni, J.G. Richards, J.S. Higginson, Two simple methods for determining gait events during treadmill and overground walking using kinematic data, Gait Posture. 27 (2008) 710–714. doi:10.1016/j.gaitpost.2007.07.007.
[24] C.M. O’Connor, S.K. Thorpe, M.J. O’Malley, C.L. Vaughan, Automatic detection of gait events using kinematic data, Gait Posture. 25 (2007) 469–474. doi:10.1016/j.gaitpost.2006.05.016.
[25] J.K.D. Witt, Determination of toe-off event time during treadmill locomotion using kinematic data, J. Biomech. 43 (2010) 3067–3069. doi:10.1016/j.jbiomech.2010.07.009. [26] R.M. Kiss, Comparison between kinematic and ground reaction force techniques for
determining gait events during treadmill walking at different walking speeds, Med. Eng. Phys. 32 (2010) 662–667. doi:10.1016/j.medengphy.2010.02.012.
[27] M. Rio, F. Colas, M. Andries, F. Charpillet, Probabilistic sensor data processing for robot localization on load-sensing floors, in: 2016. https://hal.inria.fr/hal-01274696/document (accessed May 15, 2016).
[28] M. Andries, Object and human tracking, and robot control through a load sensing floor, phdthesis, Université de Lorraine, 2015. https://hal.inria.fr/tel-01252938/document (accessed May 13, 2016).
[29] U. Lugrís, J. Carlín, R. Pàmies-Vilà, J.M. Font-Llagunes, J. Cuadrado, Solution methods for the double-support indeterminacy in human gait, Multibody Syst. Dyn. 30 (2013) 247–263. doi:10.1007/s11044-013-9363-x.
CHAPTER 5
METHODS
Complementarily to the method described in the paper (chapter 5), this chapter aims to present the methodology of the project precisely.
5.1 Experiments
5.1.1 Participants
To validate the proposed method on the subjects, experimental data were gathered. An experimental protocol for gait data acquisition in adults was defined and approved by the ethics committee of the Sainte-Justine Hospital Research Center.
33 healthy adults volunteered to participate in this project. Exclusion criteria for the participants with typical development were flatfoot, known orthopedic surgical and injuries during the last 2 years on the lower limb. The trials of 3 subjects were rejected. Two ones due to their unusual gait patterns, i.e. their toes landed before their hills and one because of having difficulty in achieving valid cycles, with both feet inside the force platforms. The final 30 participants had a mean age of 24.8 (SD: 3.1) years, ranged 20-34, consisting of 17 males and a mean weight of 70.6 (SD: 11.4) kg. The participants of the current study would be considered as a control group in the future studies on the clinical population. Thus the number of 30 individuals can be justified as a sufficient number for a control group.
5.1.2 Equipment set-up
Kinematics and kinetics: The process of collecting participant data was carried out in the motion laboratory of research Centre of Marie-Enfant rehabilitation center, equipped by a 3D motion capture system composed of 12 T40S cameras (Vicon, UK) cadenced at 100Hz and by three separate FPFs 50 x 50 cm2) (AMTI, USA) embedded in the floor to record ground reaction forces at a frequency of 1000Hz (Figure 4.1). 33 reflective markers placed over several anatomic landmarks according to the full body plug in gait kinematic model were tracked (Figure 4.2).
Figure 5.2: A participant performing the experiment
5.1.3 Procedure of data collection
The experimental procedure was explained for each participant and all participants provided written consent prior to test that has been approved by the ethics committee of the Sainte-Justine Hospital Research Center. The participants were asked to walk naturally barefoot at their own preferred pace, looking straight ahead without targeting their steps to obtain the valid cycles on the platforms. [7]. The trials with both steps inside the force platforms were used for this study. The motive behind this design was to easily record forces during untargeted stances in the walkway, enabling us to obtain independent left-right GRF. The recorded GRF during SS before and after DS were exported to be used in proposed method. To remove the noise, a low-pass filter with a 4th order Butterworth using 4Hz cut-off frequency was applied to the GRF.
5.1.4 Computed parameters and GRF decomposition procedure
The proposed method focuses on optimizing mathematical functions and GRF along each axis. For this purpose, the behavior of geometric curve pattern of the experimental GRF of 30 subjects including in the research project during DS, were compared with the typical behavior of different
![Figure 1.1: Gait cycle phases [10]](https://thumb-eu.123doks.com/thumbv2/123doknet/2347251.35195/17.918.107.804.140.450/figure-gait-cycle-phases.webp)
![Figure 2.1: Temporal summation of left and right GRF profiles for successive steps [8]](https://thumb-eu.123doks.com/thumbv2/123doknet/2347251.35195/20.918.150.758.310.742/figure-temporal-summation-left-right-profiles-successive-steps.webp)