Publisher’s version / Version de l'éditeur:
Vous avez des questions? Nous pouvons vous aider. Pour communiquer directement avec un auteur, consultez la première page de la revue dans laquelle son article a été publié afin de trouver ses coordonnées. Si vous n’arrivez pas à les repérer, communiquez avec nous à PublicationsArchive-ArchivesPublications@nrc-cnrc.gc.ca.
Questions? Contact the NRC Publications Archive team at
PublicationsArchive-ArchivesPublications@nrc-cnrc.gc.ca. If you wish to email the authors directly, please see the first page of the publication for their contact information.
https://publications-cnrc.canada.ca/fra/droits
L’accès à ce site Web et l’utilisation de son contenu sont assujettis aux conditions présentées dans le site
LISEZ CES CONDITIONS ATTENTIVEMENT AVANT D’UTILISER CE SITE WEB.
Laboratory Report (National Research Council of Canada. National Aeronautical Establishment); no. LR-207, 1957-09
READ THESE TERMS AND CONDITIONS CAREFULLY BEFORE USING THIS WEBSITE. https://nrc-publications.canada.ca/eng/copyright
NRC Publications Archive Record / Notice des Archives des publications du CNRC : https://nrc-publications.canada.ca/eng/view/object/?id=2a5dd6c8-c6bf-49b8-a3bc-f315ad14b830 https://publications-cnrc.canada.ca/fra/voir/objet/?id=2a5dd6c8-c6bf-49b8-a3bc-f315ad14b830 For the publisher’s version, please access the DOI link below./ Pour consulter la version de l’éditeur, utilisez le lien DOI ci-dessous.
https://doi.org/10.4224/23004218
Access and use of this website and the material on it are subject to the Terms and Conditions set forth at
Preliminary wind tunnel test of a lifting fan in a two-dimensional
aerofoil
l- M \10NWEALTH AOVl~ORY AERONAUTICAL RESEARCH COUNCIL.
.'
cc
391
COPY N.9, (
NATIONAL AERONAUTICAL ESTABLISHMENT CANADA
LABORATORY REPORT LR-207
PRELIMINARY WIND TUNNEL TESTS OF A LIFTING
FAN IN A TWO- DIMENSIONAL AEROFOIL
BY
R. L. WARDLAW AND R. J. TEMPLIN
OTTAWA SEPTEMBER 1957
THIS REPORT IIAY NOT IE l'UILIIHED IN WHOLE OR IN l'ART WITHOUT THE WRlff!N CONSENT OP THE
NATIONAL AERONAUTICAL ESTAILIIHll!NT
tin'ONAL
RESEARCH GOUICll
8EP
so
gj/UPLANDS UBRAllY
LABORATORY REPORT
Aerodynamics Section
Pages - Preface - 3 Laboratory Report: LR-207 Date: September 1957 Text - 4
App. - 4 Lab. Order: NAE-446
Figures - 9 File: CM2-l 7-13T-6 For: Subject : Prepared by: Submitted by: Approved by : SUMMARY Internal
PRELIMINARY WIND TUNNEL TESTS OF A LIFTING FAN IN A TWO-DIMENSIONAL AEROFOIL
R. L. Wardlaw and R. J. Templin P. J. Pocock
Head
Low Speed Aerodynamics Laboratory R. J. Templin
Head
Aerodynamics Section D. C. MacPhail
Director
The required lift for VTOL aircraft can be generated by lifting fans mounted in the aircraft wing with their axes normal to the wing chord- plane. This report outlines preliminary wind tunnel tests done with a two-dimensional aerofoil with a single fan mounted in the wing. The results indicate that the highest lift increments due to the fan occur at high speeds, and that there is a minimum increment at small forward speeds. The drag increment due to the fan increases rapidly with increasing speed. The pitching moment increment has a maximum at low forward speeds, and the centre of pressure of the fan lift shifts forward of the wing leading edge at these speeds. A simple momentum theory is developed which provides reasonable agreement with the test results at low speeds. The use of fan outlet guide vanes to reduce drag is discussed, and the results of one test are presented.
1. 2. 3. 4. 5. Page - (ii) LR-207 TABLE OF CONTENTS Page Summary (i)
List of Symbols (iii)
Introduction 1
Model fustallation · 1
Tunnel Tests 2
Results and Discussion 2
Conclusions 3
Appendix A : Incomplete Data for Outlet Vane Tests
Appendix B: Note on Prediction of Fan Drag from Simple Momentum Theory
List of Illustrations
Wind Tunnel Installation of Lifting Fan in Two-Dimensional Aerofoil
Lift vs. Angle of Attack (Smooth Aerofoil)
Drag and Pitching Moment vs . Lift (Smooth Aerofoil) Lift Increment Due to Fan
Drag Increment Due to Fan
Chordwise Centre of Pressure of Fan Lift Relative to Fan Centre Line
Effect of 30-degree Outlet Vanes on Lift
Effect of 30-degree Outlet Vanes on Drag and Pitching Moment
Comparison of Wind Tunnel Results with Simple Momentum Drag Theory Figure 1 2 3 4 5 6 7 8 9
...
Af C \ CD CL cm D L m M q Re
s
VvJ
w
a µ p I LIST OF SYMBOLSFan annulus area, ft~ Aerofoil chord, ft.
Smooth aerofoil drag coefficient = -D
qS Smooth aerofoil lift coefficient
=
セ@
Smooth aerofoil pitching moment coefficient Aerodynamic drag, lb .
Aerodynamic lift, lb . Fan mass flow, slugs/sec. Pitching moment , ft. lb . Dynamic pressure, lb. /ft~ Reynolds number, Vcp
µ
Aerofoil area, ft~
=
span x chord Flight velocity, ft . /sec.Fan jet velocity , ft. /sec. Aircraft weight, lb.
Aerofoil angle of attack, degrees
Absolute viscosity of air, slugs/sec. ft. Air density, slugs/ft~
M
=
qSc1
Page - 1 LR-207
PRELIMINARY WIND TUNNEL TESTS OF A LIFTING FAN IN A TWO-DIMENSIONAL AEROFOIL
1. INTRODUCTION
Any VTOL aircraft must be able to produce a large lifting force at zero and low forward speeds. One proposed method of generating this lift is to install fans in the wing with their axes normal to the wing chord-plane so that the fan jet
is directed vertically downwards. As forward speed increases, this jet may be deflected rearwards by outlet vanes and at some higher speed closed off completely, at which point the aircraft can move forward in a conventional manner.
Considerable experimental data are required before development work on such an aircraft can proceed. The tests described in this report were designed to provide aerodynamic data for a thick two-dimensional aerofoil with a single fan mounted with its axis normal to the aerofoil chord-plane .
Since "transition" from vertical to horizontal flight was of interest, the tests were done at low speeds and at low angles of attack. Lift, drag, and pitching moment were measured.
The tests were intended to be preliminary in nature; because of this and the fact that only two days tunnel testing time were available, only vecy basic data were obtained. Some of the tests could not be completed and the. results , being in-conclusive, are included in Appendix A.
The fan itself was designed by the Gas Dynamics Laboratory, and the fan drive and wing installation were designed by the Engine Laboratocy. The
aero-dynamic tests were conducted by the Aeroaero-dynamics Section.
2 . MODEL INSTALLATION
The model is shown in Figure 1 installed in the N. A. E . No . 3 Wind Tunnel. An NACA 0018 aerofoil was used, with a chord of 2 ft. and a span of 5. 69 ft. A thick aerofoil was selected as being typical of the low speed trans-port type aircraft which might take advantage of VTOL principles. A symmetrical aerofoil was used because of the preliminary nature of the tests.
An 18-blade fan was used, having a tip diameter of 7. 5 in., and a root diameter of 4. 5 in. Immediately beneath the fan there was a stage of stator blading with the blade trailing edges flush with the lower ·surface of the aerofoil. A faired bell-mouth type fan inlet was provided and this had provision for attaching inlet guide vanes which protruded into the airstream. The setting of these vanes was fixed at an angle of 50 degrees to the oncoming airstream. One test was done with outlet guide vanes which were at an angle of 30 degrees to the windstream so that
the fan jet was deflected rearwards. The fan was mounted at the 30 percent chord point and 1. 83 ft. from one end of the aerofoil.
The fan drive consisted of shafts supported by ball bearings and connected by a pair of mitre gears to a 6 h. p.motor mounted inside the wing. The motor was a jacketed water-cooled three-phase induction motor, and was powered by the labora-tory variable frequency three-phase power supply.
The wind tunnel working section is a modified ellipse having dimensions 10 ft . x 5. 7 ft. The centre of resolution of the balance system is directly above the balance support point . The model mounting support point was at 30 percent chord.
3. TUNNEL TESTS
All test runs were done at a fan r.p.m. of 15 , 000,. except two data points at a speed of 12,000 r.p.m. Lift , drag, and pitching moments were measured in all force tests. Since the model is two-dimensional and has a floor and ceiling support, the reactions due to lift and drag are shared by the two supports, but the balance system only responds to the reaction at the floor. For the aerofoil without fan (i.e., with fan hole covered z smooth aerofoil), symmetry was assumed and balance lift and drag measurements were multiplied by two. Since the fan was asymmetric for power-on tests the model was tested upright and inverted, and the results added .
The following tests were conducted:
2
(1) smooth aerofoil, q = 10 lb. /ft., a= -5 to +25 degrees
2
(2) smooth aerofoil, q
=
40 lb. /ft., a= -5 to +25 degrees(3) power on, no guide vanes , a = +5 degrees , q
=
0 to 40 lb. /ft~(4) power on, no guide vanes, a = 0 degrees, q = 0 to 40 lb. /ft~
(5) power on, no guide vanes, a= -5 degrees, q
=
0 to 40 lb. /ft~(6) power on, 50-degree inlet guide vanes, a= 0 degrees, q
=
0 to 40 lb./ft~
(7) power on, 50-degree inlet vanes and 30-degree outlet vanes, a = 0 degrees ,
q = 0 to 40 lb. /ft~
(8) flow visualization studies using wool tufts. 4. RESULTS AND DISCUSSION
Page - 3 LR-207 were not reduced to a coefficient form because no rational form could be conceived that would permit the results to be directly comparable to the smooth aerofoil data. No jet boundary interference corrections were made, since , at present, no rational method has been developed that is applicable to tests where a jet is directed normal to the main airstream.
Since test 7 was not done in both upright and inverted positions, the data are not presented in the main body of the report , but are contained together with some discussion in Appendix A.
The smooth aerofoil data are presented in Figure 2 as a CL versus a
curve and in Figure 3 as curves of CD versus CL and Cm / versus CL· The lift and
C 4
drag data for the power-on tests are plotted in Figures 4 and 5 as increments of lift and drag due to the fan, as a function of tunnel dynamic pressure.
The pitching moment data indicated a forward movement of the centre of pressure that is a function of velocity. Figure 6 is a plot of the chordwise posi-tion of the centre of pressure of the fan lift as a funcposi-tion of dynamic pressure. It will be noted that for dynamic pressures in the order of 5 lb.
/ft?
the centre of pressure of the fan lift moves forward of the wing leading edge.Since the smooth aerofoil was tested at only two tunnel speeds the aero-dynamic data had to be calculated on a basis of these two speeds. It will be seen that the coefficients presented in Figures 2 and 3 are not significantly dependent on
velocity. Therefore, a linear variation with dynamic pressure was assumed.
In the curves of Figures 4, 5 and 6 there are several break points or sharp changes in curvature. These effects cannot be accounted for by limited accuracy of the tunnel balance , so that it is concluded that these are real aero-dynamic effects which possibly indicate that in the neighbourhood of the fan there are several different flow regimes. However, the wool tuft studies were inconclusive
in clarifying this phenomenon but more extensive flow visualization studies or pres-sure meapres-surements might be of help here.
From Figure 5 and the discussion of Appendix B it is apparent that there is a large drag increment due to the fan . This increment, however, can be reduced by the use of outlet vanes deflecting the. jet rearwards. Test 7 was designed with
this in mind but time did not permit completion of this test, and, in addition, a more thorough programme involving outlet vanes set at different angles would be required to provide sufficient data . Test 7 is discussed in Appendix A.
The two data points for r. p. m. = 12, 000 are not adequate to draw any definite conclusions but could be of value from the standpoint of fan design. 5 . CONCLUSIONS
testing time available, some broad conclusions can be reached; and, in addition, the tests do serve as a guide to the most profitable avenues of research for future
tests.
(1) There is a large drag increment due to the fan which increases rapidly with velocity. This increment could be reduced by using outlet vanes to deflect the fan jet rearwards. The data from Appendix A (Fig. 8), although inconclusive, indicate that the drag increment can be significantly reduced with large jet deflec-tions, and, in fact, at low speeds some net forward thrust might be obtained. It must be remembered that when using outlet vanes a large loss of lift will also be incurred, which seriously limits the permissible deflection angle and thereby the drag reduction. It is apparent that before vanes of this sort could be considered, further careful study is required.
(2) Although a larger lift increment is obtained in the high range of velocity it is important to note that a minimum lift occurs at a dynamic pressure of approxi-mately 3 lb. /ft? Thus, in transition flight one is faced with a large increase in drag and some loss of lift at low speeds. At the higher speeds where a favourable lift increment is available but also a large drag increment, it is possible that an air-craft would be already flying in a conventional manner. More emphasis should be placed on determining the wind tunnel speed range which would represent transition flight of a typical fan lift aircraft.
(3) There is a large pitching moment increment and fan lift centre of pres-sure shift which has a maximum at about 6 lb. /ft? dynamic prespres-sure; the centre of pressure at this speed is ahead of the leading edge by 20 percent chord. This phenomenon could be investigated by further flow visualization studies or pressure measurements near the fan.
(4) The aerofoil angle of attack has a marked effect on the forces, and the pitching moment. The decrease of lift and drag increments with increasing angle of attack as well as the increase of pitching moment with angle of attack should be noted.
(5) The influence of fan r.p.m. has not been closely studied and this factor could be of importance, particularly at high velocity where more than adequate lift is available and a reduction of r. p. m. could be realized.
(6) As mentioned in Section 4, it is possible that there are different flow regimes at different speeds. Flow visualization and pressure measurements could clarify this.
(7) It must be remembered that throughout this report no allowance has been made for jet boundary interference. There is no doubt that this factor is important, and that the value of these data would be increased if corrections were made. Some consideration should be given to this problem.
•
APPENDIX A
INCOMPLETE DATA FOR OUTLET VANE TESTS
A. 1 Introduction
Page - A-1 LR-207
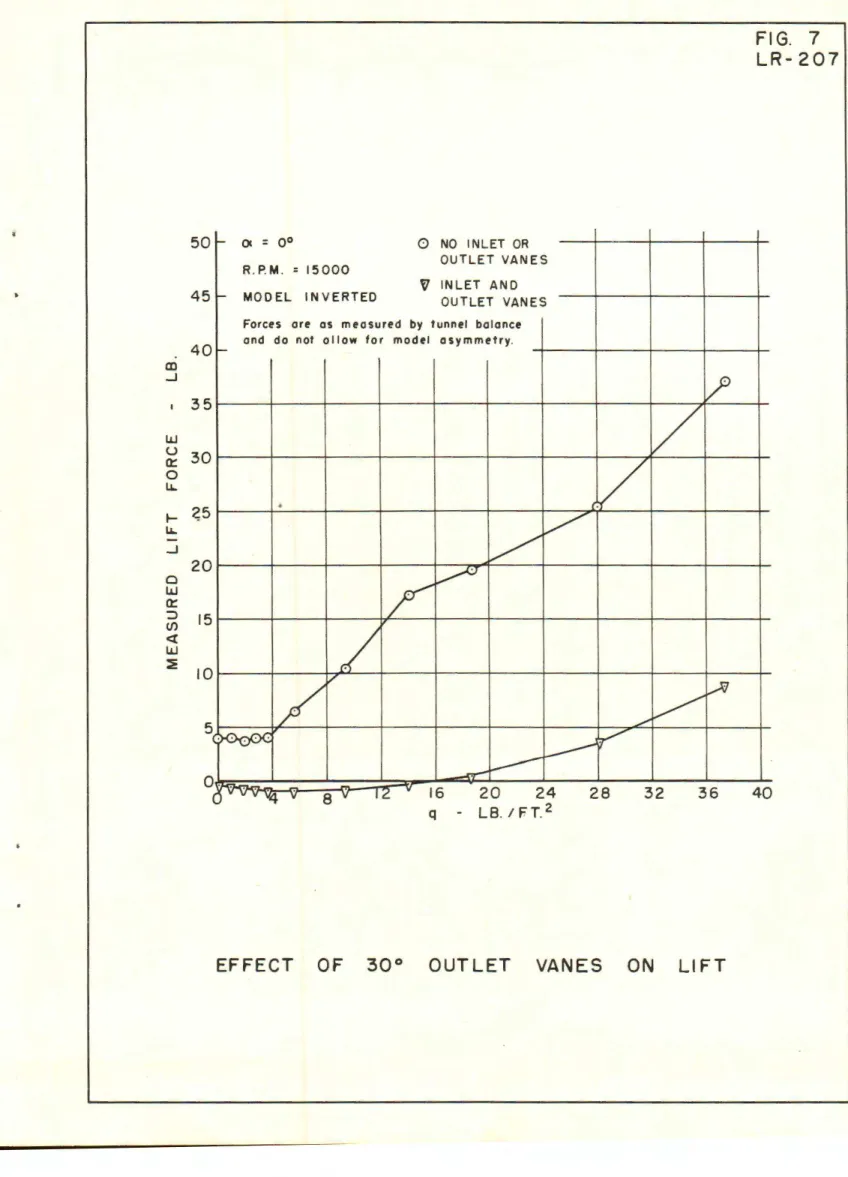
As pointed out in the main body of this report, there could be a need for deflecting the fan jet with outlet vanes. A set of such vanes set at an angle of 30 degrees to the aerofoil chord, so that they deflected the jet rearwards, was installed. Due to limited testing time, they could only be tested with the model in the inverted position, with the fan located near the tunnel ceiling (see Section 3). As a consequence of the asymmetric location of the fan, the results cannot be inter-preted in terms of quantitative force measurements: However, the data can be compared to data from inverted runs without vanes so that some qualitative indica-tion of their effect can be obtained.
A. 2 Test Results
Force measurements of lift, drag, and pitching moment with inlet and outlet vanes installed were made and the measurements are shown in Figures 7 and 8, and are compared to corresponding inverted data for the "power on" case with no guide vanes. These data show a significant reduction in drag, lift, and pitching moment. It can be seen that at low speeds one can achieve a net forward thrust due to the fan, but, at the same speeds, the lift increment due to the fan is very small.
•
APPENDIX B
NOTE ON PREDICTION OF FAN DRAG FROM SIMPLE MOMENTUM THEORY
B . 1 Introduction
The fan-aerofoil model for which wind tunnel test results are discussed in this report did not necessarily represent a practical design configuration . There-fore, in order to make use of the results in project studies of lifting fan aircraft it is desirable that they be compared with some reasonably simple theory. The theory need only be capable of predicting the fan drag increment as a function of fan lift and forward speed, since the ne cessary ranges of these latter quantities would be specified in a design study. The purpose of this appendix is to compare the
pre-liminary wind tunnel results with a simple momentum drag theory.
B . 2 Simple Theory
Suppose that the outlet jet from the fan is not bent by the main airstream past the aerofoil and that the outlet momentum flux is therefore directed at right angles to the aerofoil chord. The resultant force due to the fan on the fan-aerofoil
combination is then the vector difference between the inlet momentum m V and the outlet momentum mVj, where m is the fan mass flow, V is the flight (or tunnel) velocity, and V j is the fan jet velocity. If the resultant force is resolved into components AL at right angles to the flow direction and AD parallel to the flow direction, it can be shown from a vector diagram that
~DL = ~an a+ V
l,.l. V. cos a
J
(1)
where a is the aerofoil angle of attack.
For reasonably small angles of attack this expression can be approximated to
(2)
if a is in degree units.
To the same degree of approximation the fan lift component is
Page - B-2
LR-207
and if incompressible flow is assumed,
h 1 v2 w ere q
=
~P Hence or (4) (5) (6)If experimental results indicate that equation (6) is reasonably accurate, it can be used to predict fan drag as a function of fan lift, flight speed, and angle of attack.
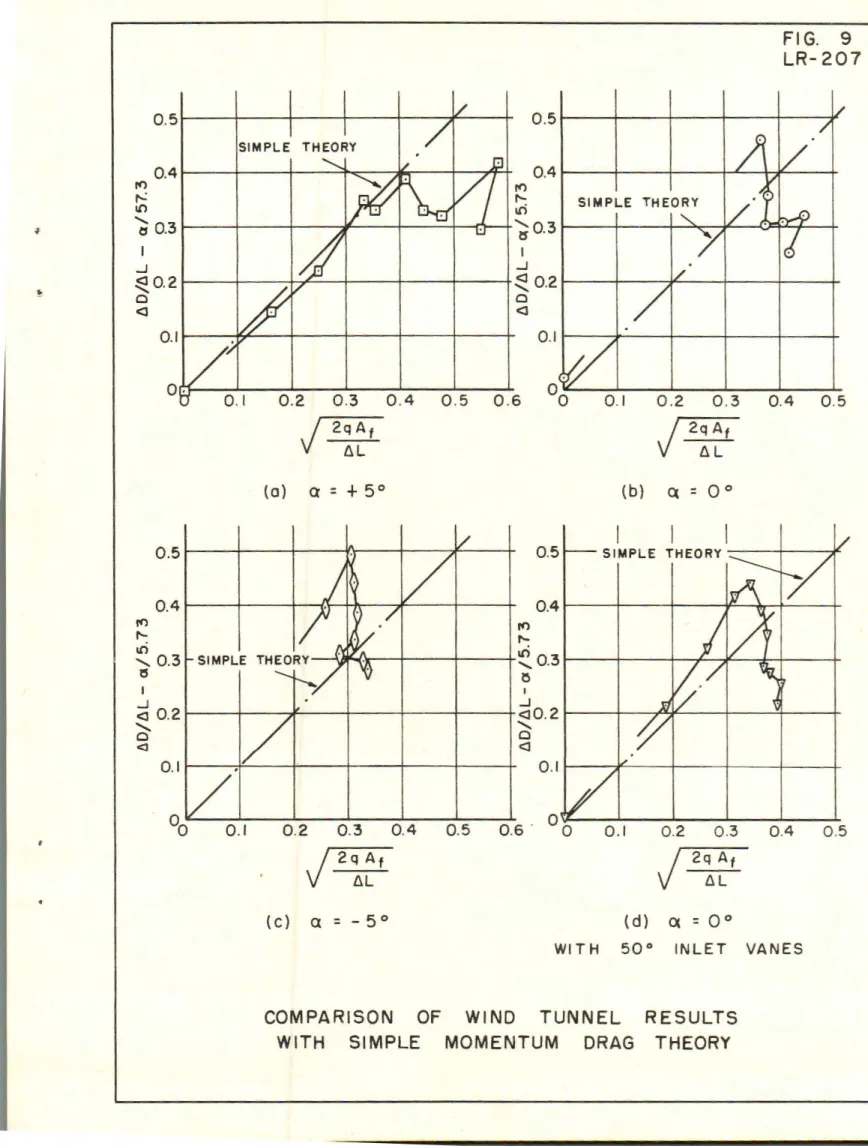
B. 3 Comparison with Experiment
Using the results of wind tunnel tests on the fan-aerofoil model described in the body of this report, the experimental values of the left-hand side and the right-hand side of equation (6) have been calculated and are plotted in Figure 9 for compari-son with the simple theory. All of the data in Figure 9 refer to a fan speed of
15, 000 r. p . m . The fan area used in the calculation was taken to be the fan annulus area.
The comparison between experiment and simple theory can be described as only fair . There is some indication, however, that for zero and for positive wing angles of attack the simple theory gives reasonably accurate values of fan drag for low values of the parameter
J
2
: : f , which is theoretically equal to the ratio of air speed to fan jet speed. It is not surprising that at high values of this ratio the simple theory fails, because it is based on the assumption that the fan jet is not bent by the main airstream past the aerofoil. It would be expected that, at high forward speeds, the jet would be bent to some degree before complete mixing with the surrounding airstream takes place and therefore that the drag would fall below the value predicted by the crude theory. In fact, this does appear to occur
rather suddenly for values of V /Vj between about 0. 3 and 0. 4. Figure 9 also indicates that immediately before the sudden drop in drag-lift ratio , the theory underestimates the drag in most cases. This may be due to interaction between the fan flow and the flow over the remainder of the aerofoil, but the very short series of tests so far completed did not permit further· investigation.
B . 4 Conclusion
It appears that the crude momentum theory discussed in this Appendix can be used to predict with fair accuracy the momentum drag of a lifting fan installa-tion provided that the flight speed is not greater than about 30 percent of the fan outlet jet speed .
The main implication of this simple theory is that high momentum drag can be expected on a fan-lift aircraft during transition from hovering to cruising flight. For example, suppose it is assumed that the total weight of the aircraft is supported by the fans until a flight speed is reached at which it becomes possi ble to support the aircraft weight entirely on the wing at a lift coefficient of, say I. 0 . Fo·r a wing loading of 50 lb. /sq. ft . , the flight dynamic pressure at the "fan unloading" speed would also be 50 lb . /sq. ft . It may be assumed also that the total fan area would be of the order of 10 percent of the wing area and therefore that the fan load-ing is 500 lb. /sq. ft.
Equation (6) can be used to calculate the ratio of fan drag to aircraft weight by setting a = 0 and ~L
=
W. For q=
50 (V=
140 m. p . h. ) , the result is~D
=
fi'oo
=
0 45w
,Jsoo
·
It is therefore concluded that a useful area for further research would lie in finding ways to reduce fan drag. An obvious first step would be to investigate
variable outlet vanes to direct the fan jet rearward . In the present experiment only
one set of tentative measurements was made using outlet vanes. The results are given in Appendix A and are rather inconclusive, due partly to the experimental set-up, and partly to the fact that the vane angle (30 degrees to the wing chord) was so flat that the fan flow was largely choked off. Nevertheless, at"low tunnel speeds a fan thrust was obtained.
UPPER SURFACE
WIND TUNNEL INSTALLATION OF LIFTING FAN IN
LOWER SURFACE TWO-DIMENSIONAL AEROFOIL
r.,,
::0 G) I • N _ 0 セ@1. 1 1.0 0 .9 0 .8 0 .7 0 .6 0 .5 0.4 0 .3 0 .2 0 .1 -4 -2 I ) ., - ~ . I 1 ·,-0.2 セ@ -0.3 ·) - 0.4
f
- 0. 5 0 ·> Q,.
-...
A \'} 1.;.) '~ C:. 4:1. A j~ ,) I· 1·)...
0 I!!, V = 178 FT./SEC. I セ@ Re = 2. 27 XI 01 0 V: 88. 9 FT./SEC. () Re: 1.14 X (QI '~ @ 2 4 6 8 10 12 14 16 18 20LIFT VS. ANGLE OF ATTACK
WITH FAN INLET AND OUTLET CO V E RE D
1.1 r.,
22
I· 0
-oA
---+---,1-0.0 4 ---+---+--+---+----t--ro
.
セ@ セ@
ooioA)A,ib~~u.oz·+----+--+---
---+---0.4 - 0 .2 0 0 .2 0.4 0 .6 0 .8 Cmc/ 4 t r0 . 0 5 + + + + -- ---+---+ -0.o
5 ----+---+ - 0 .I O +---+-- - - - + ---+----+---t--DRAG AND PITCHING MOMENT VS . L I FT
WITH FAN INLET AND OU T LE T COV ERE D
FIG. 3
140 130 120 110 . 100 CD ...J 90 o 80 1-w セ@ 70 1-z w 60
:e
w a:: u 2 50 1-u... :::i 40 30 20- o
0- 0
V --- f!j,s>
NO VANES, Cl = +5, R.P.M. = 15000I
NO VANES, (X : o. R.P.M. : 15000 NO VANES, a = -5, R.P.M. : 15000 V 50° INLET VANES, a = o. R.P.M. : 15000I
NO VANES, (X : 0, R.P.M. : 12000)v
Cit : - 5°/
;;"
/
I
y
,/ /
p - a : oo /y
セ@
·o•-!
V
V
I
I
I
/I
I
/ /
V
I I:/
/ /セ@
v
I
セ@
ll
Ij
/
v·
セ@
V
V
r---..a: :
+-5 0 .FL / / --E(l-,1T
>--<
V
iaQ:i.
~ -
.ill A 10 セ@ I·~ 4 8 16 20 21 q - LB. / FT. 32 40 12 28 363 2 30
..._.. o
0 2 8 ' - 0 V 2 6 - ~ 4 2 2 0 ~I 8 w :::, 0 16 14 1-z w :E w a:: u z -1 (!) <l a:: 01 2 0 8 6 NO VANES, (l : + 5, R.P.M. : 15000 NO VANES , (l : 0, R.P.M . : 15000 NO VANES, (l : -5 , R.P.M. : 15000 50° INLET VAN ES, (l :o.
R.P.M. : 15000NO VANES , a = o, R.P.M . : 12000
/
/
//
/
A
(l : -5~セ@
'/1
/v
ex = C°C::::::--I~
セ@
// '
;I
/
/
J
U"".V
r
v ~
/
if/
/
!1
:7
/
/...____
"-(l : + 50 /j
セ@
/
セ@
l?
(: V/ 4i
oi
A V 2 l rO -a 0 4 8 12 16 20 24 q - LB. / FT.2 28 32DRAG I NC REM ENT DUE TO FAN
36 40
FIG . 5
0.6 z z セ@ ci0.5 i... ~...J
-lu
t;:
0 .4 ::J u.. o 0 .3 w a:: => (/) (/) w a:: Q.. u.. 0 w a:: セ@z w 0 .2 u 0.1 1 I· c.J 0 0I
I
I
I
I
I
I
I
I
I
0 NO VANES, a = +5, R.P.M. : 15000 0 NO VANES, ex =o.
R.P.M . : 1.5000 0 NO VANES, ex = -5, R.P.M. : 15000V 50° INLET VAN ES, ex =
o.
R.P.M . : 15000セ@
8 NO VANES, ex =o.
R.P.M. : 12000i\
};
\\
I\_
/
/
セ@
...- a = + 5° ~ -> ~--a
~
'
AEROFO IL LEADING EDGE POSITIONI
\\-
-
I
y
~ '
\
セ@
_r.,. ~ ex =o
0 セ@ ...--セ@
セ@ >'r--.,.
... セ@セ@
---~
セ@
セ@l"0
セ@:---...
-
---...'I,._ V\
V ex = -50 4 8 12 16 20 24 28 32 36 q - LB./ FT.2CHOROWISE CENTRE OF PRESSURE OF FAN LIFT RELATIVE TO FAN CENTRE LINE
-
-
50 45 40 I 35 w セ@ 30 0 セ@ 20 15 10 5 0
-
()I =oo
0 NO INLET OR R. P. M. = 15000 OUTLET VANES V INLET ANO-
MODEL INVERTED OUTLET VANESForcts are as measured by tunnel balance and do not allow for model asymmetry.
セ@
v
V
•.V
V
セ@
セ@
セ@ II'/
Vl.,-J1
/
. //
-~ セ@y
----...c,r-" ·,:w-;Y4 -,-8 IZ " 16 20 24 28 32 36 q - LB. I FT. 2EFFECT OF 30° OUTLET VANES ON LIFT
FIG. 7 LR-207
cri _J 0 w Cl: ::::> (/) 10 8 6 4 2 I •
/
セ@/ '
セ@
_ /..
, /
.fi
~v
-~
/
/
セ@セ@
.J/
セ@
/
/
セ@セ@
.,... V <l 0 wセ@
12 16 20 24 28 32 36/ '
, _,.;'V セ@ -2 -4()( : oo
-6 - R.P.M . : 15000cri MODEL INVERTED
q
-
LB.I FT. 2 0 NO INLET OR OUTLET VANES VJ INLET AND OUTLET VANES 40 _Jt
30 Forcu o" os measu"d by tunnel balance ~ - - - 1 , - - - 1 - - - 4 -- ----i~and do not allow for model asymmetry.
25 セ@
z
w セ@ 20 0 セ@ (!) 15z
:I: u セ@ 10 a.. 0 w er 5 ::::> (/) <lO·
w セ@ 4 8 12 16 20 24 28 32 36 40 q LB. / FT20 .5 0.4 rt) r--: IO ... e, 0.3 ...J
..
~0.2 0 <] 0 .1 0 .5 0.4 ro I'-IO , 0 .3 '5 I ...J <l 0 .2 ... 0 <I 0 .1 0 . 1,
0 .5 0.4 rt) I'-I() ~0.3 I ...J ~0.2 0 <] 0 .1 00 0 . 1 0 .2 0 . 3j
2q Atj
2QAf AL AL (a) Q=
+
50 (b) C(=
oo
0 .5 SIMPLE THEORY 0 .4 rt) セ@ IO , o.3 セ@ I ...J <J0.2 ... 0 <] 0 .1 0 .2 0 .3 0.4 0 .5 0 .6 0 0 0. 1 0 .2 0.3J
2q AtJ
2 q At AL AL (C)a
=
- 5 0 (d) C(=
oo
WI TH 50° INLETCOMPARISON OF WIND TUNNEL RESULTS WITH SIMPLE MOMENTUM DRAG THEORY
FIG. 9 LR-207
0.4 0 .5
0 .4 0.5


![[PDF] Cours Algorithmique et Programmation Ada en pdf | Formation informatique](data:image/gif;base64,R0lGODlhAQABAIAAAP///wAAACH5BAEAAAAALAAAAAABAAEAAAICRAEAOw==)