THE CONSUMER PRODUCT DIRECT MARKETING INDUSTRY: ITS SIZE, GROWTH, AND SHARE OF THE U.S. RETAIL TRADE MARKET
by
ROBERTO EMIDIO ARISTA M.B.A., Boston College, 1989
B.S., Civil Engineering, Northeastern University, 1981 Submitted to the Department of Urban Studies and Planning
in partial Fulfillment of the Requirement for the Degree of MASTER IN SCIENCE
in Real Estate Development at the
MASSACHUSETTS INSTITUTE OF TECHNOLOGY September, 1996
@ 1996 Roberto Emidio Arista All Rights Reserved
The author grants to MIT permission to reproduce and to distribute publicly paper and electronic copies of this thesis document in whole or in part.
Signature of Author.
Roberto Emidio Arista Department of Urban Studies and Planning August 6, 1996
Certified by
Accepted b
Professor William C. Wheaton Professor of Economics
Professor William C. Wheaton Chair, Interdepartmental Degree program in Real Estate Development
MASSACHUSETTS INSTITUTE OF TECHNOLOGY
SEP 16 1996
Rotch~" Using a credit card through the Internet is still not entirely safe. In today's electronic
shopping environment, consumers' charge card numbers are exposed to intruding strangers who could steal them and use them at will.
" In a recent survey by the ICSC Research Quarterly, 43% of respondents indicated that they were very concerned about their right to privacy when using the information superhighway. Only 12% said that they were not concerned. These opinions indicate that consumers still have a strong reluctance to shopping on-line0.
* Some have likened the Internet to the Wild West, calling it the "wide open frontier for commercial and legal use"11. Since very little precedent exists for conducting business in cyberspace, new obstacles such as copyright and trademark infringement, ownership of material, dependability of service, etc. will surface as this industry evolves.
* Some have estimated that on-line sales were only $350 million in 199512 while others say that figure is $575.5 million". This compares to roughly $120 to $140 billion in total mail order sales14.
In time, many obstacles to shopping on-line are likely to disappear. As today's younger consumers, who are embracing the personal computer as a tool of everyday living, overtake today's older consumers, who are comparatively computer illiterate, dominant behaviors will undoubtedly change. However, this shift is not likely to happen in the near
future.
10
"Information Superhighway", ICSC Research Quarterly, Volume 3, Number 1, Spring 1996, page 30. " Friedman, Neal, Attorney of Pepper & Corazzini, quote attributed to, IntelliSeekfor Business (an Internet Service), May 1996.
1 Nagle Green, Emily and Eichler, Sara H., "Analyzing the Impact of Technology on Consumers", The
Forrester Report, People & Technology, Forrester Research, Inc., May 1995, page 7.
3 Goldgaber, Arthur, "Shopping Meets Net Surfing in Wal-Mart/Microsoft Deal", Discount Store News, February 19, 1996, page 17.
THE CONSUMER PRODUCT DIRECT MARKETING INDUSTRY: ITS SIZE, GROWTH, AND SHARE OF THE U.S. RETAIL TRADE MARKET
by
ROBERTO EMIDIO ARISTA
Submitted to the Department of Urban Studies and Planning on August 6, 1996 in partial fulfillment of the requirement for the Degree of
Master of Science in Real Estate Development
ABSTRACT
It has been commonly perceived that the U.S. direct marketing industry is a rapidly growing one. It is hard not to notice how much is being marketed to consumers through direct marketing. Mail order catalogs are only one prominent example of direct marketing. Their explosion through the eighties is evidence that retailers found an important alternative to selling their wares. Television shopping networks are another example. Their success during the past ten years indicates that this method of direct marketing is here to stay. More recently, commercial on-line services and the Internet are being touted as the next direct marketing frontier.
This thesis attempted to determine the amount of business that consumer product direct marketing generates. Its primary goal was to track the growth of the industry over the past fifteen year period, in total and by major retail sector, and to determine its share of total U.S. retail trade market. Its secondary goal was to infer the impact that it has had and is likely to have on the demand for retail space.
The exact size and growth of the consumer direct marketing industry is difficult to measure precisely due to its complex and dynamic nature. This fact was evidenced by the discrepancies found between the various data sources used in this study. In any case, it could be inferred that today consumer product sales attributed to direct marketing may be in the range of $120 to $140 billion per year. This figure was about $40 billion in 1979 and is expected to be approximately
$175 billion by 2001. The direct marketing share of total retail sales is in the 6%-7% range today, it was approximately 5% in 1979, and is expected to grow to 6.5%-7.5% by 2001. This suggests that although direct marketing's volume of business is growing faster than retail sales as a whole, its growth is not extraordinary. The products which appear to have enjoyed the most success in direct marketing include books, magazines, newspapers, sporting goods, jewelry, stationary, toys and games, camera and photographic equipment, novelties and gifts, flowers, and other
miscellaneous products. Communication technology innovations, such as commercial on-line services and the Internet, and demographic shifts (from computer illiterate to computer literate) are expected to aid direct marketing's future success.
Thesis Supervisor: William C. Wheaton
TABLE OF CONTENTS
ABSTRACT 2
CHAPTER 1 - INTRODUCTION 5
1.1 - THE U.S. DIRECT MARKETING INDUSTRY: A BRIEF OVERVIEW 5
1.2 - PURPOSE OF STUDY 9
1.3 - FRAMEWORK OF ANALYSIS 9
1.4 - CONCLUSIONS 13
CHAPTER 2 - DATA SOURCES AND METHODOLOGIES 16
2.1 - BACKGROUND 16
2.2 -TOTAL U.S. CONSUMER PRODUCT RETAIL SALES 20
2.3 -U.S. CENSUS OF RETAIL TRADE NONSTORE SALES 21
2.4 -MAXWELL SROGE COMPANY SALES ESTIMATES OF THE U.S.
CONSUMER PRODUCT MAIL ORDER INDUSTRY 23
2.5 -DIRECT MARKETING MAGAZINE SALES ESTIMATES OF THE U.S.
CONSUMER PRODUCT MAIL ORDER INDUSTRY 26
2.6 -WEFA SALES ESTIMATES OF THE U.S. CONSUMER PRODUCT
MAIL ORDER INDUSTRY 31
CHAPTER 3 - SIZE AND GROWTH OF THE U.S. MAIL ORDER INDUSTRY 35
3.1 - GROWTH TRENDS OF U.S. CENSUS OF RETAIL TRADE NONSTORE SALES 35
3.2 - GROWTH TRENDS OF U.S. MAIL ORDER INDUSTRY SALES 38
3.3 - CONCLUSION 43
CHAPTER 4 - U.S. DIRECT MARKETING INDUSTRY GROWTH TRENDS BY RETAIL
SECTOR 44
4.1 - METHODOLOGY 44
4.2 - MAXWELL SROGE COMPANY SALES ESTIMATES OF THE U.S.
CONSUMER PRODUCT MAIL ORDER INDUSTRY 44
4.3 -DIRECT MARKETING MAGAZINE SALES ESTIMATES OF THE U.S.
CONSUMER PRODUCT MAIL ORDER INDUSTRY 48
4.4 - WEFA DIRECT ORDER SALES ESTIMATES OF THE U.S. CONSUMER
PRODUCT MAIL ORDER INDUSTRY 51
4.5 - CONCLUSION 54
CHAPTER 5 - CONCLUSION 59
5.1 - WHAT WE HAVE LEARNED FROM THIS ANALYSIS 59
5.2 - OBSTACLES TO DIRECT MARKETING AS A DOMINANT
CONSUMER PRODUCT SHOPPING MODE 60
5.3 - COMMERCIAL ON-LINE SERVICES, THE INTERNET, AND
CD-ROM: THE NEXT DIRECT MARKETING REVOLUTION? 62
TABLE OF CONTENTS (CONTINUED)
APPENDIX 1 - HISTORICAL EsTIMATES OF DIRECT MARKETING SALES 69
APPENDIX 2 - HISTORICAL AND PROJECTED ESTIMATES OF U.S.
CONSUMER PRODUCT RETAIL SALES 71
APPENDIX3 - MAXWELL SROGE COMPANY RESEARCH METHODOLOGY 76
APPENDIX 4 - MAXWELL SROGE COMPANY HISTORICAL AND PROJECTED
ESTIMATES OF THE U.S. MAIL ORDER INDUSTRY 78
APPENDIX 5 - DIRECT MARKETING MAGAZINE RESEARCH METHODOLOGY 82 APPENDIX 6 - DIRECT MARKETING MAGAZINE HISTORICAL ESTIMATES OF
THE U.S. MAIL ORDER INDUSTRY 87
APPENDIX 7 - WEFA RESEARCH METHODOLOGY 91
APPENDIX 8 - WEFA HISTORICAL AND PROJECTED ESTIMATES OF THE
U.S. MAIL ORDER INDUSTRY 96
CHAPTER 1 - INTRODUCTION
1.1 -THE U.S. DIRECT MARKETING INDUSTRY: A BRIEF OvERVIEW
Recognizing that direct marketing is an effective way of capturing new customers, in the past decade U.S. businesses have dramatically increased their investment in direct
marketing techniques. Over this period, direct mail expenditures have increased by 254%1.
On average, businesses today are spending 76% of their marketing budget on direct marketing. About half of Fortune 500 companies are now engaged in some form of direct marketing2. It is estimated that in 1995, fifty-three percent of the population purchased a product or service through mail order and that over 70% of these individuals spent over $100 during the year3. These statistics clearly show why some real estate observers have suggested that the traditional shopping mall may be in trouble.
Direct marketing is not a new way of selling in this country. Some sources trace it back to the days of Benjamin Franklin, the country's first postmaster general. Mail order, which is
only one direct marketing channel of distribution, goes back more than 100 years with Sears and Ward. However, it has only been since the 1950s that researchers and
businesspeople have recognized direct marketing as an important component of retailing.
From its relative obscurity in the late 1800s, direct marketing has achieved widespread acceptance in the contemporary United States. With many women in the work force, time has become a scarce resource for most American families, making, for example, mail order an attractive shopping alternative. Technology continues to play a transforming role in consumers' lives. Credit cards and toll free numbers have made it possible to shop from the convenience of our livingrooms 24 hours a day, 7 days a week. More recently,
personal computers have begun to offer a new channel of communication. Through
1 Direct Marketing Market Place, 1996, page ix.
2 Nash, Edward L., Editor in Chief, The Direct Marketing Handbook, Second Edition, 1992, page xviii.
3 Direct Marketing Market Place, 1996, page ix.
commercial on-line services and the Internet, consumers may shop for goods and services without leaving their homes. Information technology advances are also allowing direct marketers to better know their customers and to successfully target their needs.
According to one source', direct marketing as a marketing technique will continue to advance due to the changing U.S. age distribution and housing and marital status of individuals. As baby boomers age there will be continued opportunity to sell to an age group that earns and spends more but demands high quality and service. The increase in single-parent homes and the need to find time effective ways to shop, present another opportunity to direct marketers. In general, the increasing fragmentation of the market in terms of age and needs creates an ideal environment for direct marketers, who, with their sophisticated marketing methods, are positioning themselves to deal with customers on an individual basis.
The size and growth of the direct marketing industry in number of establishments and sales volume has been measured by many sources over the years. Although there are
inconsistencies in their results, all show that this industry has made solid inroads during the past thirty years.
The consumer product direct marketing industry is not easy to quantify, as it not only includes retailers who engage exclusively in direct marketing, but many others who operate traditional retail stores and also sell through direct channels. In addition, it includes manufacturers who sell directly to consumers. Direct marketing also includes three channels of distribution: mail order, house-to-house selling, and vending machines.
Mail order houses are defined by the Standard Industrial Classification Manual as "retail establishments primarily engaged in selling, by catalog and mail order, dry goods in combination with apparel and accessories, with furniture and home furnishings, with small
hardware, with farmers' supplies, or with automobile equipment"'. As mentioned earlier, this narrow definition excludes all other retailers and manufacturers who are also engaged in direct marketing activities (including selling house-to-house and through vending machines). In any case, the 1958 U.S. Department of Commerce, Census of Business
listed 2,550 mail order houses, doing a volume of business of approximately $2 billion7. According to the 1978 Statistical Abstract of the United States, the number of
establishments classified as mail order houses increased to 8,000 in 1972 while sales rose to $6.8 billion in 19778. More recently, the Statistical Abstract showed that total sales of
mail order houses rose to $10.9 billion in 19829. Although these figures are probably understated by a substantial margin, they indicate that the mail order sales volume increased by an average of 6.7% per year between 1958 and 1977 and by 9.9% per year between 1977 and 1982.
A 1959 study by B. Klein & Company indicated that retail mail order sales in 1958 were approximately $3.5 billion", a figure which is 75% higher than the Census of Business statistic. However, due to the practical impossibility of accounting for every mail order operation, this sales volume too was probably conservative. Total U.S. retail sales for that year were reported to be approximately $199.6 billion. Therefore, in 1958 consumer product mail order sales accounted for approximately 1.75% of all retail sales. Another source estimates that in 1990 consumer mail order sales were $98.2 billion12. These figures indicate that mail order experienced a compound growth of 11% per year between
1958 and 1990 and that its share of the total retail market grew to 5.4% by 1990. (Total U.S. retail sales were $1.826 trillion in 1990).
6Ibid., page 15.
7 Griffin, Harold E. Jr., Mail Order Retailing, Economic Considerations for Small Operators, December
1963, page 14.
8 Simon, Julian L., How to Start and Operate a Mail-Order Business, Third Edition, 1981, page 14. 9 Simon, Julian L., How to Start and Operate a Mail-Order Business, Fifth Edition, 1993, page 19.
'0 Ibid., page 15.
" Ibid., page 15.
Another source estimated that consumer direct marketing sales were $15.2 billion in 1974,
$23.5 billion in 1978, and approximately $44 billion in 198413. This represents an average
increase of 11.5% per year between 1974 and 1978 and 11% per year between 1978 and 1984. In terms of market share, these figures suggest that direct marketing captured a 3.8% share of total retail sales in 1984. (Total retail sales in 1984 were approximately $1.2 trillion).
The growth in number of direct marketing establishments is another way to measure the success of this industry. One source estimated that the number of consumer firms who employed direct marketing techniques (i.e., catalogues, direct mail advertising, telephone orders, etc.) in some aspect of their product marketing grew from an estimated 6,000 in 1974, to 10,000 in 1978, and 11,000 in 1982. By 1984 they were in excess of 12,00014. This represents an average increase of 7% per year over the 1974 to 1984 ten year period. Another source estimates that in 1982, the number of businesses involved in mail order selling were over 13,000. By 1991 that number had grown to nearly 17,00015. This represents a mere average increase of 3% per year between 1982 and 1991, possibly indicating that an industry consolidation was occurring.
Given the differences in statistical methodologies used to develop the various estimates, and the evolving methodologies employed to generate the same estimates, directly
comparing figures and inferring rates of growth is not completely accurate. However, the increase in volume of sales and number of establishments through the years is enough evidence to reasonably conclude that the growth of the U.S. direct marketing industry is worth taking seriously.
13 Sroge, Maxwell, Inside the Leading Mail Order Houses, 1984, page ix.
14
Ibid., page vii.
1.2 -PURPOSE OF STUDY
As a selling venue, consumer product direct marketing theoretically does not require the operator to have to occupy store-front retail space. In this sense, it is easy to understand the direct impact that direct marketing can have on the demand for retail space. In the extreme situation where all transactions occur in a direct marketing fashion (i.e., through mail order, house-to-house selling, and vending machines), there would be no need for retail space at all.
The principal aim of this study was to measure the size and growth of the U.S. consumer product direct marketing industry vis-a-vis the total retail trade market. This was
accomplished by analyzing the industry as a whole and by major retail sector, in the hope of determining which retail sector is most threatened by direct marketing. A secondary aim of this study was to infer the current and future impact of direct marketing on the demand for retail space in the U.S.
1.3 -FRAMEWORK OF ANALYSIS
Although more widely defined as an interactive marketing system16, direct marketing as an industry can be quantified by the volume of sales it accounts for through its three channels of distribution1 7: mail order, house-to-house (personal visit) selling, and vending machines.
As a whole, the direct marketing industry includes the sale of products and services to consumers and to businesses (known as the business-to-business market) as shown in the matrix in Table 1.1.
Table 1.1 -Direct Marketing Market Matrix
Consumer Products Business-to-Business Products
Consumer Services Business-to-Business Services
16 A complete definition may be found in Direct Marketing Magazine, November, 1984 issue, page 31. 17 As outlined by Direct Marketing Magazine in the May, 1996 issue, page 3.
As mentioned earlier, this study analyzed only the consumer product component of this industry, as selling consumer products is an activity which is typically associated with retail real estate. Consumer services were not considered the selling of services is an activity commonly associated with commercial office space. The business-to-business market was also excluded, as business-to-business sales, which do not represent end value products, are not included in the calculation of the national gross domestic product. In addition, product business-to-business sales typically occur at the wholesale level and normally would not affect retail space. However, some business-to-business exchanges are transacted in a retail setting (e.g. a law office that purchases stationary from a nearby store). In this case, since the U.S. retail trade statistics include these retailer-to-business
sales, while the data used in this analysis do not, the resulting market share figures may not be completely accurate. Nevertheless, because it was not feasible to make adjustments for this component of business, achieving more exact results was not possible.
The accuracy of this analysis was also restricted by the following two conditions:
(1) Despite its limitations, ample research was found on consumer product mail order
sales. The same cannot be said for consumer product sales through vending machines and house-to-house selling (with the exception of the U.S. Census of Retail Trade data, which is limited in scope). Therefore, this study was able to draw some general conclusions about the growth and market share of mail order sales, but could only provide a broad estimate of the growth and market share of the consumer product direct marketing industry as a whole.
According to Direct Marketing Magazine (please refer to Appendix 1) vending machine and house-to-house sales account for only approximately 20% of the entire U.S. direct marketing industry, which includes sales of products and services to consumers and businesses. By observation, it can be said that many vending machines are already located in retail settings (for example, in restaurants and food
establishments) and that according to at least one expert'8 house-to-house
consumer product selling has all but vanished. Therefore, there was a reasonable basis in this study for extrapolating direct marketing from mail order sales.
(2) As mentioned earlier, an objective of this study was to determine the share of the U.S. retail market captured by the consumer product direct marketing industry. This percentage was derived by dividing total U.S. retail trade sales into consumer
product mail order sales. However, a portion of mail order sales included in the studies, which were used as part of this thesis, are accounted for by manufacturers (like IBM, Dell Computers, and Gateway, to name a few) who also sell to
consumers, while the total U.S. retail trade figures do not contain such sales. In this sense, the derived market share figures may be inflated, as the denominator in the equation is smaller than what it should be.
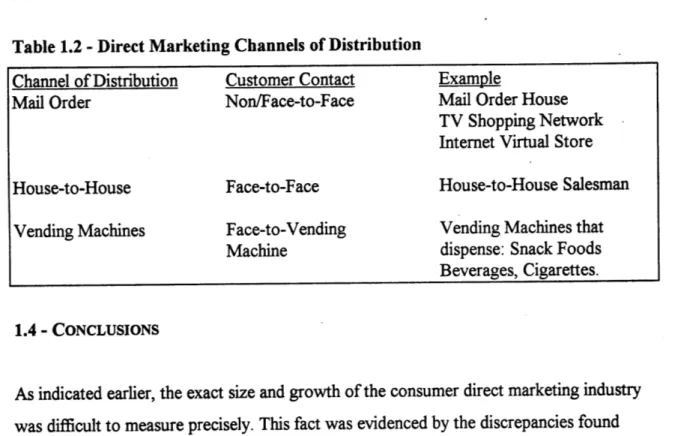
The consumer product direct marketing channels of distribution (i.e., mail order, house-to-house selling, and vending machines) may be described as follows. Although a fourth channel of distribution, electronic deliveries (as on-line deliveries of computer software), can be identified, this channel is still considered to be part of mail order.
1. Mail Order: A mail order sale is a sale of a good that occurs between a business and a customer (or business) at a distance, without face-to-face contact. Any mail, phone, or electronic order (e.g., on-line order) of a product qualifies as a mail order transaction. Mail orders are generated through direct response advertising communications by a variety of media, such as catalogs, newspapers, magazines, radio, TV (including TV shopping networks), telephone marketing, the Internet, etc. Many retailers, such as L.L. Bean in Maine, are almost exclusively mail order. At the same time, many traditional retailers also sell via mail order. The most prominent example of such a retailer/mail-order house is Sears Roebuck.
Increasingly, many wholesalers and manufacturers are selling directly to consumers and businesses via mail order (e.g., the computer manufactures Dell and Gateway).
2. House-to-House Selling: The classic example of a company that used
house-to-house selling is the Fuller Brush Company. In the 40s and 50s Fuller Brush Company salesmen went door-to-door, selling mops, broom, and other cleaning products. The 1987 movie, "Tin Men" gave another representation of a house-to-house retailer, that of the door-to-door aluminum house-to-house siding salesman. A more recent form of house-to-house selling is used by companies such as Tupperware and Discovery Toys whose representatives host "parties" in consumers' homes. The direct marketer Amway, has a slightly different marketing approach since it seeks to build networks of loyal buyers by also making them salespeople. Much of the business these companies do is actually via mail order since many of the products they sell are not delivered to the home at the time of the visit. In fact, in the consumer product market, house-to-house selling appears to have virtually disappeared as more cost-effective channels of communication and distribution have developed. Today, the vast majority of door-to-door sales are arguably accounted for by services, such as insurance and finance.
3. Vending Machines: Vending machines sales include any sale that is transacted
between a customer and a machine that delivers a product. Products that are typically dispensed by vending machines include newspapers, snack foods, beverages, and cigarettes.
Table 1.2 summarizes the consumer product direct marketing channels of distribution and their characteristics.
Table 1.2 -Direct Marketing Channels of Distribution
Channel of Distribution Customer Contact Example
Mail Order Non/Face-to-Face Mail Order House
TV Shopping Network Internet Virtual Store
House-to-House Face-to-Face House-to-House Salesman
Vending Machines Face-to-Vending Vending Machines that
Machine dispense: Snack Foods
Beverages, Cigarettes.
1.4 - CONCLUSIONS
As indicated earlier, the exact size and growth of the consumer direct marketing industry was difficult to measure precisely. This fact was evidenced by the discrepancies found between the various data sources which were used in this study. Therefore, the reader is warned to interpret the results of this study as indicators of general trends rather than as
hard and fast facts and figures.
Although in total the estimates of the U.S. consumer product direct marketing sales were found to be reasonably similar, the same was not true for the estimates by the major retail sectors. In most cases, the discrepancies were so wide that they put into question the reliability of the data as a whole. Nevertheless some possible reasons were given to reconcile these discrepancies.
Despite these limitations, it was judged that today the U.S. consumer product direct marketing industry may be in the range of $120 to $140 billion per year. This figure was about $40 billion in 1979 and is expected to be approximately $175 billion by 2001. These figures translate into a market share of approximately 6% to 7% today. In 1979 market
modest historical market penetration. This study also found that the rate of market penetration may continue at a slow pace, allowing direct marketing to reach a market share of only 6.5% to 7.5% by the year 2001. From this information, it is fair to conclude that in general, direct marketing does not present a major threat to the owners of retail space for the foreseeable future.
Mail order sales of the other retailers sector (including books, magazines, newspapers, sporting goods, jewelry, stationary, toys and games, camera and photographic equipment, novelties and gifts, flowers, and other miscellaneous vendors) were consistently found to have the largest share of the retail market. In addition, according to projections, which were provided by only one of the data sources, this is the only mail order category that may be expected to grow faster than its corresponding retail sector as a whole. Today, mail order represents approximately 10% of the other retailers market sector and it may grow to approximately 14% by 2001. Based on these estimates, it may be judged that direct marketing may have a 12.5% share of this retail market sector today and it could grow to 17.5% by 2001. (These calculations are based on the assumption that mail order represents 80% of direct marketing as a whole). These figures suggest that direct
marketing by these vendors may present a meaningful threat to the owners of retail real estate. Given the wide discrepancies in the data, no reasonable conclusions could be drawn for any of the other major retail sectors.
It was sufficiently clear from the data that despite its current small impact on the
traditional retail trade, the direct marketing industry may still be growing at a faster rate than the retail market as a whole. Then, when will direct marketing reach a point of saturation? Although this thesis was not able to answer this question quantitatively, it provides some research to suggest that direct marketing as a shopping venue may continue to gain in popularity for a long time to come. Communication technology innovations, such as commercial on-line services and the Internet, and demographic shifts (from computer illiterate to computer literate) will likely drive direct marketing's continued success.
Still, direct marketing exhibits some very concrete barriers which prevent it from
becoming a dominant shopping mode. One of these barriers is its inability to provide the consumer with the sensory stimulation and entertainment aspect of the shopping
experience. Another is a weak delivery system. Although technology promises to greatly improve the social aspects of the direct marketing shopping experience (by providing virtual reality shopping venues), it is still far from developing a vastly improved product delivery system, with at least one exception (computer software products sold and delivered on-line). Given these barriers, it is unlikely that direct marketing will ever overtake traditional store shopping as the preferred venue in the foreseeable future.
CHAPTER 2 - DATA SOURCES AND METHODOLOGY
2.1 - BACKGROUND
In this study, the impact of direct marketing on the demand for retail space is inferred by the growth in market share of the direct marketing industry as a percentage of the U.S. retail trade industry.
For the purpose of this study, the U.S. retail trade industry is measured as retail revenues captured under Division G, Retail Trade, of the U.S. Standard Industrial Classification (SIC) system. Division G, is broken down into Major Groups as shown in Table 2.1.
Table 2.1 -U.S. Standard Industrial Classification Retail Trade Major Groups
SIC Maior Group
52 Building Materials, Hardware, Garden Supply, and Mobile Home Dealers
53 General Merchandise Stores
54 Food Stores
55 Auto Dealers and Gasoline Service Stations
56 Apparel and Accessory Stores
57 Home Furniture, Furnishings, and Equipment Stores
58 Eating and Drinking Places
59 Miscellaneous Retail
Source: U.S. Standard Industrial Classification
Major Groups are broken down further into Industry Groups and Industries which are identified by a 1-number and 2-number extension to the Major Group number respectively. For example, Home Furniture and Furnishings Stores are classified under Industry Group number 571 and Furniture Stores are classified under Industry number 5712.
Although Division G includes establishments primarily engaged in selling merchandise for personal or household consumption, these establishments can also be rendering services which are incidental to the sale of goods. In this sense, Division G captures more than pure consumer product retail sales.
At the same time, Division G establishments are considered to be retail in the trade. Therefore, consumer product retail sales of manufactures (such as IBM), which are likely classified under Division D, are not included in the total U.S. Retail Trade figures. In this
sense, Division G captures less than the total U.S. retail trade activity.
Unfortunately, breakdowns of manufacturer consumer product retail sales or retailer service revenues are not available. However, despite these limitations, the sales figures accounted for under Division G of the SIC system represent the best measure of total consumer product retail sales in this country and, therefore, were used accordingly in this analysis.
Exact sales figures for the U.S. consumer product direct marketing industry are somewhat elusive due to the complexity and dynamic nature of this industry. In fact, few have attempted to quantify it. Those who have admit that their data is less than perfect since it is derived from surveys, extrapolations, and expert judgment. Therefore, this study explores more than one available data source in an attempt to acquire a more complete understanding of the size of the U.S. consumer product direct marketing industry.
One of these sources is the U.S. Census of Retail Trade. This census captures consumer product direct marketing sales under Industry Group 596, Nonstore Retailers, which is a
sub-category of Major Group 59. This sub-category is further broken down into the Industries shown in Table 2.2. Coincidentally, these Industries correspond to the three
Table 2.2 - U.S. Standard Industrial Classification of Nonstore Retailers
Direct Marketing
SIC-596 Nonstore Retailer Channel of Distribution
5961 Catalog and Mail-Order Houses Mail Order
5962 Automatic Merchandising Machine Operators Vending Machines
5963 Direct Selling Establishments House-to-House Selling
Source: U.S. Standard Industrial Classification
However, as mentioned in Chapter 1 of this report, it is widely recognized that only a residue of direct marketing activity is accounted for in these SIC codes as they include only direct marketing businesses not assigned to other retail classifications. In reality, much direct marketing is done by companies (both retail and manufacturing) whose primary aim is not direct marketing. For example, large department stores who also sell through mail-order are classified under SIC 531, Department Stores (e.g., J.C. Penny, Sears Roebuck, etc.) and not SIC 596. At the same time, many mail order houses (e.g., Land's End, L.L. Bean, etc.) have established retail outlets whose sales should not be accounted for under SIC 596.
Three more comprehensive surveys of the U.S. direct marketing industry also exist. However, they provide estimates of the mail order channel of distribution of direct marketing only. The first is a database compiled by the Maxwell Sroge Company (MSC) in its publication entitled The U.S. Mail Order Industry. The second is the Direct
Marketing Magazine (DMM) annual survey of businesses using the mail order method of selling, which was prepared by Arnold Fishman, President of Marketing Logistics, Inc. And, the third is a Direct Marketing Association study entitled Economic Impact: U.S. Direct Marketing Today, which was prepared by The WEFA Group (WEFA).
Each of these data sources exhibits various limitations which are all cautiously considered in this analysis. The U.S. Census of Retail Trade figures are the most problematic as they clearly underestimate the size of the U.S. direct marketing industry. However, they
represent actual sales figures and not estimates and are, therefore, a valid first benchmark in the measurement of direct marketing sales.
Although not inclusive of house-to-house selling and vending machine sales, the other three studies (i.e., MSC, DMM, and WEFA), arguably represent the most comprehensive attempts to measure the size and depth of the mail order channel of distribution. They all include product and services mail order sales to both consumers and businesses, of which this study uses the consumer product component only. Each of these studies used a similar approach to develop their sales estimates. They conducted an analysis of a large sample of businesses and a literature review of government and private sources. In the 1991 DMM survey, the latest for which detailed estimates were available, DMM claimed to have analyzed approximately 17,000 consumer product businesses. The WEFA study which was completed in 1995, surveyed about 34,000 businesses in total (however, no
breakdown was available for the number of consumer product businesses). MSC does not reveal the number of businesses it surveyed in any of its literature. With the exception of the DMM survey which includes sales of identifiable businesses only, DMM and MSC extrapolated total sales figures from the sample of businesses analyzed and then verified and adjusted these figures based upon available external data. The WEFA study also conducted a survey and interview component as part of their analysis. The results of these three data sources were, in some cases, very different from one another, suggesting that the data collection and verification and adjustment process was not consistent across
surveys. (Because the DMM survey includes only estimates of sales of identifiable businesses, claiming that extrapolations can be inaccurate, it is perhaps the most
conservative of the three studies). The cause of these differences could not be verified due to the lack of detailed information provided in the studies. For this reason, they are not rigorously compared in this analysis, but simply used to determine common trends.
Unfortunately, each of these data sources also differs in classification methodology and in time periods covered. Therefore, (as discussed in the following sections) a number of
assumptions and adjustments were made in order to standardize these data according to the SIC Retail Trade format.
2.2 - TOTAL U.S. CONSUMER PRODUCT RETAIL SALES STATISTICS
Historical and projected U.S. retail trade sales figures by Division G Major Groups are
shown in Table 2.3. Historical estimates from 1979 to 1995 were obtained from the U.S. Census of Retail Trade'. Projections from 1996 to the year 2001 were obtained from The
WEFA Group, Inc.2 A few adjustments were made to this data in order to make it usable:
(1) WEFA provided combined projections of SIC 56 and SIC 57 from 1996 to 2001.
These figures were split between the individual SICs based upon their historical 1995 proportions. Although this methodology results in identical yearly sales growth rates for SIC 56 and SIC 57, which will unlikely be the case, the lack of better econometric forecasts made it impossible to derive better estimates of these figures.
(2) The Miscellaneous group (i.e., SIC 59, Other Retailers) by definition includes both store and nonstore retailers (i.e., direct marketers). The nonstore portion of this group was, therefore, reallocated to the rest of the groups (including SIC 59, Nonstore Retailers, but excluding SIC 58, Restaurants. Restaurants were excluded as there is no such classification under Nonstore Retailers. This is perhaps because a restaurant that sells exclusively through direct marketing is a rare exception). based upon their historical proportions. Although the proportion of nonstore sales
as a percent of total retail sales increased steadily from 2.28% in 1979 to 2.98% in 1995, it was conservatively assumed to remain constant at 3.0% from 1996 to 2001. Although these assumptions'are unlikely to be completely accurate, they were considered to be reasonable for the purposes of this analysis.
U.S. Department of Commerce, Bureau of Census, Business Division, Revised 4/96
Table 2.3 -Historical and Projected Estimates of U.S. Retail Trade Sales (in nominal billion $) Year 1979 1980 1981 1982 1983 1984 1985 1986 1987 1988 1989 1990 1991 1992 1993 1994 1995 1996 1997 1998 1999 2000 2001 Build. SIC 52 52.0 52.3 53.7 52.2 59.9 68.6 72.7 79.0 85.5 93.4 95.1 97.4 94.1 103.9 112.9 122.2 129.2 132.4 136.3 142.2 148.0 154.2 160.2 Gen. SIC 53 105.8 111.1 123.0 126.9 137.9 152.9 161.9 173.0 185.8 195.9 211.1 221.6 233.4 253.1 272.4 291.3 306.8 320.3 342.6 369.1 395.3 419.2 445.3 Food SIC 54 203.1 225.7 242.2 252.2 262.0 278.3 291.9 304.2 317.7 333.4 357.1 379.0 386.3 388.4 397.8 412.2 425.0 430.6 442.7 455.2 468.4 481.4 494.2 Auto SIC 55 258.5 265.2 292.6 297.5 341.3 389.9 426.1 439.3 458.9 495.3 523.7 541.0 525.5 560.6 614.9 684.8 734.6 740.7 757.4 804.5 868.6 937.6 1,014.3 Appar. SIC 56 47.1 50.3 55.3 56.9 61.1 65.6 71.5 77.2 81.2 86.7 94.7 98.5 100.3 106.7 110.4 112.9 113.7 116.8 120.7 125.1 128.8 132.6 136.6 Furn. SIC 57 43.4 45.2 48.1 47.8 55.7 62.7 69.8 77.3 80.2 87.4 94.1 94.3 94.5 99.5 108.7 122.5 134.2 137.9 142.5 147.7 152.1 156.6 161.3 Rest. SIC 58 82.1 89.9 98.2 104.5 113.3 121.1 128.0 139.4 153.5 167.4 177.9 190.2 194.5 199.9 213.5 223.2 233.6 242.0 252.8 263.7 276.5 290.1 304.0 Other* SIC 59 102.8 114.5 124.7 129.4 136.2 144.8 152.1 159.9 176.0 189.0 204.6 223.1 227.6 232.6 241.8 253.7 265.4 273.9 287.0 302.2 318.8 336.0 354.2 Total 894.9 954.3 1,037.9 1,067.5 1,167.4 1,283.8 1,373.8 1,449.2 1,538.8 1,648.6 1,758.4 1,845.1 1,856.1 1,944.6 2,072.6 2,227.8 2,342.5 2,394.7 2,482.0 2,609.6 2,756.4 2,907.7 3,070.0
Note: Figures may not add up due to rounding.
* Includes store sales only. Nonstore sales were reallocated across other SICs, except for SIC 58,
according to their fraction of total sales.
A detailed breakdown and assembly of the data presented in Table 2.3 may be found in Appendix 2.
2.3 - U.S. CENSUS OF RETAIL TRADE NONSTORE SALES STATISTICS
As explained earlier, the U.S. Census of Retail Trade captures consumer product direct marketing sales under Industry Group 596. Table 2.4 shows historical sales statistics for this Industry Group from 1979 to 19953. A breakdown of these sales figures by the next
sub-categories is also shown. Details of this data may be found in Appendix 2. 3 U.S. Department of Commerce, Bureau of Census, Business Division, Revised 4/96
Table 2.4 - Historical U.S. Nonstore Retail Sales (in nominal billion $) House-to-House and Vending Machines SIC 5962 + SIC 5963 10.9 12.0 12.5 12.5 12.5 12.8 12.4 13.2 15.1 16.8 17.4 19.1 19.1 20.0 19.8 20.6 23.7 Total Nonstore Retail Sales SIC 596 20.4 22.8 23.6 23.8 25.3 27.8 28.3 30.3 35.9 40.5 43.6 45.6 49.1 55.2 58.4 64.0 69.8
Note: Figures may not add up due to rounding
The Nonstore Retail Sales totals were not available as seasonally adjusted, while the rest of the U.S. Census of Retail Trade figures contained in this report are. However, the mismatch between seasonally and not seasonally adjusted data is usually small enough to make the difference negligible for the purposes of this analysis.
Although, as discussed earlier, the above data captures only a small portion of the direct
marketing industry, it nonetheless reveals that the mail order channel of distribution has
been steadily increasing its share of the market, moving from 46.6% in 1979 to 66.0% in
1995. This supports the observation that the house-to-house channel of distribution has
been falling out of favor in the sale of consumer products. Year 1979 1980 1981 1982 1983 1984 1985 1986 1987 1988 1989 1990 1991 1992 1993 1994 1995 Mail Order SIC 5961 9.5 10.7 11.1 11.3 12.8 15.0 15.9 17.1 20.8 23.7 26.3 26.6 30.0 35.2 38.6 43.4 46.0
2.4 - MAXWELL SROGE COMPANY U.S. CONSUMER PRODUCT MAIL ORDER INDUSTRY SALES ESTIMATES
The Maxwell Sroge Company (MSC) estimates of the size and composition of the U.S. mail order industry are the longest running of the data sources used in this study. These estimates are available from 1972 to 19914. MSC used an evolving research methodology to develop their estimates up to 1978. Therefore, it warns readers not to compare these year-to-year figures as changes from one year to the next not only include real business
growth and declines, but also reflect improved data sources and estimating methods. In order to avoid this pitfall, this study considers only estimates from 1979 through 1991, during which a supposedly consistent research methodology was used.
MSC's estimates include spending where the order for the good is placed through the mail, over the telephone, or electronically. The estimates exclude spending where the order is placed in a store (e.g., at a catalog showroom, etc.) or through personal selling. Therefore, it is clear that the Maxwell Sroge Company estimates do not capture the
complete direct marketing universe.
The estimates include mail order sales of goods to consumers which are generated by any direct marketing channel of communication (i.e., catalogs, newspapers and magazine, radio, TV, Internet, etc.) and they are provided by major product segment. The basic research methodology for developing these estimates is described briefly below:
(1) Sales estimates in each product category were developed for thousands of companies by reviewing various internal and external data sources.
(2) Aggregate estimates were obtained for each category by (1) Summing up company estimates across each category, and applying an estimate of concentration of sales of
4 Initially this publication was entitled United States Consumer Mail Order Industry Estimates and it was
the included companies to project a total for the category and (2) Comparing the estimate developed across companies with any available external estimates for the product category and making appropriate adjustments.
Although dated, a full text of the MSC research methodology may be found in Appendix 3.
MSC does not associate its product segments to any SIC code. However, with a few exceptions, these segments conveniently correspond to the Division G, Retail Trade, Major Group numbers as shown in Table 2.5. The segments which do not have a clear association to a specific SIC code are: General Merchandise/Housewares/Gifts,
Health/Nutrition, Major Catalog Retailers, and Unclassified Merchandise.
General merchandise stores are listed under SIC 5399 and while they may carry
housewares and gifts, housewares, generally understood as kitchenware, lamps, blinds, etc., are listed under SIC 5719 and gifts are listed under SIC 5947. Therefore, according to the SIC code MSC's General Merchandise/Housewares/Gifts segment should be split into three different SIC codes. In this study, it was assumed that the bulk of the business volume of this segment falls under general merchandise and, therefore, it is listed under SIC 53 only.
Health and nutrition may be interpreted as being products sold by health food stores, classified under SIC 5499, or by health food restaurants, classified under SIC 5812. Since MSC does not provide a restaurant (SIC 58) estimate, it was assumed that the
-Health/Nutrition product segment belongs only under SIC 54.
Major catalog retailers, which are assumed to be establishments such as L.L. Bean and Land's End, can carry a variety of products, but most often they sell apparel and general merchandise like household appliances, home furnishings, and electronic goods.
retailers were assumed to be SIC 53, General Merchandise Stores, SIC 56, Apparel, and SIC 57, Home Furniture and Furnishings. Sales figures were allocated according to the historical proportion of these major groups. Although this methodology may not depict fact, it was considered to be reasonable.
Unclassified merchandise is a catchall segment which, as the definition implies, includes products not specifically attributable to any of the other broad segments. The SIC code includes all miscellaneous retailers under SIC 5999. Therefore, although the products included under unclassified merchandise are not specifically identified by MSC, the most logical SIC code in which to classify them was SIC 59.
Table 2.5 -MSC Retail Segments and Corresponding SIC Codes
MSC Retail Segment SIC Code
Apparel 56 Automotive 55 Books 59 Collectibles 59 Cosmetics 59 Crafts 59 Electronic Goods 57 Food 54 Gardening/Horticultural 52 General Merchandise/Housewares/Gifts 57 Health/Nutrition 54 Jewelry 59 Magazines 59 Prescriptions 59
Records and Tapes 57
Sporting Goods 59
Tools/Home Repair 52
Major Catalog Retailers 53, 56 & 57
Department Stores 53
Unclassified Merchandise 59
As mentioned earlier, the MSC survey does not include restaurant (SIC 58) direct marketing sales.
Table 2.6 shows the MSC estimates grouped by Division G Major Groups according to Table 2.5. The 1992 through 1994 totals represent projections for which a sector by sector breakdown was not provided. The complete MSC data assembly may be found in Appendix 4.
Table 2.6 - MSC Historical Estimates of U.S. Consumer Product Mail Order Sales
by Major Retail Trade Group (in nominal billion $)
Year 1979 1980 1981 1982 1983 1984 1985 1986 1987 1988 1989 1990 1991 1992 1993 1994 Build. SIC 52 0.7 0.8 0.9 0.9 0.9 1.0 1.0 1.1 1.2 1.3 1.5 1.7 1.9 Gen. SIC 53 3.9 4.4 4.8 5.1 5.7 6.5 7.1 7.9 8.4 11.4 12.6 13.8 15.1 Food SIC 54 1.0 1.0 1.1 1.2 1.2 1.3 1.3 1.4 1.4 1.5 1.7 1.8 1.9 Auto SIC 55 0.2 0.2 0.2 0.3 0.3 0.3 0.4 0.4 0.4 0.5 0.5 0.6 0.6 Appar. SIC 56 2.2 2.4 2.6 2.9 3.1 3.5 4.0 4.6 5.0 6.2 7.8 10.2 12.6 Furn. SIC 57 5.6 6.2 6.5 6.9 7.4 8.2 8.9 9.7 10.5 11.9 14.3 15.7 17.6 Other SIC 59 7.3 7.7 8.6 9.4 10.2 11.2 12.1 13.1 14.3 16.2 18.8 20.4 22.6 Total 20.9 22.6 24.8 26.5 28.9 31.9 34.7 38.1 41.1 49.0 57.1 64.2 72.3 78.5 86.3 96.7 Note: Figures may not add up due to rounding
2.5 - DIRECT MARKETING MAGAZINE U.S. CONSUMER PRODUCT MAIL ORDER
SALES ESTIMATES
Direct Marketing Magazine (DMM) published a comprehensive annual survey of
businesses using the mail order method of selling from 1981 to 1995. From 1981 to 1986
this survey was entitled Mail Order Guide, while from 1987 to 1991 the title was changed
to Mail Order Top 250 as it was expanded to include a listing of the 250 leading U.S. mail
order sales companies. From 1992 to 1995 this survey had a much briefer format, containing only total estimates.
Like the MSC data, the DMM survey includes sales of goods where the consumer placed the order by mail, phone, or electronically, not requiring the consumer to visit a store. It excludes (1) sales through personal selling, (2) orders placed at a catalog desk, and (3) purchases at vending machines. However, it includes sales of products which are picked up by the consumer at a store, as long as the order was placed by mail, phone, or electronically.
The research methodology for developing the mail order sales estimates included in this annual survey is described as a two-fold process which involves the preparation of micro and macro estimates. Micro estimates are estimates of mail order sales of businesses by product segment which are obtained through various public and proprietary sources. Macro estimates are sales estimates based on aggregate sources of mail order sales in the
segment. DMM is careful to point out that its total sales estimates are based on identifiable businesses only. Multipliers were not used as DMM believes that they can cause unwanted data distortions. Therefore, the DMM estimates are likely to be more conservative than the other sources. A full text of the DMM research methodology may be found in
Appendix 5.
DMM cautions the reader against making year-to-year comparisons of the data since the estimates not only reflect actual growth in sales but also include (1) Improvements in the available information (i.e., an expanded database of companies), (2) Improvements in aggregation methodology, and (3) Recognition of additional product segments not previously incorporated. Therefore, year-to-year growth or decline rates of the sales figures calculated from the DMM data will only be used for reference in this study.
This DMM survey provides a breakdown of consumer product mail order sales by two major vendor categories: Specialty vendors and general merchandise vendors. These two
with one or more business SIC code as shown in Table 2.7. A few product segments are not associated with any business SIC code at all.
Table 2.7 -Breakdown of DMM Vendor Categories and Associated SIC Codes
Product Segment Business SIC SIC Division
Specialty Vendors: Animal Care Apparel 23XX Audio-Video 3651 Automotive/Aviation 3714 Books 27XX Collectibles 5999 Consumer Electronics/Science 357X/367X/3811 Cosmetics/Toiletries 2844 Crafts 3944 Food 20XX Gardening 0181 Gifts 5947 Hardware/Tools 342X Health Products 283X Home Construction Housewares 251X/323X/336X/3361 Jewelry 391X/3964 Magazines 2721 Multi-Products Newspapers 2711 Photographic Products 386X Records 3652 Sporting Goods 3949 Stationary 2771 Tobacco 21XX/277X Toys/Games/Children's Products 3944 Computer Software 7372 Computer Hardware 7372 Manufacturing Manufacturing Manufacturing Manufacturing Retail Trade Manufacturing Manufacturing Manufacturing Manufacturing Agriculture Retail Trade Manufacturing Manufacturing Manufacturing Manufacturing Manufacturing Manufacturing Manufacturing Manufacturing Manufacturing Manufacturing Manufacturing Manufacturing Services Services 5311 5311/561X Retail Trade Retail Trade
General Merchandise Vendors:
Big 5 Catalog Retailers Department/Specialty Stores Catalog Showrooms
The Big 5 Catalog Retailers product segment was named for the original large catalog sellers: Sears Roebuck, J.C. Penny, Montgomery Ward, Spiegel, and Aldens. However, Aldens dropped out after 1982 and Montgomery Ward dropped out after 1986, having
sold its mail order unit in 1985.
It should also be noted that mail order sales for Sears Roebuck and J.C. Penny include insurance and auto club sales and that the Multi-Product segment includes travel and entertainment card company sales. Since these are likely to be services and not consumer products, the DMM estimates could be somewhat inflated. However, as mentioned earlier, the DMM estimates are based upon sales of identifiable business only, and therefore should still be conservative.
For the purposes of this study, the DMM product segments were reclassified under an appropriate Division G, Retail Trade, Major Group number as shown in Table 2.8. Although Health Products is not specifically identified in the SIC code, it is interpreted to be equivalent to Health and Dietetic Food Stores under SIC 5499. Although Home Construction may include floor covering stores which are under SIC 5713, most home
construction products are under SIC 52. Therefore, the Home Construction segment was assigned to SIC 52. As mentioned earlier, Multi-Products includes a service component. However, the DMM survey never specifically identifies which products are included in this
segment. In this case, the most logical classification for Multi-Products was SIC 53, General Merchandise Stores.
As was the case in the MSC estimates, the DMM survey does not provide estimates for direct marketing sales of restaurants (SIC 58).
Table 2.8 - Reclassification of DMM Vendor Categories Under Retail Trade SIC Codes
Product Segment Business SIC Retail Trade SIC
Specialty Vendors: Animal Care Apparel 23XX Audio-Video 3651 Automotive/Aviation 3714 Books 27XX Collectibles 5999 Consumer Electronics/Science 357X/367X/3811 Cosmetics/Toiletries 2844 Crafts 3944 Food 20XX Gardening 0181 Gifts 5947 Hardware/Tools 342X Health Products 283X Home Construction Housewares 251X/323X/336X/3361 Jewelry 391X/3964 Magazines 2721 Multi-Products Newspapers 2711 Photographic Products 386X Records 3652 Sporting Goods 3949 Stationary 2771 Tobacco 21XX/277X Toys/Games/Children's Products 3944 Computer Software 7372 Computer Hardware 7372
General Merchandise Vendors:
Big 5 Catalog Retailers 5311
Department/Specialty Stores 5311/561X
Table 2.9 shows the DMM estimates grouped by Division G Major Groups according to Table 2.8. Sales figure breakdowns by major retail groups for 1987 were not available and therefore, were interpolated. As mentioned earlier, breakdowns were also not available for
1992 through 1995. The complete DMM data assembly may be found in Appendix 6.
Table 2.9 -DMM Estimates of U.S. Consumer Product Mail Order Sales by Major
Retail Trade Group (in nominal billion $)
Build. Gen. Food Auto Appar. Furn. Other
Year SIC 52 SIC 53 SIC 54 SIC 55 SIC 56 SIC 57 SIC 59 Total
1982 0.9 8.8 1.1 0.2 1.4 1.5 14.7 28.6 1983 1.0 10.2 1.4 0.3 1.8 1.8 13.6 30.2 1984 1.1 13.7 1.7 0.3 2.2 2.5 14.9 36.5 1985 1.2 14.8 1.9 0.4 2.4 3.0 15.4 39.0 1986 1.2 13.6 2.1 0.4 2.5 3.1 16.4 39.3 1987 1.4 12.7 2.9 .0.5 3.2 3.6 18.4 42.8 1988 1.5 14.8 3.6 0.6 3.8 4.0 19.5 47.8 1989 1.7 18.9 3.6 0.6 3.6 4.2 21.3 53.9 1990 1.7 19.8 3.8 0.6 4.3 4.3 22.4 56.9 1991 2.2 22.8 4.3 1.1 4.4 5.0 24.4 64.2 1992 66.9 1993 71.4 1994 77.9 1995 85.8
Note: Figures may not add up due to rounding
2.6 - DIRECT MARKETING ASSOCIATION U.S. CONSUMER PRODUCT MAIL ORDER
SALES ESTIMATES
The Direct Marketing Association study entitled Economic Impact: U.S. Direct Marketing Today provides the most recent estimates of direct marketing consumer sales as well as projections for the future. As mentioned earlier, this study was prepared by The WEFA Group which was formed in 1987 through the merger of two leading consulting firms: Chase Econometrics and the Wharton Economic Forecasting Associates. This study differs from the other data sources in that it not only tracks the historical trends in U. S. mail order sales, but also develops an econometric model to forecast future sales. The
The definition of direct marketing used by WEFA in its study is media-based, in the sense that it measures sales generated by the various channels of communication: Direct mail (i.e., catalogs), television, radio, newspaper, magazines, telephone marketing, and other media, such as electronic communication. However, the WEFA study does not include any house-to-house or vending machine sales. The direct marketing communication by its
intended purpose is broken down as follows:
Direct Orders: A direct marketing communication (by any medium) which is designed to solicit and close a sale. This includes communication which provides the consumer with enough information to make an immediate decision to purchase a product, and a response mechanism (i.e., telephone or mail order information).
Lead Generation: A direct marketing communication (by any medium) which is designed to generate interest in a product and provides a prospective buyer with the means to request additional information about the product.
Traffic Generation: A direct marketing communication (by any medium) which is designed to motivate a prospective buyer to visit a store, restaurant or other business establishment.
This study analyzes only the direct order category of direct marketing sales as it only seeks to establish the extent of impact that direct marketing has on the demand for retail space. Although the lead generation category may also generate direct order sales (i.e., sales of goods where the consumer placed the order by mail, phone, or electronically, not requiring the consumer to visit a store), this study makes the assumption that sales attributed to lead generation primarily result in store sales.
The WEFA study research methodology includes a combination of statistical data analysis, independent expert opinion, primary and secondary research, and economic modeling. The
study was also continually augmented by thorough literature and information searches on direct marketing and other industries. A full text of the WEFA research methodology may be found in Appendix 7.
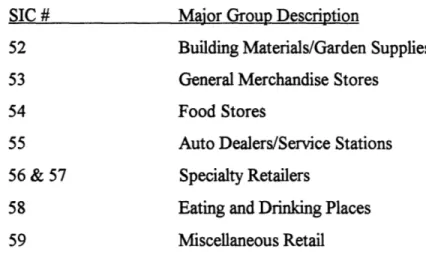
The WEFA study organizes consumer product sales by Retail Trade SIC code Major Group numbers as shown in Table 2.10.
Table 2.10 -WEFA Classification of Consumer Product Sales
SIC # Major Group Description
52 Building Materials/Garden Supplies
53 General Merchandise Stores
54 Food Stores
55 Auto Dealers/Service Stations
56 & 57 Specialty Retailers
58 Eating and Drinking Places
59 Miscellaneous Retail
Therefore, the DMA data did not have to be re-categorized extensively as was the case with the previous two data sources. However, two exceptions exist. The first lies with SIC
59 which includes both store and nonstore retailers (i.e., mail-order houses and direct selling establishments). In this case, the nonstore portion of these sales figures was
reallocated to the other major retail groups, including SIC 59 store retailers, but excluding SIC 58, restaurants, based upon their fraction of total sales. (As was the case in the total retail trade reallocations, restaurants were excluded as there is no such classification under Nonstore Retailers). The nonstore portion of sales was determined based upon the
historical proportion of nonstore sales of total U.S. retail trade sales.
The second exception lies with the Specialty Retailers category which is identified as a combination of SIC 56 and 57. Up to 1995 Specialty Retailers sales were split between
2001, this category was split according to the 1995 breakdowns of total U.S. retail sales, which results in equal growths of SIC 56 and SIC 57. Although this methodology is unlikely to reflect fact, it was considered to be reasonable for the purposes of this study.
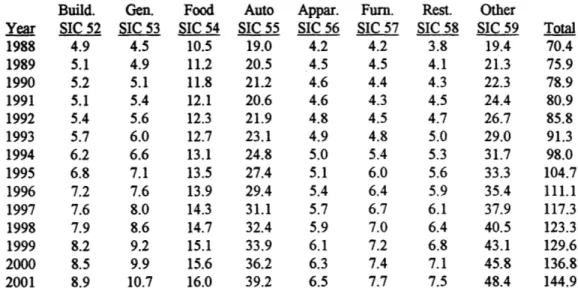
Table 2.11 shows the WEFA estimates grouped by Division G Major Groups. The complete WEFA data assembly may be found in Appendix 8.
Table 2.11 -WEFA Historical and Projected Estimates of U.S. Consumer Product
Mail Order Sales by Major Retail Trade Group (in nominal billion
$)
Year 1988 1989 1990 1991 1992 1993 1994 1995 1996 1997 1998 1999 2000 2001 Build. SIC 52 4.9 5.1 5.2 5.1 5.4 5.7 6.2 6.8 7.2 7.6 7.9 8.2 8.5 8.9 Gen. SIC 53 4.5 4.9 5.1 5.4 5.6 6.0 6.6 7.1 7.6 8.0 8.6 9.2 9.9 10.7 Food SIC 54 10.5 11.2 11.8 12.1 12.3 12.7 13.1 13.5 13.9 14.3 14.7 15.1 15.6 16.0 Auto SIC 55 19.0 20.5 21.2 20.6 21.9 23.1 24.8 27.4 29.4 31.1 32.4 33.9 36.2 39.2 Appar. SIC 56 4.2 4.5 4.6 Furn. SIC 57 4.2 4.5 4.4 4.3 4.5 4.8 5.4 6.0 6.4 6.7 7.0 7.2 7.4 7.7 Rest. SIC 58 3.8 4.1 4.3 Other SIC 59 19.4 21.3 22.3 24.4 26.7 29.0 31.7 33.3 35.4 37.9 40.5 43.1 45.8 48.4 Total 70.4 75.9 78.9 80.9 85.8 91.3 98.0 104.7 111.1 117.3 123.3 129.6 136.8 144.9
CHAPTER
3
-SIZE
AND GROWTH OF THEU.S.
CONSUMER PRODUCT DIRECT MARKETING INDUSTRY3.1 - GROWTH TRENDS OF U.S. CENSUS OF RETAIL TRADE NONSTORE RETAILER
SALES
Figure 3.1 shows yearly sales of nonstore retailers from 1979 to 1995, as reported by the U.S. Census of Retail Trade, under SIC 596, Nonstore Retailers, including a breakdown between mail order establishments and other direct marketing establishments (i.e., vending
machine and house-to-house sellers). The graph clearly shows the dominant position that mail order has secured over time. In 1995 mail order sales represented approximately 66% of all direct marketing sales. In total, U.S. Census of Retail Trade direct marketing sales grew from approximately $20 billion in 1979 to approximately $70 billion in 1995.
Figure 3.1 - U.S. Census of Retail Trade Nonstore Retailer Sales
80
70-60
-c 50
4s U Other Drect Marketing Venues
U Mail Order 4) 30 20 10 0 CF) ' n 1 )CY Ue) r-- o Go c co co 0) 0) 0) CD 0 0) 0) 0 0) 0) 0) 0) Year