HAL Id: inserm-03261002
https://www.hal.inserm.fr/inserm-03261002
Submitted on 15 Jun 2021HAL is a multi-disciplinary open access archive for the deposit and dissemination of sci-entific research documents, whether they are pub-lished or not. The documents may come from teaching and research institutions in France or abroad, or from public or private research centers.
L’archive ouverte pluridisciplinaire HAL, est destinée au dépôt et à la diffusion de documents scientifiques de niveau recherche, publiés ou non, émanant des établissements d’enseignement et de recherche français ou étrangers, des laboratoires publics ou privés.
Measuring and interpreting transposable element
expression
Sophie Lanciano, Gael Cristofari
To cite this version:
Sophie Lanciano, Gael Cristofari. Measuring and interpreting transposable element expression. Nature Reviews Genetics, Nature Publishing Group, 2020, 21 (12), pp.721-736. �10.1038/s41576-020-0251-y�. �inserm-03261002�
Measuring and interpreting transposable element expression
Sophie Lanciano and Gael Cristofari†University Côte d’Azur, Inserm, CNRS, IRCAN, Nice, France.
†e-mail: [email protected]
Abstract
Transposable elements (TEs) are insertional mutagens that contribute greatly to the plasticity of eukaryotic genomes, influencing the evolution and adaptation of species as well as physiology or disease in individuals. Measuring TE expression helps to understand not only when and where TE mobilization can occur, but also how this process alters gene expression, chromatin accessibility or cellular signalling pathways. Although genome-wide gene expression assays such as RNA-sequencing include transposon-derived transcripts, the majority of computational analytical tools discard or misinterpret TE-derived reads. Emerging approaches are improving the identification of expressed TE loci and helping to discriminate TE transcripts that permit TE mobilization from gene–TE chimeric transcripts or pervasive transcription. Here, we review the main challenges associated with the detection of TE expression, including mappability, insertional and internal sequence polymorphisms, and the diversity of the TE transcriptional landscape, as well as the different experimental and computational strategies to solve them.
Introduction
Transposable elements (TEs) are mobile genetic elements that form a large fraction of eukaryotic chromosomes, ranging from 12% of the Caenorhabditis elegans genome to up to 85% of the maize genome1. Consistently, genome size largely reflects TE copy number1. TEs
are insertional mutagens and major drivers of genome evolution, acting both in the germline and in select somatic tissues. Their influence on host adaptation and disease, such as tumorigenesis or neurodegenerative diseases, has been extensively documented2-6.
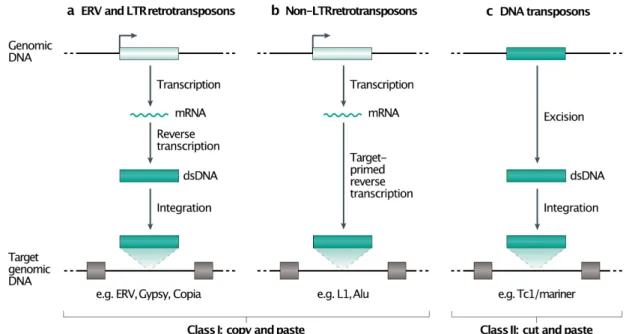
TEs belong to different classes, depending on their molecular mechanism of replication, with a major distinction being made between retrotransposons and DNA transposons (Fig. 1). Transcription is the first step in the replication of retrotransposons. Retrotransposon RNA can serve as a template for both the translation of retrotransposon proteins and for reverse transcription, a process leading to the formation of a new DNA copy that is inserted into the host genome. While transcription is also important for DNA transposons — it enables transposase expression, the protein required at the excision and reintegration steps — we focus here mainly on retroelements because of their specificities. Thus, although many post-transcriptional mechanisms can suppress TE mobilization, transcription is a prerequisite for their proliferation and mutagenic activity.
Many TEs are molecular fossils, remains of past mobilization waves that occurred millions of years ago7. These ancient TEs have accumulated inactivating mutations and
truncations that prevent their mobilization in modern genomes (Fig. 2a), but can still be transcriptionally active, with potential consequences for the host genome8-10. Independently of
its role in transposition, TE expression itself — through the transcript, the act of transcription itself, or subsequent TE replication intermediates — can regulate gene expression11-13 and
chromatin accessibility14, activate cellular signalling pathways, such as the interferon
response15 or RNA interference (RNAi) responses16, and trigger ageing17 or antiviral
activities18.
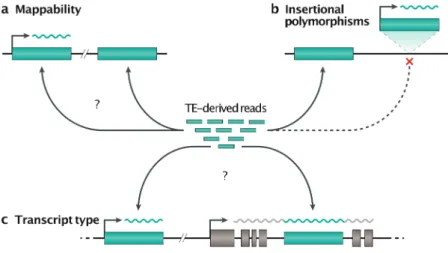
With a few exceptions, transcription along the length of the TE unit is usually driven by an internal promoter, which is mobilized concomitantly with the element itself. This ensures that the newly inserted TE possesses its own promoter and does not depend on the presence of a cellular promoter near its insertion site. However, because TEs can contain multiple cis-acting sequences (for example, sense and antisense promoters, acceptor and donor splice sites, or polyadenylation signals), be fragmented, and insert into or in the vicinity of genes, their transcriptional activity is often intertwined with that of genes. Hence, autonomous TE unit transcription [G] can easily be confounded with TE-chimeric transcripts [G] or with the expression of the gene into which a given TE is inserted, a situation referred to as co-transcription [G], which is also known as read-through co-transcription.
In summary, TEs are repeated and interspersed, polymorphic [G], and may overlap with genes, creating complex transcripts initiated from TE or gene promoters. These unique features hinder the analysis of TE expression with standard methods developed to monitor gene expression, whether based on hybridization or sequencing, such as reverse transcription-quantitative polymerase chain reactions (RT-qPCR), northern blotting, microarrays or RNA sequencing. Careless application of these methods can lead to overestimation or underestimation of TE expression; erroneous conclusions regarding TE reactivation; misinterpretation of their impact on the host transcriptome; or simply overlook their involvement in the process under study. However, dedicated algorithms, multi-omics approaches and advances in sequencing technologies have recently improved the quantification and interpretation of TE expression, providing new insights into host–TE interactions.
Here, we first outline the three major TE characteristics that hamper the study of TE expression. We then present the main experimental approaches used for the quantification and interpretation of TE expression before we highlight how recent advances can overcome the main challenges posed by the particularities of TEs, as well as existing limitations. Finally, we discuss the perspectives raised by new algorithms and long-read sequencing technologies.
Challenging features of TEs
TE sequences are repetitive and interspersed
At the time of integration into the genome, a new TE copy is identical to its source — or progenitor — copy. Nevertheless, in the absence of positive selection [G] , the internal sequence of TEs diverges progressively after integration through random mutations and other forms of alterations19 (Fig. 2). For simplicity, families that are currently, or were recently, active
are often referred to as ‘young families’, whereas those with a higher degree of divergence towards consensus are referred to as ‘old families’ (Fig. 2). However, young and old TE families are relative concepts that depend on the investigated process. For instance, in humans, ‘young’ long interspersed element 1 (LINE-1 or L1) families may refer to the human-specific L1HS family when studying disease-causing insertions, but may include older families such as L1PA2 to L1PA5, which expanded approximately between 3–20 million years ago, when investigating primate evolution20.
The number of active families within a given species, as well as the number of active progenitor elements within these families, is highly variable21. In humans, only the youngest
TE subtypes, Alu, L1 and SVA elements (retrotransposons composed of short interspersed elements (SINEs), variable number tandem repeats and Alu sequences), can still actively retrotranspose22. However, Alu and SVA are non-coding sequences and depend on L1 activity,
80–100 L1 elements among the hundreds of thousands copies present in the human genome are retrotransposition-competent (whether expressed or not), all of which belong to the family of human-specific L1 (L1HS)23. Of these, only 20 are likely responsible for most ongoing L1
activity23-27. Indeed, mammalian retrotransposons have been amplified by successive waves
of retrotransposition of a small number of master copies that eventually become inactivated by mutations or silenced by epigenetic mechanisms20,28-31. As a result, internal diagnostic SNPs
can be found that differentiate TE families or even lineages within a given family26,32,33.
In other vertebrates, insects and many plant species, many more TE families seem concurrently active compared with humans2,21,34,35. For example, in Drosophila melanogaster,
the majority of TE families including DNA transposons (for example, Pogo and P element), LTR-retrotransposons [G] (for example, Copia and Gypsy) and non-LTR retrotransposons (that is, LINE-like elements such as TART and Jockey) are likely to possess active members, and approximately 30% of all individual copies are considered capable of transposition36.
However, it seems that in some of these organisms, such as Drosophila species, individual TE families have often not expanded to the copy numbers reached in mammals, possibly as a result of short generation time and rapid genomic turnover37-39. Internal fertilization and body
temperature may also be important factors to explain such differences (discussed in21).
To summarize, older TEs have accumulated mutations, diverged over time and tend to become unique, whereas younger TEs are almost identical to each other (Fig. 2). The presence of old and recent families of evolutionary-related retrotransposons in the same genome increases the difficulty of distinguishing active from inactive families.
TEs are polymorphic elements
The ongoing activity of some TE families leads to insertional polymorphisms, that is, the presence or absence of a TE at a given locus within a species or within restricted populations. Some of these polymorphisms can even be private to a single individual. Various specialized wet-lab approaches and bioinformatics tools have been developed to identify mobile element insertions (reviewed in40-42). In humans, for example, 20% of all inherited structural variants
result from new TE insertions43. Considering only L1s, two human individual genomes differ,
on average, at 285 sites with respect to L1 insertion presence or absence44. In mouse, the
combined activity of L1 and endogenous retroviruses (ERVs), such as the intracisternal A particle (IAP) and early transposon (ETn)/Mus musculus type D (MusD) families, leads to even more TE insertional polymorphisms than in humans45-48.
At the scale of animal or plant natural populations, the extent of this type of variation seems to be considerable35,43,49-51. For example, in natural populations of the flowering plant Arabidopsis thaliana, TEs are strongly active, and thousands of TE insertional polymorphisms
allele frequency tend to be among the most active elements since they inserted recently relative to the population history and, therefore, have little or no alteration24. Their mobilization
can be influenced by environmental and genetic factors, and some of them show signatures of positive selection51,52, whereas others have detrimental effects and are implicated in
disease5,33,53,54. Thus, it is critical not to dismiss polymorphic TEs when analysing TE
expression. Finally, in addition to these insertional polymorphisms, the internal sequence of a given TE locus may also contain SNPs that differ from one individual to another and can alter their retrotransposition potential31,55.
TE transcripts are diverse
TE transcripts used as template for reverse transcription. Retrotransposon transcription
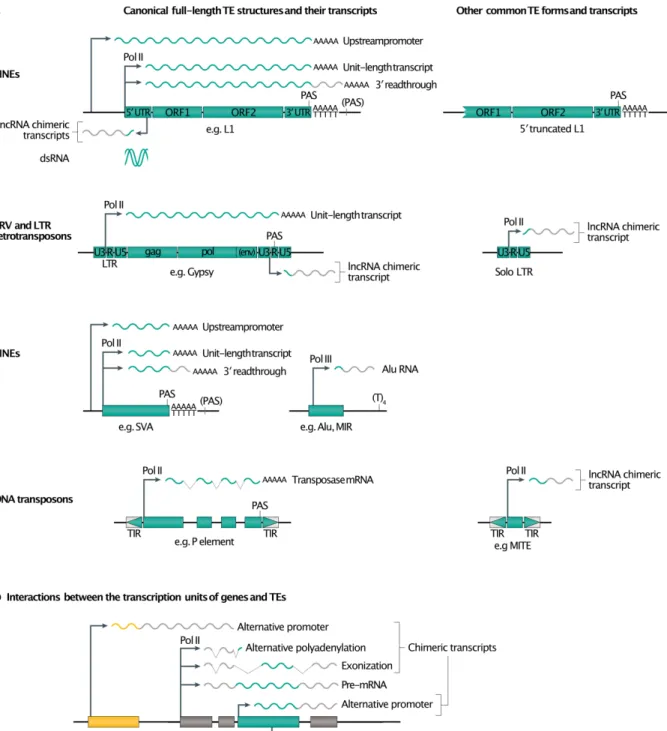
is the starting point of the retrotransposition process. The synthesized RNA species that serve as canonical templates for productive reverse transcription are called TE unit-length transcripts [G] (also referred to as full-length, proper or genomic transcripts). Transcription is initiated from an internal Pol II promoter contained in the LTRs for LTR-retrotransposons and ERVs, or in the 5’ UTR for LINEs56,57 (Fig. 3a). SINEs can have either internal Pol III promoters
(for example, Alu and MIR)58 or Pol II promoters (SVA elements)59. Transcription can end upon
recognition of a polyadenylation signal located in the 3’ LTR (in the U3 or R segment) for LTR-containing retroelements or in the 3’ UTR for LINEs60,61. Alternatively, termination can occur in
the downstream flanking sequence. For example, Alu elements do not contain a Pol III termination signal, which consists of a simple (T)4 tract, but transcription will stop as soon as
this motif is reached in the flanking sequence62. Similarly, L1 elements have a weak
polyadenylation signal, leading to a significant fraction of 3’ readthrough63,64. The fraction of
these 3’-extended L1 RNAs varies and might depend on the poly(dA) length of the element65.
These extended RNA species can be used as a template for reverse transcription as efficiently as unit-length transcripts, leading to the retrotransposition of sequences derived from L1 3’ flank to new genomic locations (3’ transduction) 64,66,67. Similarly, L168,69 or SVA59,70 can be
transcribed from a promoter present in their 5’ flank, leading to 5’ transductions when reverse transcribed. Note that 3’-readthrough refers to transcripts initiated from the L1 promoter but extending beyond its polyadenylation signal and ending in the 3’-flanking sequence. This process is distinct from readthrough transcription, which corresponds to passive co-transcription of TE sequences included in genes, initiated from genic promoters. However, the R2 group of non-LTR retrotransposons is a notable exception to this scenario. These elements specifically integrate into ribosomal DNA (rDNA) and are co-transcribed with rDNA units. The R2 RNA is then cleaved from the co-transcript by a self-cleaving ribozyme positioned it its 5’-end71.
Short TE transcript isoforms. In addition to full-length retrotransposon RNA, shorter TE
transcript isoforms can be synthesized upon premature polyadenylation or splicing57,72-74, and
can result from cellular regulatory mechanisms, such as Piwi-interacting RNA (piRNA)-guided alternative splicing75. Short TE transcript isoforms may encode proteins with significant
biological activities. For example, human L1 can undergo splicing into a subgenomic RNA containing only ORF2p, a protein with endonuclease and reverse transcriptase activities74. On
its own, this protein cannot support L1 retrotransposition, which also requires the expression of ORF1p from the full-length transcript, but it can mobilize Alu or SVA elements in trans and can trigger DNA damage76. Similarly, internal transcripts of the Ty1 retrotransposon in Sacchomyces cerevisiae encode dominant-negative forms of Gag, the main constituent of the
virus-like particles, which limit its retrotransposition77. Retrotransposons also frequently
contain antisense promoters, although they are probably not a major determinant of retrotransposon unit transcription78-84.
TE internal promoter integrity. The autonomous transcriptional capacity of retrotransposons
depends on the presence and integrity of their promoter. However, LINE retrotransposons are frequently 5’-truncated at the time of insertion due to the resolution of the integration process and likely intervention by the DNA repair machinery85,86 (Fig. 3a). L1 promoter activity can also
be lost by splicing of the L1 RNA within the 5’-UTR before integration87. For example, of the
500,000 L1s present in the human genome, only 5,000 are full-length and thus include the internal 5’-UTR promoter typical of these elements23,88. Conversely, LTR-retrotransposons
often undergo ectopic homologous recombination between their two LTRs (Fig. 2a, 3a), resulting in the complete elimination of coding regions, but leaving an intact solo-LTR with all its original cis-regulatory sequences57,89-92.
Chimeric TE RNA species and pervasive transcription. The retrotransposon transcription
landscape is made more complex by interactions between the transcription units of genes and those of TEs, leading to chimeric transcripts, in which a fragment or all of the TE is incorporated into the mature mRNA93 (Fig. 3). Solo-LTRs, as well as antisense L1 promoters, often drive
the synthesis of long non-coding RNAs (lncRNAs)94-98. They can also act as alternative
promoters for cellular genes, leading to chimeric TE transcripts (Fig. 3b), often in conjunction with splicing events57,78,82. Alternatively, TEs or TE fragments can be incorporated into spliced
mRNA by co-transcription with a cellular gene into which they are inserted. This can occur when TEs are inserted in exons (often corresponding to the 3’-UTR), or when TEs are inserted in introns but a fragment of their sequence is exonized by splicing (Fig. 3b). This scenario is far from anecdotal, since more than a third of human protein-coding transcripts contain an exon of TE origin (mainly in their UTRs), as do three quarters of human lncRNAs94,95. As a
consequence, an apparent change of TE expression levels may simply reflect variation of the expression of the gene into which a member of this particular TE family is inserted.
Given the abundance of TEs in eukaryotic genomes, especially in intergenic regions and introns, pervasive transcription [G] and pre-mRNAs can represent a very large fraction of all TE-containing RNA species, even though each locus contributes only minimally to the whole transcriptome99,100 (Fig. 3b). For example in humans, >99% of L1-derived RNAs
originate from co-transcription or pervasive transcription and do not reflect transcription from L1 unit-transcripts99. The biological impact of pervasive transcription is not well understood,
but part of it is involved in the production of lncRNAs94,95,101,102 and enhancer-associated RNA
(eRNA)103.
Double-stranded TE RNA. The considerable diversity of TE-containing transcripts can lead
to the formation of double-stranded RNAs (dsRNA) through complementarity between sense and antisense transcripts (Fig. 3). These can arise through convergent and overlapping transcription or through annealing of transcripts from different loci sharing homologous TE sequences. Synthesis of dsRNA species can trigger RNA interference and silencing of TEs in a wide variety of organisms11,83,104-109. TE-derived dsRNA transcripts can also be formed by
annealing of a genic transcript with an antisense RNA initiated from intra- or intergenic TEs, inducing the repression of the gene110 or silencing of the implicated TE111. Distinct cellular
transcripts containing TE in opposite orientation can also regulate each other by Staufen-mediated RNA decay112. Similarly, DNA demethylating agents, such as those used in cancer
chemotherapy, induce the expression of TE-derived dsRNAs that activate antiviral defences and interferon response pathways113,114.
To summarize, the transcriptional landscape of TEs is not limited to unit-length TE transcripts that will serve for retrotransposition but includes a number of chimeric or pervasive transcripts, originating from TE promoter activity or from passive co-transcription. Overall, these RNA species can significantly influence cell physiology independently of TE mobility.
Measuring TE expression
Many molecular and computational tools are now available to assess TE expression, but the strategy must be guided by well-defined underlying biological questions and hypotheses. Aspects of TE biology that are often investigated include: whether TEs competent for mobilization are expressed, which may lead to new insertions; whether TEs have a functional impact on genes; and whether biologically active molecules derived from TEs are synthesized (that is, dsRNAs, small RNAs or TE proteins). In the following section, we list conventional and genome-wide approaches available to measure and understand the expression of TEs and explain how they can help study specific facets of their biology.
Conventional approaches
Although the use of sequencing techniques is growing exponentially, conventional molecular biology approaches are still commonly used to study TEs, some providing unique information that is not available with genome-wide approaches.
Detection of TE-derived transcripts. RT-qPCR is commonly used for measuring the
transcriptional level of TEs but presents several major limitations. First, because the starting material is generally total RNA, including pre-mRNA, autonomous and passive transcription are confounded (Box 1). Second, it is often difficult to design probes and primers truly specific to a given TE family. Third, the sequence of the amplified fragment is unknown and may come from defective copies with mutations or truncations, or from non-unit-length transcripts99.
Instead, northern blotting may reveal the size distribution of TE-derived transcripts and the potential presence of full-length TE transcripts115,116, although cross-hybridization of probes
between related families is possible. Finally, reporter gene knock-in can be used to measure the autonomous transcription of individual TE loci and can be parallelized. This approach has been used to test the transcriptional activity of each individual Ty1 retrotransposons present in a laboratory strain of S. cerevisiae117, but is difficult to generalize.
Detection of TE proteins. Internal TE mutations that prevent the translation of functional TE
proteins23,88 and post-transcriptional regulation by cellular factors limit retrotransposition
downstream of TE transcription75,118-121. With respect to this issue, western blotting and
immunofluorescence experiments are complementary approaches that can help to evaluate the expression of the mobilization machinery itself. However, the use of protein-based approaches is limited by the availability of specific, sensitive and well-validated reagents, the potential cross-reactivity of antibodies between related families of TE, and the frequent need for large quantities of starting material. Similarly, purification or direct visualization by electron microscopy of replicative complexes (for example, the ribonucleoprotein particle or virus-like particles) represent direct means of detecting assembled replication intermediates and, thus, a certain level of functionality122-125.
Altogether, some of these techniques are useful for testing the overall expression of selected families of TEs and may provide unique insights (for example, length and coding capacity of TE transcripts, potential of assembled complexes), but other strategies are needed to obtain an unbiased and genome-wide view of TE expression.
Genome-wide analysis of TE expression
Although past attempts have been made to take advantage of general-purpose or specialized microarrays, they have not been widely adopted to analyse TE transcription126-130, likely owing
to difficulties in designing short and specific probes. They have now been largely supplanted by deep-sequencing technologies. However, constraints of short-read sequencing and the specific features of TEs detailed above mean that TE transcription cannot be analysed in the same way as gene transcription. Hence, the number of TE-dedicated computational approaches and tools is rapidly increasing (Table 1), and selecting one can be challenging. Most genome-wide approaches use RNA-seq data, but they mainly differ on: their mapping strategy (the use of uni- and multi-mapping reads) and their resolution (family or locus-specific level); their strategy to take into account TE polymorphisms; their ability to distinguish autonomous from co-transcription and pervasive transcription; their ability to discover and/or quantify chimeric transcripts; and the analysis of other TE-derived transcripts such as dsRNA and small RNAs.
Tackling TE-specific challenges
Mappability
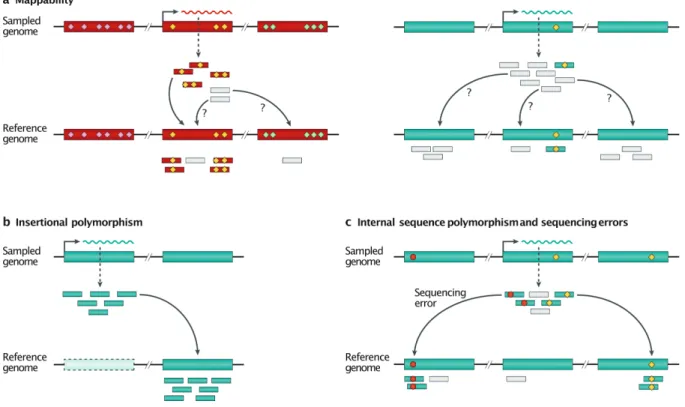
A practical consequence of TEs being highly repeated sequences, as well as evolutionary-related TE families being present in the same genome, is that short sequencing reads originating from TEs can often map equally well at different positions in the genome (Fig. 4a). These reads are referred to as ‘multi-mappers [G]’ and, therefore, their locus of origin cannot be unambiguously defined. Similarly, primers or probes can cross-hybridize to multiple copies or related families. A simple strategy to circumvent the mappability (Box 2) problem when studying the TE transcriptome is to map reads against the reference genome and keep only the unique reads, then aggregate the counts for each family. Keeping only uniquely mapping reads, known as ‘uni-mappers [G]’, can provide satisfactory estimates for the expression of old TE families99,131. Nevertheless, this approach should be avoided as it tends to greatly
underestimate or even eliminate the signal associated with young TE families, that is, those which are still mobilization-competent (Fig. 4). Consequently, the signal reflects more closely the mappability (Box 2) of the element rather than its transcript level132. This effect can be
somewhat mitigated by increasing read length and using paired-end libraries. Only 68% of annotated human TEs are uniquely mappable with short reads of 50 bp, but 88% are mappable with 100 bp-long reads133. However, even with 2x100 bp paired-end libraries, less than half of
the reads emanating from the youngest human L1 family, L1HS, or from the 25 youngest TE families in the mouse genome are uniquely mapped134. Thus, multi-mapping reads are a
challenge for recently or currently active TE families, but less for older families, at least with commonly used short-read sequencing technologies and experimental conditions.
By contrast, mapping reads against a library of consensus sequences, such as Repbase135, will directly provide aggregated TE counts by family and may be useful for the
youngest elements. However, as mapping efficiency decreases for old elements that are more divergent from their consensus sequence, the stringency of alignment must be relaxed to tolerate more mismatches (Fig. 4). As a result, the mapping of non-TE reads or reads from related TEs can be forced to the provided sequences alone, leading to overestimates of the read count of this family. TEtools is a declination of this approach in which consensus sequences are replaced by the entire set of genomic repetitive sequences136. While this
method resolves the mapping bias relative to TE age, it still tends to overestimate some TE counts by forcing non-derived fragments to map to TE sequences134. A missing aspect of these
TE-centred reference approaches is the possibility to distinguish co-transcription from TE unit transcription, with the consequence of overestimating TE family transcription levels for both young and old elements. Other limitations are that inter-family ambiguities still occur, the number of loci expressed is unknown, and most reads remain unmapped, complicating normalization and sample-to-sample comparisons. Nevertheless, when studying species for which a reference genome or transcriptome is not available, they may be the only options for obtaining a first glimpse of the TE transcriptome137-139.
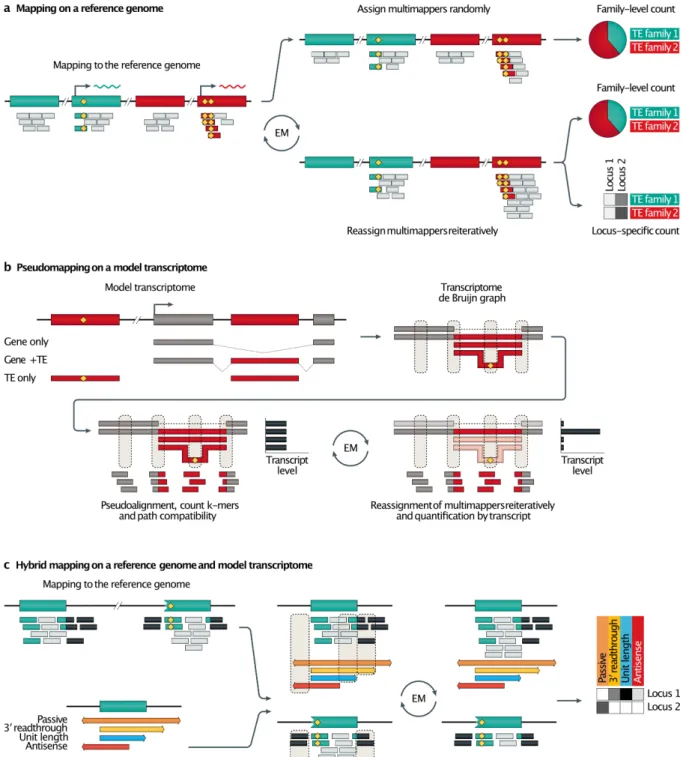
Mapping reads against a reference genome rather than consensus sequences provides a better picture of TE transcription. Many tools take advantage of general usage mapping softwares, such as Bowtie 2140, BWA141, TopHat142 or STAR143, and first discriminate
uniquely mapped reads from multi-mapped reads. Then, the strategies differ on the fate of multi-mapped reads. For example, RepEnrich realigns multi-mappers on a pseudo-genome containing all annotated and concatenated repeats of the genome of interest, providing a fractional value inversely proportional to the number of families with a match for this read144.
This approach seems to underestimate the expression levels of young elements in contrast to a strategy that randomly assigns multi-mappers to a genomic location among the best scoring loci134 (Fig. 5a). This bias may also result from Bowtie 1, the underlying mapping software
recommended by RepEnrich, which cannot align discordant reads or reads with small insertions and deletions (indels), and only outputs a limited number of fraction of all possible positions for multi-mapping reads145. By contrast, the TEcandidates pipeline first performs de novo transcriptome assembly to identify potentially expressed TE loci, then masks
non-expressed ones in the reference genome, and finally remaps multi-mapping reads on this masked genome with less mapping ambiguity146. However, the ability of this pipeline to
properly assemble TE transcriptomes, or to identify expressed loci among young TEs, has not yet been evaluated.
Another set of strategies consists of statistically reassigning multi-mapped reads according to the quantification of uniquely mapped reads131 (Fig. 5a). The application of the
expectation-maximization (EM) algorithm to this problem is a generalization of this rescue method, in which reassignment is achieved reiteratively with read count of both uni- and
multi-mappers at each step being used to reassign multi-multi-mappers at the following step, until convergence is achieved. Initially developed to identify isoform-specific transcription in RSEM147, it was subsequently incorporated in TEtranscripts148 and multiple other software for
TE transcriptome analysis (Table 1). Interestingly, EM-based algorithms have the potential to provide insights also into the structure and origin of TE transcripts (discussed below). Although TEtranscripts’ quantification is limited to the family-level, more recent tools such as SQuIRE145
or Telescope149 can provide locus-specific estimates, albeit with reduced confidence regarding
the youngest TE subfamilies145. Pseudo-alignment on a model transcriptome, as implemented
in Kallisto150 or Salmon151, can be a faster alternative to genome alignment (Fig. 5b). In short,
pseudo-alignments test the compatibility of read k-mers [G] with the k-mers extracted from all possible paths of a transcriptome de Bruijn Graph. Both SalmonTE152 and REdiscoverTE153
apply this method for the quantification of TE transcription. However, the SalmonTE transcriptome model is based on Repbase consensus sequences, whereas REdiscoverTE uses annotated TE sequences extracted from a reference genome and introduces alternative transcript models for co-transcription (see below). Thus, REdiscoverTE may provide more accurate quantification of full-length unit transcripts when TE genome annotations are available.
To summarize, random read assignment on best hits or EM-based softwares can provide consistent TE expression analysis at the family level. Nevertheless, identifying the exact expressed loci remains approximate, particularly for the youngest TE families.
TE sequence and insertional polymorphisms
In practice, the analysis of RNA-seq data invariably begins by mapping reads to a reference genome or transcriptome, which contains neither insertional polymorphisms nor internal sequence polymorphisms. For the youngest TE families, even uni-mapping reads can be ambiguous, as they may originate from an expressed locus not represented in the reference genome33,154 (Fig. 4b). Instead, they would map to the source element (if it is itself included in
the reference genome) or to a closely related element. Furthermore, discrimination of closely related sequences relies on a few internal and diagnostic SNPs in each TE locus. Sequence polymorphisms between individuals, as well as sequencing errors, add additional levels of variation, increasing mapping ambiguity of uni-mapping reads (Fig. 4c, discussed in132).
Although none of the methods described above take into consideration these various forms of polymorphisms, several elaborate solutions have been tried for human L1 elements. Philippe et al. first mapped the location of all full-length L1HS in the sample of interest by targeted DNA sequencing (ATLAS-seq), then identified among them the expressed copies by a signature combining active histone marks — that is, the histone 3 lysine 4 trimethylation (H3K4me3) chromatin immunoprecipitation followed by sequencing (ChIP-seq) signal — just
upstream of the element and 3’ readthrough transcription just downstream of it154. In this
approach, multi-mapping reads internal to the TE sequence are completely ignored. It is currently unclear if all L1HS loci have the potential to generate 3’-readthrough, which may represent a limitation of this approach. Indeed, some L1HS loci can be identified by L1EM65, a
software focused on L1 and based on the EM algorithm, as expressed but without readthrough in the flanking sequence. Nevertheless, it is also possible that these reads actually originated from related non-reference insertions not represented in the L1EM index and were thus misplaced. As more and more catalogues of polymorphic TE become available26,43,155,156, the
initial mapping step may become avoidable in the future99.
An alternative strategy was developed to identify and measure the expression of a polymorphic L1HS element responsible for a driver mutation in colon cancer33. This approach
also starts by mapping all L1HS elements in the genome of the patient by whole-genome short-read sequencing. Next, the entire set of non-reference full-length elements was fully sequenced by combining long-range PCR, and Sanger or long-read (PacBio) sequencing, enabling the inference of a unique signature of diagnostic SNPs for each of these 6 kb loci. Finally, RNA-seq reads spanning these internal polymorphisms were used to estimate the relative expression of each locus.
Of note, the coverage of SNPs diagnostic for a TE family rather than for a locus can also be used to estimate relative family-level expression154. Altogether, obtaining locus-specific
expression of non-reference TE copies remains a difficult and work-intensive objective that can to date be achieved only by multi-omics approaches (Table 1).
Co-transcription and pervasive transcription
When studying retrotransposition or its transcriptional regulation, distinguishing autonomous TE unit-length transcription from passive co-transcription with genes, including intron retention, or from pervasive intergenic transcription, is not a trivial task. Indeed, the vast majority of TE-derived RNA-seq reads originate from co-transcription or pervasive transcription99,100. Recent
efforts have tackled this problem. ERVmap uses an ad hoc curated database of full-length ERV elements and applies stringent criteria to filter ambiguous reads and low-mappability regions in ERVs157. Thus, this approach provides count quantification for each annotated
full-length ERV and partially integrates the coding capacity of the element but without differentiating autonomous from pervasive transcription. By contrast, TeXP100 applies a
correction based on mappability signatures from simulated pervasive and autonomous transcription to estimate family-level expression. Other corrective approaches include a modification of TEtranscripts that reduces the read count of intronic TEs proportionally to the coverage of their surrounding introns132, or to discard reads that overlap both TE and known
co-transcripts in the indexed transcriptome for Salmon pseudo-alignment153. Finally, L1EM
includes models for autonomous sense and antisense transcriptions, passive co-transcription and 3’ readthrough at each locus and can provide locus-specific expression values65 (Fig. 4c).
However, although generalizable, its current implementation focuses only on L1 elements. Manually curated data sets, as published for human L1s99,159, will be useful to further compare
and benchmark these recently developed software programs.
Identifying active promoters, either by genome-wide mapping of transcriptional start sites (TSS) using CAGE (Cap Analysis of Gene Expression)160,161 or RAMPAGE162, or by
integrating chromatin modifications154, can also help to distinguish autonomous from passive
TE transcription. Alternatively, 5’ or 3’ RACE (rapid amplification of cDNA ends) coupled to Sanger or high-throughput sequencing can define or confirm the boundaries of TE-containing RNA molecules and provide information on their locus of origin99,154,163-165. However, RACE
experiments are not quantitative.
TE-chimeric transcripts
TEs nearby or within genes can provide alternative promoters or polyadenylation signals, as well as alternative splice acceptor and donor sites, which can profoundly alter gene expression patterns of the host80,160,166-173. TE-chimeric transcripts are defined by a portion of the mature
transcript containing a TE fragment (Fig. 3c). Detecting these alternative transcripts, rarely included in common gene model datasets such as Refseq or GENCODE, relied initially on expressed sequence tag (EST) database computational screening against consensus repeat libraries78,79,174-178. More recently, tools such as CLIFinder179 and LIONS180 combined split
reads and discordant read pairs in RNA-seq paired-end libraries to systematically identify onco-exaptation events, where a TE provides an alternative promoter to a cellular gene leading to a novel oncogene or tumor suppressor gene isoform. TopHat-Fusion detects reads spanning gene and TE junctions to identify chimeric transcripts and can apply to both single and paired-end libraries181, but the number of false-positives is higher with single-end libraries.
In addition, de novo transcriptome assembly can successfully identify chimeric TE-transcripts, such as those leading to the expression of oncogenes173 or cancer-specific antigens172, in a
wide range of tumours. Techniques such as CAGE160,161 or RAMPAGE162 also permit detection
of possible lncRNAs. Finally, different strategies were developed to associate expressed TEs with a modification of nearby gene expression. For example, NearTrans associates differentially expressed TEs with differentially expressed genes182, and TEffectR is an R
package based on a linear regression model intended to statistically associate TE transcription with the expression of nearby genes183.
TE-derived dsRNA and small RNA
TE-derived dsRNA can lead to gene or TE silencing or to activation of the interferon response. Thus, quantifying pervasive transcription across genes or TEs is sometimes precisely what is being sought, and can be achieved by calculating the ratio between sense and antisense RNA at the features of interest in directional RNA-seq data111. More specific approaches have been
developed such as dsRNA-seq184, which enriches dsRNA by digestion of single-stranded RNA
and immunoprecipitation of dsRNA with a sequence-independent anti-dsRNA antibody, followed by sequencing. This approach was originally developed to identify viral dsRNAs. Candidate dsRNA-producing loci can be tested by RT-qPCR upon mild RNase A digestion, as dsRNA is more resistant than single-stranded RNA. This approach was used to confirm the presence of ERV dsRNAs induced upon treatment of cancer cells by demethylating agents113.
Similar to TE-derived dsRNAs, small RNAs (sRNAs), including miRNAs, short-interfering RNAs (siRNAs) or piRNAs, play central roles in regulating TEs185. Some challenges
are shared by both sRNA-seq and mRNA-seq analyses, such as mapping ambiguity or quantification186. However, sRNA-seq analysis in the context of repeated sequences has other
specificities that are detailed elsewhere186,187.
Future directions
In the near future, we anticipate that recent experimental or computational advances may greatly facilitate the study of TE expression. Graph-based mapping188-190 has emerged as a
new strategy to incorporate genetic variation (SNPs, indels and structural variants) found in the population into expanded model genomes, or pan-genomes, instead of consensus- or individual-based reference genomes191. Although not yet applied to TEs or to RNA-seq, this
approach could reveal the expression of polymorphic TEs, as well as reduce mapping errors due to their absence in conventional reference genomes.
So far, mass spectrometry approaches to study TE expression have been only minimally exploited but recent results seem promising. For example, by using a strategy named proteomics informed by transcriptomics (PIT), which combines de novo RNA-seq assembly with proteomics data, a repertoire of active TE has been characterized in the poorly annotated mosquito (Aedes aegypti) genome192. This proteomic approach has high potential
to identify biologically active proteins derived from TEs and to provide an overview of the transposition activity in a given condition or sample (reviewed in193). Similarly, mass
spectrometry approaches and mining mass-spectrometry databases has permitted to validate the presence of predicted chimeric TE-derived peptides in tumours or primate embryonic stem cells153 or to confirm L1 expression in human cancers194.
Single cell RNA-seq (scRNA-seq) experiments open the possibility to evaluate TE transcriptional heterogeneity in cell populations, especially in cancer tissues or in the brain, which could provide new insights into the mechanisms of TE activation195,42. However, the
issues described above for conventional RNA-seq are still valid and can even be more acute. For example, the requirement for nuclear fractionation when analysing neurons with scRNA-seq leads to a large fraction of intronic reads and may obscure autonomous TE transcription. The study of TE expression will also undoubtedly benefit from long-read single molecule sequencing technologies, such as those provided by PacBio or Oxford Nanopore196.
Full-length RNA-seq could considerably reduce the proportion of ambiguously mapped reads, at least in theory, and could provide locus-specific expression levels. This strategy has the potential to reveal the nature of the expressed transcripts, including co-transcripts or chimeric transcripts. A first proof-of-principle was obtained in the migratory locust, Locusta migratoria, which possesses one of the largest sequenced genome (6.5 Gb). Full-length cDNA nanopore sequencing revealed a high proportion of exonized TEs in this organism197. PacBio sequencing
of fairly long and bulk 5’-RACE products derived from L1 elements in human cell lines was also useful in facilitating the identification of loci producing L1 full-length unit transcripts99.
Coupling whole-genome DNA sequencing and de novo assembly with full-length RNA-seq can aid in taking into account RNA-sequence and insertional polymorphisms in TE transcriptomics studies. Indeed, long-read sequencing can significantly improve the detection of polymorphic TEs, particularly in low-complexity or repeated regions of the genome198,199. In
addition, direct single-molecule sequencing can identify DNA modifications associated with the epigenetic regulation of TEs200-203. The promises of long-read sequencing are currently
hampered by error rates that can far exceed the sequence divergence between TE loci. Thus, error correction methods, such as consensus-based error correction through rolling-circle amplification, tandem sequencing of both strands, or tagging with unique molecular identifiers, must be applied before these techniques can be employed successfully to study TE expression204,205.
Conclusions
Studies of TE transcription face three major difficulties: mappability, polymorphisms and transcript identity (Fig. 6). Clearly, some of these difficulties are also encountered with other sequencing approaches when studying TEs, and can be even more pronounced (discussed in42). For example, in bisulfite sequencing experiments to profile cytosine methylation, reads
have reduced sequence complexity due to the chemical treatment, and are notoriously difficult to map to TEs42. Recent years have seen exciting advances in sequencing and computational
developments have boosted investigations into TE expression, shedding light on an entire new world of regulatory processes206. Nevertheless, none of the tools or approaches described
here can bring a comprehensive solution on its own. Ultimately, the questions investigated should guide experimental design and subsequent analyses. Table 1 highlights the key features and limitations of different strategies. Integrating complementary methods or strategies, always in light of the specific aspect of TE biology that is being investigated, remains the best strategy for assessing and interpreting TE expression at the moment.
References
1. Chénais, B., Caruso, A., Hiard, S. & Casse, N. The impact of transposable elements on
eukaryotic genomes: From genome size increase to genetic adaptation to stressful environments. Gene 509, 7–15 (2012).
2. Lisch, D. How important are transposons for plant evolution? Nat. Rev. Genet. 14, 49–61
(2013).
3. Faulkner, G. J. & Garcia-Perez, J. L. L1 Mosaicism in mammals: extent, effects, and
evolution. Trends in Genetics 33, 802–816 (2017).
4. Chuong, E. B., Elde, N. C. & Feschotte, C. Regulatory activities of transposable elements:
from conflicts to benefits. Nat. Rev. Genet. 18, 71–86 (2017).
5. Payer, L. M. & Burns, K. H. Transposable elements in human genetic disease. Nat. Rev.
Genet. 20, 760–772 (2019).
6. Tam, O. H., Ostrow, L. W. & Gale Hammell, M. Diseases of the nERVous system:
retrotransposon activity in neurodegenerative disease. Mob. DNA 10, 32 (2019). 7. Sotero-Caio, C. G., Platt, R. N., II, Suh, A. & Ray, D. A. Evolution and diversity of
transposable elements in vertebrate genomes. Genome Biol. Evol. 9, 161–177 (2017).
8. Cho, J. & Paszkowski, J. Regulation of rice root development by a retrotransposon acting as
a microRNA sponge. eLife 6, 796 (2017).
9. Brattås, P. L. et al. TRIM28 controls a gene regulatory network based on endogenous
retroviruses in human neural progenitor cells. Cell Rep. 18, 1–11 (2017).
10. Petri, R. et al. LINE-2 transposable elements are a source of functional human microRNAs
and target sites. PLoS Genet. 15, e1008036 (2019).
11. Kashkush, K., Feldman, M. & Levy, A. A. Transcriptional activation of retrotransposons alters the expression of adjacent genes in wheat. Nat. Genet. 33, 102–106 (2003).
12. Percharde, M. et al. A LINE1-nucleolin partnership regulates early development and ESC
identity. Cell 174, 391–405.e19 (2018).
13. Conte, C., Dastugue, B. & Vaury, C. Promoter competition as a mechanism of transcriptional
interference mediated by retrotransposons. EMBO J. 21, 3908–3916 (2002).
14. Jachowicz, J. W. et al. LINE-1 activation after fertilization regulates global chromatin accessibility in the early mouse embryo. Nat. Genet. 49, 1502–1510 (2017).
of autoimmunity. Cell 134, 587–598 (2008).
16. Aravin, A. A. et al. Double-stranded RNA-mediated silencing of genomic tandem repeats and
transposable elements in the D. melanogaster germline. Curr. Biol. 11, 1017–1027 (2001).
17. De Cecco, M. et al. L1 drives IFN in senescent cells and promotes age-associated
inflammation. Nature 566, 73–78 (2019).
18. Goic, B. et al. RNA-mediated interference and reverse transcription control the persistence of
RNA viruses in the insect model Drosophila. Nat. Immunol. 14, 396–403 (2013).
19. Bourgeois, Y. & Boissinot, S. On the population dynamics of junk: a review on the population
genomics of transposable elements. Genes 10, 419–423 (2019).
20. Khan, H., Smit, A. & Boissinot, S. Molecular evolution and tempo of amplification of human
LINE-1 retrotransposons since the origin of primates. Genome Res. 16, 78–87 (2006).
21. Huang, C. R. L., Burns, K. H. & Boeke, J. D. Active transposition in genomes. Annu. Rev.
Genet. 46, 651–675 (2012).
22. Mills, R. E., Bennett, E. A., Iskow, R. C. & Devine, S. E. Which transposable elements are active in the human genome? Trends Genet. 23, 183–191 (2007).
23. Brouha, B. et al. Hot L1s account for the bulk of retrotransposition in the human population.
Proc. Natl. Acad. Sci. U.S.A. 100, 5280–5285 (2003).
24. Beck, C. R. et al. LINE-1 retrotransposition activity in human genomes. Cell 141, 1159–1170
(2010).
25. Tubio, J. M. C. et al. Extensive transduction of nonrepetitive DNA mediated by L1
retrotransposition in cancer genomes. Science 345, 1251343–1251343 (2014).
Tubio et al. (2014), Gardner et al. (2017) and Rodriguez-Martin et al. (2020) identify progenitor L1 elements active in humans from whole genome sequencing using 3’ transductions and internal SNPs in L1 sequences.
26. Gardner, E. J. et al. The Mobile Element Locator Tool (MELT): population-scale mobile
element discovery and biology. Genome Res. 27, 1916–1929 (2017).
27. Rodriguez-Martin, B. et al. Pan-cancer analysis of whole genomes identifies driver
rearrangements promoted by LINE-1 retrotransposition. Nat. Genet. 52, 306–319 (2020).
28. Deininger, P. L., Batzer, M. A., Hutchison, C. A. & Edgell, M. H. Master genes in mammalian
repetitive DNA amplification. Trends Genet. 8, 307–311 (1992).
29. Jacobs, F. M. J. et al. An evolutionary arms race between KRAB zinc-finger genes ZNF91/93
and SVA/L1 retrotransposons. Nature 516, 242–245 (2014).
30. Imbeault, M., Helleboid, P.-Y. & Trono, D. KRAB zinc-finger proteins contribute to the evolution of gene regulatory networks. Nature 543, 550–554 (2017).
31. Sanchez-Luque, F. J. et al. LINE-1 evasion of epigenetic repression in humans. Mol. Cell 75,
590–604.e12 (2019).
Sanchez-Luque et al. (2019) and Seleme et al. (2006) show that a given L1 locus can exhibit internal sequence variation leading to differences of retrotransposition activity between individuals.
of an active family of L1 retrotransposons in humans. Genome Res. 14, 1221–1231 (2004).
33. Scott, E. C. et al. A hot L1 retrotransposon evades somatic repression and initiates human
colorectal cancer. Genome Res. 26, 745–755 (2016).
This study resequenced all non-reference L1 elements in a colon cancer case to identify internal diagnostic SNPs and subsequently which elements are expressed in the sample.
34. Chalopin, D., Naville, M., Plard, F., Galiana, D. & Volff, J.-N. Comparative analysis of transposable elements highlights mobilome diversity and evolution in vertebrates. Genome
Biol. Evol. 7, 567–580 (2015).
35. Quadrana, L. et al. The Arabidopsis thaliana mobilome and its impact at the species level.
eLife 5, e15716 (2016).
36. McCullers, T. J. & Steiniger, M. Transposable elements in Drosophila. Mob Genet. Elements
7, 1–18 (2017).
37. Vitte, C. & Panaud, O. LTR retrotransposons and flowering plant genome size: emergence of
the increase/decrease model. Cytogenet Genome Res. 110, 91–107 (2005).
38. Hawkins, J. S., Proulx, S. R., Rapp, R. A. & Wendel, J. F. Rapid DNA loss as a
counterbalance to genome expansion through retrotransposon proliferation in plants. Proc.
Natl. Acad. Sci. U.S.A. 106, 17811–17816 (2009).
39. Kapusta, A., Suh, A. & Feschotte, C. Dynamics of genome size evolution in birds and
mammals. Proc. Natl. Acad. Sci. U.S.A. 114, E1460–E1469 (2017).
Kapusta et al. (2017) and Kelley et al. (2012) discovered that a large fraction of long-non-coding RNA (lncRNA) derives from TEs in Vertebrates.
40. Goerner-Potvin, P. & Bourque, G. Computational tools to unmask transposable elements.
Nat. Rev. Genet. 19, 688–704 (2018).
41. Vendrell-Mir, P. et al. A benchmark of transposon insertion detection tools using real data.
Mob. DNA 10, 53 (2019).
42. O'Neill, K., Brocks, D. & Hammell, M. G. Mobile genomics: tools and techniques for tackling
transposons. Philos. Trans. R. Soc. Lond. B. Biol. Sci. 375, 20190345 (2020).
43. Sudmant, P. H. et al. An integrated map of structural variation in 2,504 human genomes.
Nature 526, 75–81 (2015).
44. Ewing, A. D. & Kazazian, H. H. High-throughput sequencing reveals extensive variation in
human-specific L1 content in individual human genomes. Genome Res. 20, 1262–1270 (2010).
45. Maksakova, I. A. et al. Retroviral elements and their hosts: insertional mutagenesis in the
mouse germ line. PLoS Genet. 2, e2 (2006).
46. Zhang, Y., Maksakova, I. A., Gagnier, L., van de Lagemaat, L. N. & Mager, D. L.
Genome-wide assessments reveal extremely high levels of polymorphism of two active families of mouse endogenous retroviral elements. PLoS Genet. 4, e1000007 (2008).
47. Nellåker, C. et al. The genomic landscape shaped by selection on transposable elements
48. Richardson, S. R. et al. Heritable L1 retrotransposition in the mouse primordial germline and early embryo. Genome Res. 27, 1395–1405 (2017).
49. Carpentier, M.-C. et al. Retrotranspositional landscape of Asian rice revealed by 3000
genomes. Nat. Commun. 10, 24 (2019).
50. Feusier, J. et al. Pedigree-based estimation of human mobile element retrotransposition
rates. Genome Res. 29, 1567–1577 (2019).
51. Rech, G. E. et al. Stress response, behavior, and development are shaped by transposable
element-induced mutations in Drosophila. PLoS Genet. 15, e1007900 (2019).
52. González, J., Karasov, T. L., Messer, P. W. & Petrov, D. A. Genome-wide patterns of
adaptation to temperate environments associated with transposable elements in Drosophila.
PLoS Genet. 6, e1000905 (2010).
53. Payer, L. M. et al. Structural variants caused by Alu insertions are associated with risks for
many human diseases. Proc. Natl. Acad. Sci. U.S.A. 114, E3984–E3992 (2017).
54. Kazazian, H. H., Jr. & Moran, J. V. Mobile DNA in health and disease. N. Engl. J. Med. 377,
361–370 (2017).
55. Seleme, M. D. C. et al. Extensive individual variation in L1 retrotransposition capability
contributes to human genetic diversity. Proc. Natl. Acad. Sci. U.S.A. 103, 6611–6616 (2006).
56. Swergold, G. D. Identification, characterization, and cell specificity of a human LINE-1
promoter. Mol. Cell. Biol. 10, 6718–6729 (1990).
57. Thompson, P. J., Macfarlan, T. S. & Lorincz, M. C. Long terminal repeats: from parasitic elements to building blocks of the transcriptional regulatory repertoire. Mol. Cell 62, 766–776 (2016).
58. Mighell, A. J., Markham, A. F. & Robinson, P. A. Alu sequences. FEBS Lett. 417, 1–5 (1997).
59. Hancks, D. C., Ewing, A. D., Chen, J. E., Tokunaga, K. & Kazazian, H. H. Exon-trapping
mediated by the human retrotransposon SVA. Genome Res. 19, 1983–1991 (2009).
60. Honigman, A., Bar-Shira, A., Silberberg, H. & Panet, A. Generation of a uniform 3' end RNA
of murine leukemia virus. J. Virol. 53, 330–334 (1985).
61. Dombroski, B. A., Mathias, S. L., Nanthakumar, E., Scott, A. F. & Kazazian, H. H. Isolation of an active human transposable element. Science 254, 1805–1808 (1991).
62. Conti, A. et al. Identification of RNA polymerase III-transcribed Alu loci by computational
screening of RNA-Seq data. Nucleic Acids Res. 43, 817–835 (2014).
63. Holmes, S. E., Dombroski, B. A., Krebs, C. M., Boehm, C. D. & Kazazian, H. H. A new
retrotransposable human L1 element from the LRE2 locus on chromosome 1q produces a chimaeric insertion. Nat. Genet. 7, 143–148 (1994).
64. Moran, J. V., DeBerardinis, R. J. & Kazazian, H. H. Exon shuffling by L1 retrotransposition.
Science 283, 1530–1534 (1999).
65. McKerrow, W. & Fenyö, D. L1EM: A tool for accurate locus specific LINE-1 RNA
quantification. Bioinformatics 544, 115 (2019).
66. Pickeral, O. K., Makałowski, W., Boguski, M. S. & Boeke, J. D. Frequent human genomic
67. Goodier, J. L., Ostertag, E. M. & Kazazian, H. H. Transduction of 3'-flanking sequences is common in L1 retrotransposition. Hum. Mol. Genet. 9, 653–657 (2000).
68. Lander, E. S. et al. Initial sequencing and analysis of the human genome. Nature 409, 860–
921 (2001).
69. Evrony, G. D. et al. Single-neuron sequencing analysis of L1 retrotransposition and somatic
mutation in the human brain. Cell 151, 483–496 (2012).
70. Damert, A. et al. 5'-Transducing SVA retrotransposon groups spread efficiently throughout
the human genome. Genome Res. 19, 1992–2008 (2009).
71. Eickbush, D. G. & Eickbush, T. H. R2 retrotransposons encode a self-cleaving ribozyme for
processing from an rRNA cotranscript. Mol. Cell. Biol. 30, 3142–3150 (2010).
72. Perepelitsa-Belancio, V. & Deininger, P. RNA truncation by premature polyadenylation
attenuates human mobile element activity. Nat. Genet. 35, 363–366 (2003).
73. Schrom, E.-M., Moschall, R., Schuch, A. & Bodem, J. Regulation of retroviral
polyadenylation. Adv. Virus Res. 85, 1–24 (2013).
74. Belancio, V. P., Hedges, D. J. & Deininger, P. LINE-1 RNA splicing and influences on
mammalian gene expression. Nucleic Acids Res. 34, 1512–1521 (2006).
75. Teixeira, F. K. et al. PiRNA-mediated regulation of transposon alternative splicing in the
soma and germ line. Nature 552, 268–272 (2017).
76. Kines, K. J., Sokolowski, M., DeHaro, D. L., Christian, C. M. & Belancio, V. P. Potential for genomic instability associated with retrotranspositionally-incompetent L1 loci. Nucleic Acids
Res. 42, 10488–10502 (2014).
77. Saha, A. et al. A trans-dominant form of Gag restricts Ty1 retrotransposition and mediates
copy number control. J. Virol. 89, 3922–3938 (2015).
78. Speek, M. Antisense promoter of human L1 retrotransposon drives transcription of adjacent
cellular genes. Mol. Cell. Biol. 21, 1973–1985 (2001).
79. Cruickshanks, H. A. & Tufarelli, C. Isolation of cancer-specific chimeric transcripts induced by hypomethylation of the LINE-1 antisense promoter. Genomics 94, 397–406 (2009).
80. Weber, B., Kimhi, S., Howard, G., Eden, A. & Lyko, F. Demethylation of a LINE-1 antisense
promoter in the cMet locus impairs Met signalling through induction of illegitimate transcription. Oncogene 29, 5775–5784 (2010).
81. Li, J. et al. An antisense promoter in mouse L1 retrotransposon open reading frame-1
initiates expression of diverse fusion transcripts and limits retrotransposition. Nucleic Acids
Res. 42, 4546–4562 (2014).
82. Denli, A. M. et al. Primate-Specific ORF0 Contributes to Retrotransposon-Mediated Diversity.
Cell 163, 583–593 (2015).
The first study to use mass-spectrometry data on a large-scale to identify unknown TE chimeric proteins.
83. Russo, J., Harrington, A. W. & Steiniger, M. Antisense Transcription of Retrotransposons in Drosophila: An Origin of Endogenous Small Interfering RNA Precursors. Genetics 202, 107– 121 (2016).
84. Harrington, A. W. & Steiniger, M. Bioinformatic analyses of sense and antisense expression from terminal inverted repeat transposons in Drosophila somatic cells. FLY 10, 1–10 (2016).
85. Zingler, N. et al. Analysis of 5‘ junctions of human LINE-1 and Alu retrotransposons suggests
an alternative model for 5’-end attachment requiring microhomology-mediated end-joining.
Genome Res. 15, 780–789 (2005).
86. Suzuki, J. et al. Genetic evidence that the non-homologous end-joining repair pathway is
involved in LINE retrotransposition. PLoS Genet. 5, e1000461 (2009).
87. Larson, P. A. et al. Spliced integrated retrotransposed element (SpIRE) formation in the
human genome. PLoS Biol. 16, e2003067 (2018).
88. Penzkofer, T. et al. L1Base 2 - more retrotransposition-active LINE-1s, more mammalian
genomes. Nucleic Acids Res. 45, D68–D73 (2017).
89. Wirth, T., Glöggler, K., Baumruker, T., Schmidt, M. & Horak, I. Family of middle repetitive DNA sequences in the mouse genome with structural features of solitary retroviral long terminal repeats. Proc. Natl. Acad. Sci. U.S.A. 80, 3327–3330 (1983).
90. Mager, D. L. & Goodchild, N. L. Homologous recombination between the LTRs of a human
retrovirus-like element causes a 5-kb deletion in two siblings. Am. J. Hum. Genet.. 45, 848– 854 (1989).
91. Vitte, C. & Panaud, O. Formation of solo-LTRs through unequal homologous recombination
counterbalances amplifications of LTR retrotransposons in rice Oryza sativa L. Mol. Biol.
Evol. 20, 528–540 (2003).
92. Cossu, R. M. et al. LTR Retrotransposons show low levels of unequal recombination and
high rates of intraelement gene conversion in large plant genomes. Genome Biol. Evol. 9, 3449–3462 (2017).
93. Rebollo, R., Farivar, S. & Mager, D. L. C-GATE - catalogue of genes affected by
transposable elements. Mob. DNA 3, 9 (2012).
94. Kelley, D. & Rinn, J. Transposable elements reveal a stem cell-specific class of long noncoding RNAs. Genome Biol. 13, R107 (2012).
95. Kapusta, A. et al. Transposable elements are major contributors to the origin, diversification,
and regulation of vertebrate long noncoding RNAs. PLoS Genet. 9, e1003470 (2013).
96. Lu, X. et al. The retrovirus HERVH is a long noncoding RNA required for human embryonic
stem cell identity. Nat. Struct. Mol. Biol. 21, 423–425 (2014).
97. Wang, J. et al. Primate-specific endogenous retrovirus-driven transcription defines naive-like
stem cells. Nature 516, 405–409 (2014).
98. Izsvák, Z., Wang, J., Singh, M., Mager, D. L. & Hurst, L. D. Pluripotency and the endogenous
retrovirus HERVH: conflict or serendipity? BioEssays 38, 109–117 (2015).
99. Deininger, P. et al. A comprehensive approach to expression of L1 loci. Nucleic Acids Res.
45, e31 (2017).
100. Navarro, F. C. P. et al. TeXP: Deconvolving the effects of pervasive and autonomous
transcription of transposable elements. PLoS Comput. Biol. 15, e1007293 (2019).
484 (2013).
102. Lee, H., Zhang, Z. & Krause, H. M. Long noncoding RNAs and repetitive elements: junk or
intimate evolutionary partners? Trends Genet. 35, 892–902 (2019).
103. Kim, T.-K., Hemberg, M. & Gray, J. M. Enhancer RNAs: a class of long noncoding RNAs
synthesized at enhancers. Cold Spring Harb Perspect Biol 7, a018622 (2015).
104. Wassenegger, M., Heimes, S., Riedel, L. & Sänger, H. L. RNA-directed de novo methylation
of genomic sequences in plants. Cell 76, 567–576 (1994).
105. Fire, A. et al. Potent and specific genetic interference by double-stranded RNA in
Caenorhabditis elegans. Nature 391, 806–811 (1998).
106. Yang, N. & Kazazian, H. H. L1 retrotransposition is suppressed by endogenously encoded
small interfering RNAs in human cultured cells. Nat. Struct. Mol. Biol. 13, 763–771 (2006).
107. Slotkin, R. K. et al. Epigenetic reprogramming and small RNA silencing of transposable
elements in pollen. Cell 136, 1451–1454 (2009).
108. Heras, S. R. et al. The Microprocessor controls the activity of mammalian retrotransposons.
Nat. Struct. Mol. Biol. 20, 1173–1181 (2013).
109. Cuerda-Gil, D. & Slotkin, R. K. Non-canonical RNA-directed DNA methylation. Nat. Plants2,
567–8 (2016).
110. van de Lagemaat, L. N., Medstrand, P. & Mager, D. L. Multiple effects govern endogenous
retrovirus survival patterns in human gene introns. Genome Biol. 7, R86 (2006).
111. Berrens, R. V. et al. An endosiRNA-based repression mechanism counteracts transposon
activation during global DNA demethylation in embryonic stem cells. Stem Cell 21, 694– 703.e7 (2017).
112. Gong, C., Tang, Y. & Maquat, L. E. mRNA-mRNA duplexes that autoelicit Staufen1-mediated
mRNA decay. Nat. Struct. Mol. Biol. 20, 1214–1222 (2013).
113. Roulois, D. et al. DNA-demethylating agents target colorectal cancer cells by inducing viral
mimicry by endogenous transcripts. Cell 162, 961–973 (2015).
Roulois et al. (2015), Chiappinelli et al. (2015) and Brocks et al. (2016) reveal
mechanisms by which the reactivation of transposable elements with drugs targeting epigenetic pathway can kill cancer cells.
114. Chiappinelli, K. B. et al. Inhibiting DNA methylation causes an interferon response in cancer
via dsRNA including endogenous retroviruses. Cell 162, 974–986 (2015).
115. Skowronski, J. & Singer, M. F. Expression of a cytoplasmic LINE-1 transcript is regulated in a human teratocarcinoma cell line. Proc. Natl. Acad. Sci. U.S.A. 82, 6050–6054 (1985).
116. Belancio, V. P., Roy-Engel, A. M., Pochampally, R. R. & Deininger, P. Somatic expression of
LINE-1 elements in human tissues. Nucleic Acids Res. 38, 3909–3922 (2010).
Together with Deininger et al. (2017), this work shows that the majority of L1 RNA detected in somatic cells is not unit-length RNA but rather truncated L1 RNA or derives from co-transcription or pervasive transcription.
117. Morillon, A., Bénard, L., Springer, M. & Lesage, P. Differential effects of chromatin and Gcn4 on the 50-fold range of expression among individual yeast Ty1 retrotransposons. Mol. Cell.