HAL Id: inserm-01264511
https://www.hal.inserm.fr/inserm-01264511
Submitted on 29 Jan 2016
HAL is a multi-disciplinary open access
archive for the deposit and dissemination of
sci-entific research documents, whether they are
pub-lished or not. The documents may come from
teaching and research institutions in France or
abroad, or from public or private research centers.
L’archive ouverte pluridisciplinaire HAL, est
destinée au dépôt et à la diffusion de documents
scientifiques de niveau recherche, publiés ou non,
émanant des établissements d’enseignement et de
recherche français ou étrangers, des laboratoires
publics ou privés.
A systematic review of determinants of sedentary
behaviour in youth: a DEDIPAC-study
Annabel Stierlin, Sara de Lepeleere, Greet Cardon, Patricia Dargent-Molina,
Belinda Hoffmann, Marie Murphy, Aileen Kennedy, Grainne O’donoghue,
Sebastien Chastin, Marieke de Craemer
To cite this version:
Annabel Stierlin, Sara de Lepeleere, Greet Cardon, Patricia Dargent-Molina, Belinda Hoffmann, et
al.. A systematic review of determinants of sedentary behaviour in youth: a DEDIPAC-study.
Inter-national Journal of Behavioral Nutrition and Physical Activity, BioMed Central, 2015, 12 (1), pp.133.
�10.1186/s12966-015-0291-4�. �inserm-01264511�
R E V I E W
Open Access
A systematic review of determinants of
sedentary behaviour in youth: a
DEDIPAC-study
Annabel S. Stierlin
1,2†, Sara De Lepeleere
3†, Greet Cardon
3, Patricia Dargent-Molina
4,9, Belinda Hoffmann
5,
Marie H. Murphy
6, Aileen Kennedy
7, Grainne O
’Donoghue
7, Sebastien FM Chastin
8, Marieke De Craemer
3*and on behalf of the DEDIPAC consortium
Abstract
Sedentary behaviour (SB) has emerged as a potential risk factor for metabolic health in youth. Knowledge on the determinants of SB in youth is necessary to inform future intervention development to reduce SB. A systematic review was conducted to identify predictors and determinants of SB in youth. Pubmed, Embase, CINAHL, PsycINFO and Web of Science were searched, limiting to articles in English, published between January 2000 and May 2014. The search strategy was based on four key elements and their synonyms: (a) sedentary behaviour, (b) determinants, (c) types of sedentary behaviours, (d) types of determinants. The full protocol is available from PROSPERO (PROSPERO 2014:CRD42014009823). Cross-sectional studies were excluded. The analysis was guided by the socio-ecological model. 37 studies were selected out of 2654 identified papers from the systematic literature search. Most studies were conducted in Europe (n = 13), USA (n = 11), and Australia (n = 10). The study quality, using the Qualsyst tool, was high with a median of 82 % (IQR: 74–91 %). Multiple potential determinants were studied in only one or two studies. Determinants were found at the individual, interpersonal, environmental and policy level but few studies examined a comprehensive set of factors at different levels of influences. Evidence was found for age being positively associated with total SB, and weight status and baseline assessment of screen time being positively associated with screen time (at follow-up). A higher playground density and a higher availability of play and sports equipment at school were consistently related to an increased total SB, although these consistent findings come from single studies. Evidence was also reported for the presence of safe places to cross roads and lengthening morning and lunch breaks being associated with less total SB. Future interventions to decrease SB levels should especially target children with
overweight or obesity and should start at a young age. However, since the relationship of many determinants with SB remains inconsistent, there is still a need for more longitudinal research on determinants of SB in youth.
Keywords: Children, Adolescents, Youth, Sedentary behaviour, Screen time, Sitting, Determinant Introduction
Although the evidence is still inconsistent [1], high levels of sedentary behaviour (SB) in youth (<18 year) may be associated with cardiometabolic health, poorer mental health and lower bone mineral content [2–10]. Several studies have shown that a lot of children spend most of their time being sedentary. For example, 10–12 year old
European children spend approximately 8 h being seden-tary during the day [11]. Furthermore, the ENERGY-study showed that European children spent on average more than 2 h/day in front of screens (TV and computer activ-ities) [12], despite the current guidelines which
recom-mend ≤2 h/day of recreational screen time [13]. A
narrative review on SB in adolescents reported that screen-based behaviour ranges from 2 to 4 h per day and total SB ranged from 5 to 10 h per day [14]. Additionally, there is evidence that SB tracks from childhood into adult-hood [15, 16], and the evidence for ill health effects of SB
* Correspondence:[email protected]
†Equal contributors 3
Department of Movement and Sports Sciences, Ghent University, Ghent, Belgium
Full list of author information is available at the end of the article
© 2015 Stierlin et al. Open Access This article is distributed under the terms of the Creative Commons Attribution 4.0 International License (http://creativecommons.org/licenses/by/4.0/), which permits unrestricted use, distribution, and reproduction in any medium, provided you give appropriate credit to the original author(s) and the source, provide a link to the Creative Commons license, and indicate if changes were made. The Creative Commons Public Domain Dedication waiver (http://creativecommons.org/publicdomain/zero/1.0/) applies to the data made available in this article, unless otherwise stated. Stierlin et al. International Journal of Behavioral Nutrition
and Physical Activity (2015) 12:133 DOI 10.1186/s12966-015-0291-4
among adults is strong [17]. This highlights the import-ance of youth as an important life stage for addressing SB.
Several interventions to decrease children’s sedentary time have been carried out, but most effects were small [18, 19]. Information on the association between specific determinants and SB, together with the modifiability of those determinants, could guide and inform future inter-ventions targeting SB in youth. To structure the study of these determinants, the socio-ecological model can be used, which places the individual within an ecosystem [17, 20]. Furthermore, the review by Uijtdewilligen et al. (2011), which investigated the determinants of physical ac-tivity and sedentary behaviour in young people (4–18 years old), found insufficient evidence for determinants of seden-tary behaviour [21]. Additionally, to date there is no sum-mary of available evidence about the determinants of SB in youth that spans the whole age range of 0 to 18 years based on this socio-ecological model. Therefore, the aim of this study is to systematically review the literature regarding potential determinants of SB in children under the age of 18 within a social-ecological perspective. This systematic review is one of three reviews (one in youth (<18 years old), one in adults (18–65 years old) and one in older adults (>65 years old)) performed as part of the DEDIPAC (DEterminants of DIet and Physical ACtivity) study [22].
Review
Methods
A common protocol for the three DEDIPAC systematic literature reviews across the life course (youth, adults, older adults) was developed and is available from PROS-PERO (PROSPROS-PERO 2014:CRD42014009823).
Search strategy
A systematic literature search was conducted in five electronic databases (Pubmed, Embase, CINAHL with full text, PsycINFO and Web of Science) to detect stud-ies investigating determinants of SB in youth (<18 year old) published between January 2000 and May 2014.
The search strategy was based on four key elements (see Additional file 1): (a) SB and its synonyms (e.g. sedentari-ness); (b) determinants and its synonyms (e.g. correlates, factors); (c) types of SB (e.g. TV viewing, gaming); and (d) possible determinants of SB (e.g. environmental, behav-ioural). Terms referring to these four elements were used as MESH-headings and title or abstract words in all data-bases. The initial search was performed by one researcher (GOD) familiar with the principles of systematic reviewing and searching bibliographic databases for this purpose. De-tails of the search strategy are shown in Additional file 1. After running the search strategy in each database, dupli-cates were identified and removed. Two independent re-viewers (AS and SDL) screened studies by title and abstract to determine their eligibility for inclusion. In case of
disagreement, a third reviewer (AK) was asked to reach a decision. Full texts were divided equally and screened by one of two researchers (AS and SDL). In addition, other ex-perts in this research area were contacted to identify add-itional relevant determinant studies (e.g. articles from the author group working on determinants of SB in adults which appeared to belong to the children’s results) and backward reference tracking was undertaken for the in-cluded articles (MDC). Articles obtained this way were subjected to the same selection process as the articles found initially. Two authors (AS and SDL) extracted data independently and subsequently, three reviewers (AS, SDL and BH) undertook cross checking and har-monisation of extracted data. Discrepancies were re-solved through discussion.
Selection of studies
The literature search was limited to articles published in English. Reviews, editorials, commentaries, letters to the editor, personal views, conference papers, protocols, multi-component intervention studies, and studies focus-ing on patient groups, were excluded. Furthermore, stud-ies with only cross-sectional analyses were excluded since they do only provide information on association, and not on prediction or causation [23]. To be eligible for inclu-sion, studies had to meet the following criteria. Firstly, studies had to investigate at least one possible determinant of SB. Secondly, the mean age of the study sample at follow-up had to be lower than 18 years. Thirdly, studies were included if they assessed (1) total SB time, or (2) sub-domains of SB such as time spent watching TV, screen time, homework, reading, etc. Studies using subjectively (e.g. questionnaire) and objectively (e.g. accelerometry) measured SB were included (cut off point for accelerome-try determined SB: <100 counts per minute (CPM) [24]).
Data extraction
A standardized template was used to extract data from the included studies using the following headings: general information, sample characteristics, study characteristics, outcome measures, determinants, statistical analysis, re-sults and general findings/comments. The data extraction
tool was based on the recommendations from‘the Centre
for Reviews and Dissemination guidance handbook for undertaking systemic literature review in healthcare’ [25].
Association and classification of determinants
When specific age groups were studied, youth was catego-rized as follows (1) toddlers and preschoolers (0–5 years old), (2) primary schoolchildren (6–12 years old), and (3) adolescents (13–17 years old). The determinants of SB were classified across four levels using the social-ecological framework applied by Sallis et al. (2008) [20] (i) individual (biological/genetic, psychological/behavioural);
Stierlin et al. International Journal of Behavioral Nutrition and Physical Activity (2015) 12:133
(ii) interpersonal (social, cultural), (iii) environmental (micro, macro) and (iv) policy (industry, government).
To determine the consistency of association of each deter-minant with either total SB or screen time, the model used by Sallis et al. (2000) [26], was applied (see Table 1). In this model, the consistency regarding the association of a deter-minant with SB is based on the percentage of reported find-ings that support the hypothesized association measured by the number of findings supporting the association divided by the total number of findings where the association was mentioned. The result was defined as‘no evidence’ (coded with a‘0’) if the percentage of the findings supporting the association was between 0 and 33 %; as‘inconsistent evi-dence’ (coded with a ‘?’) if the percentage of the findings supporting the association was between 34 and 59 %; and as a‘consistent association’ (coded with a ‘+’ or ‘-’) if the per-centage of the findings supporting the hypothesized associ-ation was between 60 and 100 %. In addition, when four or more studies supported the association, the result was coded as‘++’ or ‘- -’; and when four or more studies failed to show an association, the result was coded as‘00’.
Risk of bias
To assess the risk of bias, the quality assessment tool ‘QUALSYST’ from the “Standard Quality Assessment Criteria for Evaluating Primary Research Papers from a Variety of Fields” (Alberta Heritage Foundation for Med-ical Research) was applied [27]. With this pragmatic tool, 14 items of each quantitative study, were scored on the study and outcome levels depending on the degree to which the specific criteria were met or reported (“yes” = 2, “partial” = 1, “no” = 0). Items not applicable to a particular
study design were marked“n/a” and were excluded from
the calculation of the summary score. A percentage was calculated for each paper by dividing the total sum score obtained across rated items by the total possible score (see Additional file 2). The quality of the included articles was assessed by two independent reviewers (AS and SDL). In case of disagreement, the two reviewers discussed quality scores until agreement was reached.
Results
The database search resulted in the selection of 2323 ar-ticles. Furthermore, 327 extra articles were received
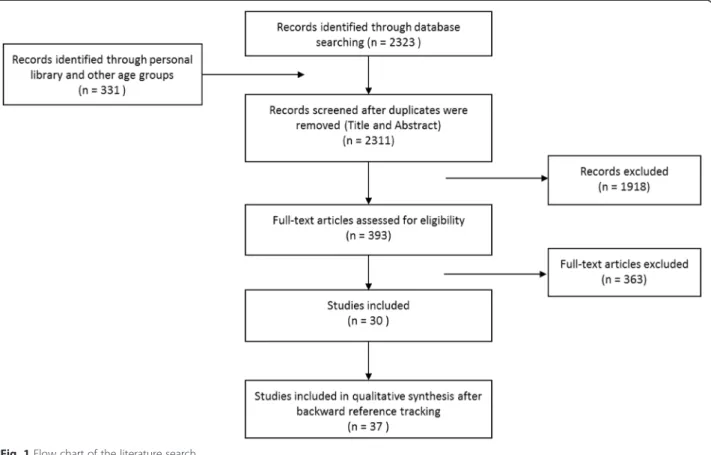
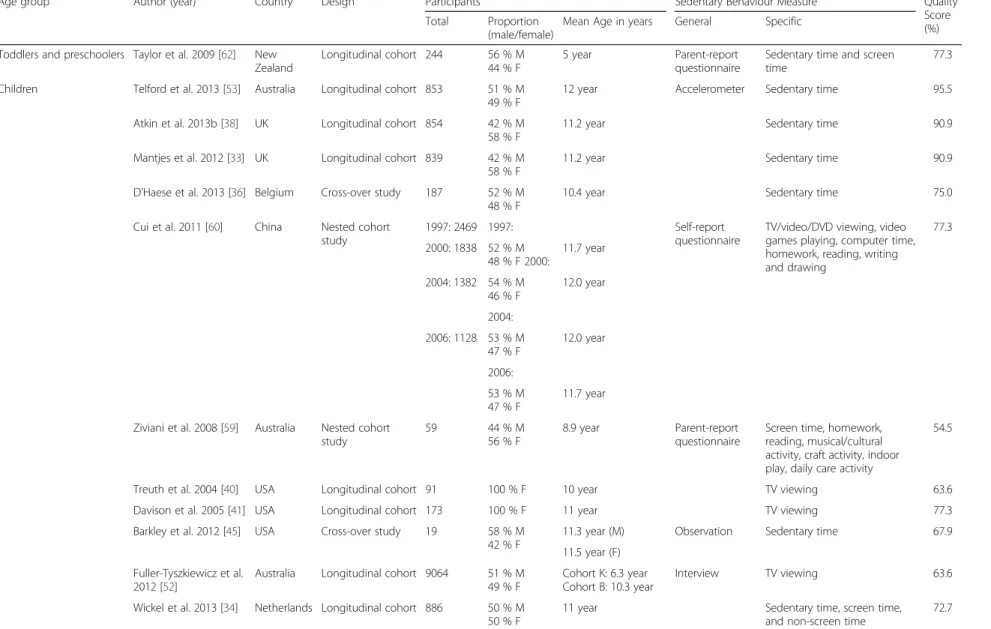
from the literature search of the other age groups which were wrongly classified. Three extra articles were added from personal bibliographies. Of these 2654 articles, 343 duplicates were removed. Title and abstract screening of the remaining 2311 articles were screened and resulted in the full texts screening of 393 articles. From these, 30 studies met the inclusion criteria. Backward reference tracking of these 30 studies resulted in the selection of 26 more articles of which seven were included. In total, the review comprises 37 articles (see flow chart in Fig. 1). In Table 2, an overview of the included studies is presented.
Study characteristics
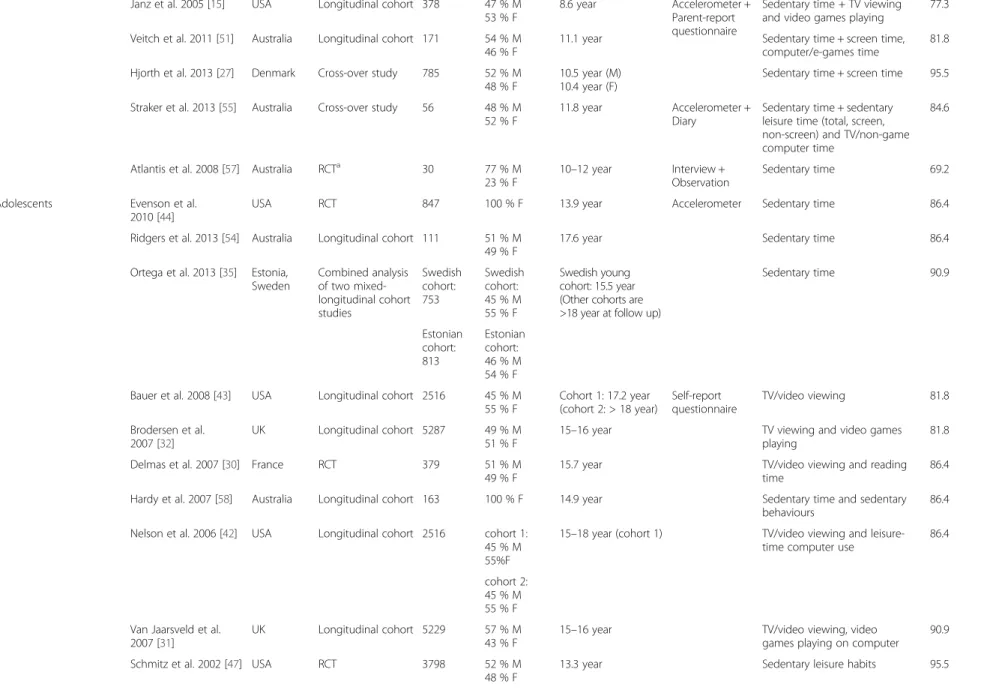
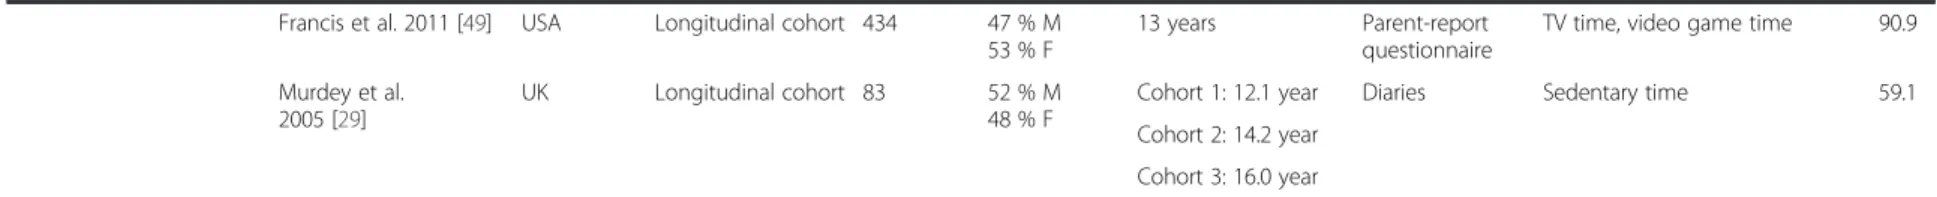
Of the 37 included studies, 13 were conducted in Europe [28–40] (of which six in the UK [30, 32–34, 38, 39]), 11 in the USA [15, 41–50], 10 in Australia [51–60], two in Asia [61, 62] and one in New-Zealand [63]. More than half of the studies (n = 21) were published from 2010 on-wards [28, 29, 34–39, 45–47, 50–57, 61, 62], with 11 in 2013 [28, 35–39, 54–57, 62]. Nine studies exclusively used objective measures of SB by means of accelerometers [29, 34, 36, 37, 39, 45, 54, 55, 57], whereas 15 studies ex-clusively used self-reported or parent-reported SB from questionnaires [30–33, 41–44, 47, 48, 50, 59–61, 63]. Six studies used both accelerometers and questionnaires [15, 28, 38, 51, 52, 62]. Furthermore, two studies used observations [46, 58], three studies used interviews [35, 49, 53], one study used accelerometers combined with self-reported SB from diaries [56] and one study used recalls [40] to assess SB.
The different age groups (according to age at follow-up) studied were: toddlers and preschoolers (0–5 years old) (n = 1) [63], children (6–12 years old) (n = 16) [15, 28, 34, 35, 37, 39, 41, 42, 46, 52–54, 56, 58, 60, 61], adolescents (13–17 years old) (n = 16) [31–33, 36, 38, 40, 43–45, 47–49, 51, 55, 59, 62], or a combination of age groups (n = 4) [29, 30, 50, 57]. The sample sizes ranged from 19 to 18,900 participants with a median of 759 participants. Four studies only included female participants [41, 42, 45, 59], whereas 33 studies included both boys and girls [15, 28–40, 43, 44, 46–58, 60–63]. No studies included only boys. In the included articles, the following de-signs were used: randomized controlled trial (n = 4) [31, 45, 48, 58], cross-over study (n = 4) [28, 37, 46, 56] or longitudinal cohort study (n = 29) [15, 29, 30, 32–36, 38–44, 47, 49–55, 57, 59–63]. A complete overview of the study characteristics is given in Table 2.
Risk of bias
Overall, the studies were of good quality with a median score of 82 % and an interquartile range of 74 to 91 %. The lowest score was 55 % for Ziviani et al. (2008) [60]. The highest score was 96 % for Hjorth et al. (2013) [28]. Of all the items of the checklist for the assessment of the
Table 1 Rules for classifying determinants regarding the association with SB (based on [26])
Proportion of analyses supporting the association (%)
Summary code Meaning of code
0–33 0 No evidence
34–59 ? Inconsistent evidence
60–100 + /− Consistent association
When four or more studies supported an association or no association, it was coded as + +,− − or 00
Stierlin et al. International Journal of Behavioral Nutrition and Physical Activity (2015) 12:133
quality of quantitative studies, item 1‘Question/objective sufficiently described?’, item 2 ‘Study design evident and appropriate?’ and item 10 ‘Analytic methods described/jus-tified and appropriate?’ were most frequently reported.
Item 11 ‘Some estimate of variance is reported for the
main results?’ appeared to be the item most frequently missing.
Specific outcomes investigated
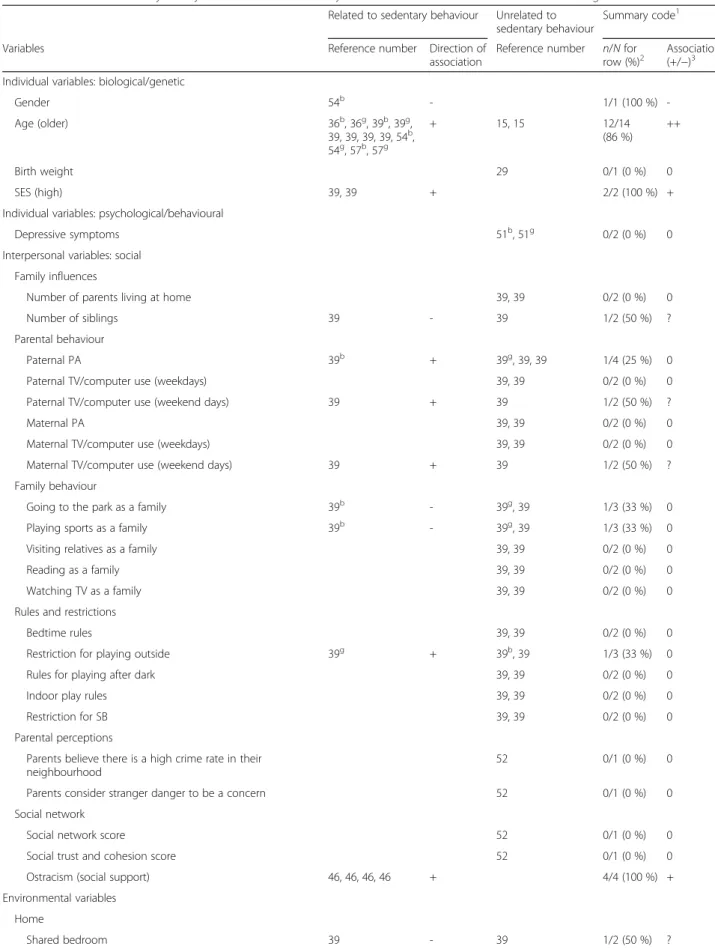
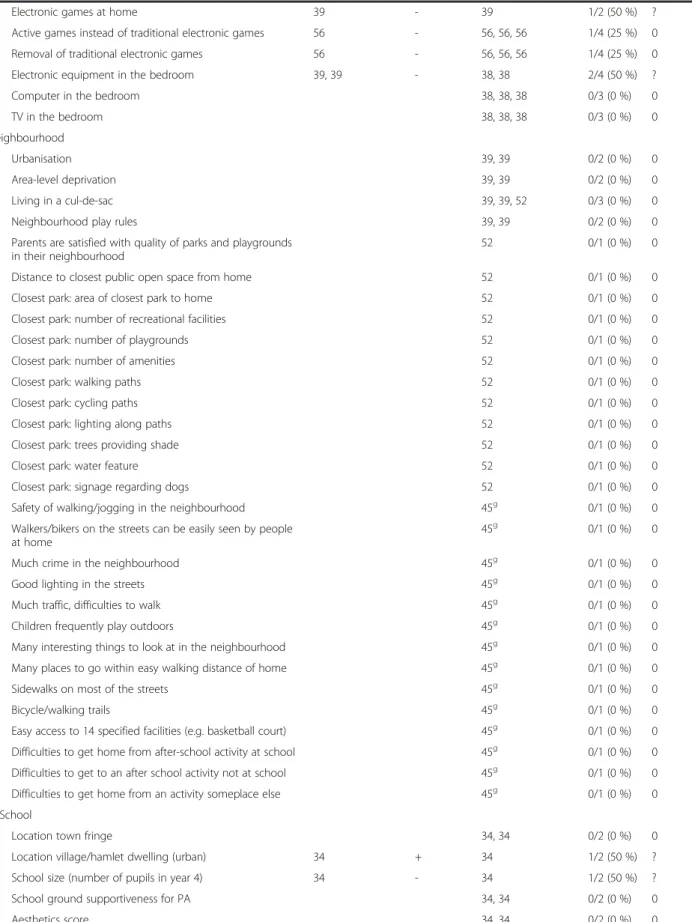
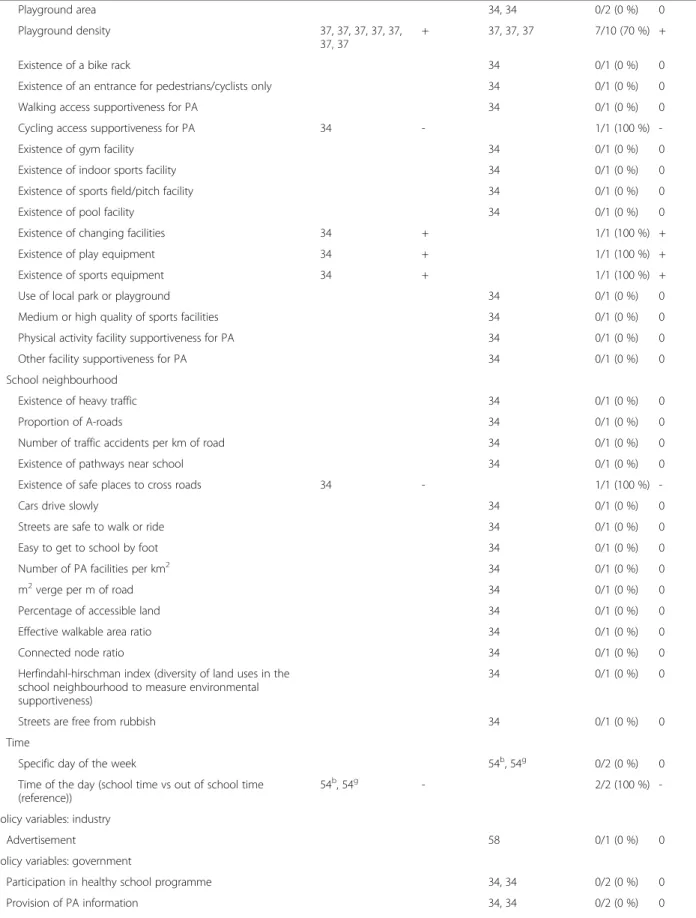
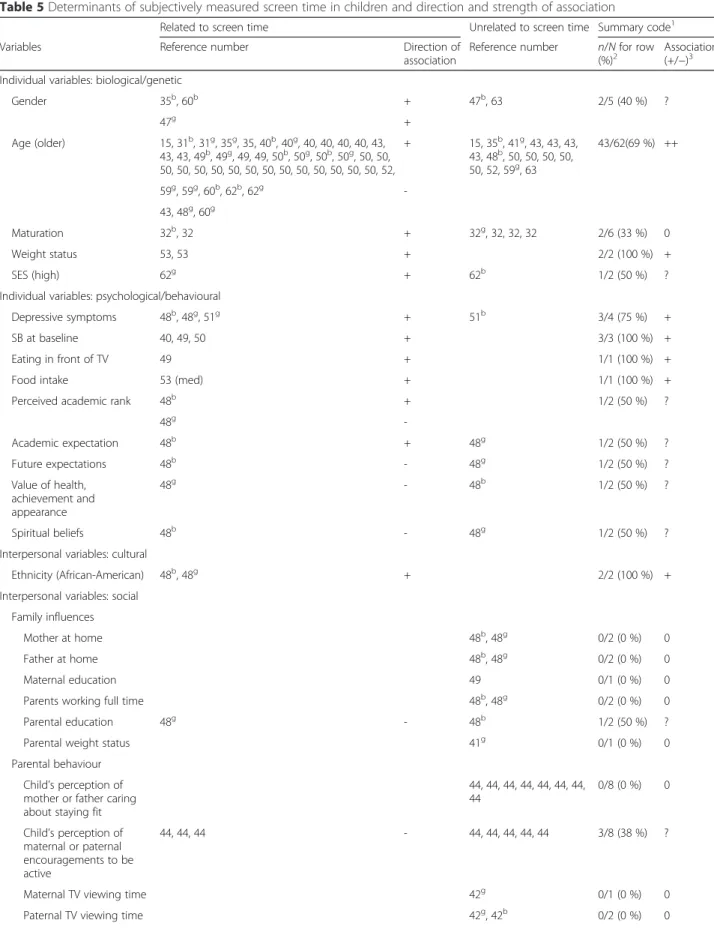
Associations of potential determinants with objectively and subjectively measured total SB and subjectively measured screen time are given in Tables 3, 4 and 5, respectively. Other SB domains such as reading, writing and drawing were rarely investigated [31, 35, 40, 55, 56, 59–61] and therefore not mentioned in the table nor results’ section.
Individual determinants Biological/genetic
Age Eleven studies investigated the association between
age and total SB [15, 33, 35, 36, 39, 52, 54, 57, 59, 62, 63]. Five studies [15, 36, 39, 54, 57] were based on objectively measured total SB and six studies [33, 35, 52, 59, 62, 63] were based on subjectively measured total SB. In both cases (i.e., objectively [36, 39, 54, 57] and subjectively [33, 35, 52, 59, 62]) there is evidence for a significant as-sociation with youth engaging more in total sedentary time when they grow older, leading to consistent evidence
for age as a determinant of sedentary time [33, 35, 36, 39, 52, 54, 57, 59, 62]. Also for screen time there was a consist-ent association with age with youth engaging in more screen time when they grow older [15, 31, 35, 40, 41, 43, 48–50, 52, 59, 60, 62, 63].
Gender The association between gender and SB was
ex-amined in four studies [33, 35, 54, 63]. One study [54] was based on objectively measured total SB and showed that there is evidence for a consistent association be-tween gender and objectively measured total SB with boys engaging in less total SB compared to girls. Fur-thermore, no evidence was found for the association be-tween gender and subjectively measured total SB. Based on those studies, no evidence for an association was re-ported. There was inconsistent evidence for an associ-ation between gender and screen time [35, 47, 60, 63].
Weight status Three studies examined the association
between weight status and subjectively measured total SB, but found no evidence of an association [28, 30, 62]. On the other hand, there is evidence of an association with screen time, with heavier youth engaging in higher levels of screen time over time [53].
Socioeconomic status Two studies considered the
asso-ciation between socioeconomic status (SES) and total SB
Fig. 1 Flow chart of the literature search
Stierlin et al. International Journal of Behavioral Nutrition and Physical Activity (2015) 12:133
Table 2 Descriptive characteristics of the included articles
Age group Author (year) Country Design Participants Sedentary Behaviour Measure Quality Score (%) Total Proportion
(male/female)
Mean Age in years General Specific Toddlers and preschoolers Taylor et al. 2009 [62] New
Zealand
Longitudinal cohort 244 56 % M 44 % F
5 year Parent-report questionnaire
Sedentary time and screen time
77.3 Children Telford et al. 2013 [53] Australia Longitudinal cohort 853 51 % M
49 % F
12 year Accelerometer Sedentary time 95.5 Atkin et al. 2013b [38] UK Longitudinal cohort 854 42 % M
58 % F
11.2 year Sedentary time 90.9 Mantjes et al. 2012 [33] UK Longitudinal cohort 839 42 % M
58 % F
11.2 year Sedentary time 90.9 D’Haese et al. 2013 [36] Belgium Cross-over study 187 52 % M
48 % F
10.4 year Sedentary time 75.0 Cui et al. 2011 [60] China Nested cohort
study
1997: 2469 1997: Self-report questionnaire
TV/video/DVD viewing, video games playing, computer time, homework, reading, writing and drawing 77.3 2000: 1838 52 % M 48 % F 2000: 11.7 year 2004: 1382 54 % M 46 % F 12.0 year 2004: 2006: 1128 53 % M 47 % F 12.0 year 2006: 53 % M 47 % F 11.7 year Ziviani et al. 2008 [59] Australia Nested cohort
study
59 44 % M 56 % F
8.9 year Parent-report questionnaire
Screen time, homework, reading, musical/cultural activity, craft activity, indoor play, daily care activity
54.5
Treuth et al. 2004 [40] USA Longitudinal cohort 91 100 % F 10 year TV viewing 63.6 Davison et al. 2005 [41] USA Longitudinal cohort 173 100 % F 11 year TV viewing 77.3 Barkley et al. 2012 [45] USA Cross-over study 19 58 % M
42 % F
11.3 year (M) Observation Sedentary time 67.9 11.5 year (F)
Fuller-Tyszkiewicz et al. 2012 [52]
Australia Longitudinal cohort 9064 51 % M 49 % F
Cohort K: 6.3 year Cohort B: 10.3 year
Interview TV viewing 63.6 Wickel et al. 2013 [34] Netherlands Longitudinal cohort 886 50 % M
50 % F
11 year Sedentary time, screen time, and non-screen time
72.7 Stierlin et al. Internati onal Journal of Behavioral Nutrition and Physical Activity (2015) 12:133 Page 5 of 19
Table 2 Descriptive characteristics of the included articles (Continued)
Janz et al. 2005 [15] USA Longitudinal cohort 378 47 % M 53 % F
8.6 year Accelerometer + Parent-report questionnaire
Sedentary time + TV viewing and video games playing
77.3 Veitch et al. 2011 [51] Australia Longitudinal cohort 171 54 % M
46 % F
11.1 year Sedentary time + screen time, computer/e-games time
81.8 Hjorth et al. 2013 [27] Denmark Cross-over study 785 52 % M
48 % F
10.5 year (M) 10.4 year (F)
Sedentary time + screen time 95.5 Straker et al. 2013 [55] Australia Cross-over study 56 48 % M
52 % F
11.8 year Accelerometer + Diary
Sedentary time + sedentary leisure time (total, screen, non-screen) and TV/non-game computer time
84.6
Atlantis et al. 2008 [57] Australia RCTa 30 77 % M
23 % F
10–12 year Interview + Observation
Sedentary time 69.2 Adolescents Evenson et al.
2010 [44]
USA RCT 847 100 % F 13.9 year Accelerometer Sedentary time 86.4 Ridgers et al. 2013 [54] Australia Longitudinal cohort 111 51 % M
49 % F
17.6 year Sedentary time 86.4 Ortega et al. 2013 [35] Estonia,
Sweden Combined analysis of two mixed-longitudinal cohort studies Swedish cohort: 753 Swedish cohort: 45 % M 55 % F Swedish young cohort: 15.5 year (Other cohorts are >18 year at follow up)
Sedentary time 90.9 Estonian cohort: 813 Estonian cohort: 46 % M 54 % F Bauer et al. 2008 [43] USA Longitudinal cohort 2516 45 % M
55 % F Cohort 1: 17.2 year (cohort 2: > 18 year) Self-report questionnaire TV/video viewing 81.8 Brodersen et al. 2007 [32] UK Longitudinal cohort 5287 49 % M 51 % F
15–16 year TV viewing and video games playing
81.8 Delmas et al. 2007 [30] France RCT 379 51 % M
49 % F
15.7 year TV/video viewing and reading time
86.4 Hardy et al. 2007 [58] Australia Longitudinal cohort 163 100 % F 14.9 year Sedentary time and sedentary
behaviours
86.4 Nelson et al. 2006 [42] USA Longitudinal cohort 2516 cohort 1:
45 % M 55%F
15–18 year (cohort 1) TV/video viewing and leisure-time computer use
86.4 cohort 2:
45 % M 55 % F Van Jaarsveld et al.
2007 [31]
UK Longitudinal cohort 5229 57 % M 43 % F
15–16 year TV/video viewing, video games playing on computer
90.9 Schmitz et al. 2002 [47] USA RCT 3798 52 % M
48 % F
13.3 year Sedentary leisure habits 95.5
Stierlin et al. Internati onal Journal of Behavioral Nutrition and Physical Activity (2015) 12:133 Page 6 of 19
Table 2 Descriptive characteristics of the included articles (Continued)
Datar et al. 2012 [46] USA Longitudinal cohort 18,900 51 % M 49 % F
14.2 year Parent-report questionnaire
TV viewing 81.8 Saelens et al. 2002 [48] USA Longitudinal cohort 169 52 % M
48 % F
12.1 year Interview TV time 72.7 Raudsepp et al.
2008 [39]
Estonia Longitudinal cohort 345 51 % M 49 % F
14 year 3-day recall Sedentary time 68.2 Atkin et al. 2013a [37] UK Longitudinal cohort sedentary
time: 319 screen time: 373 T0 (accel.): 45 % M 55 % F 14.3 year Accelerometer + Self-report questionnaire
Sedentary time + Screen-time 77.3 T4 (accel.): 48 % M 52 % F T0 (quest.): 44 % M 56 % F T4 (quest.): 45 % M 55 % F Hume et al. 2011 [50] Australia Longitudinal cohort 155 40 % M
60 % F
16.4 year (M) Sedentary time + TV/video/ DVD viewing
81.8 16.2 year (F)
Trang et al. 2013 [61] Vietnam Longitudinal cohort 759 48 % M 52 % F
15.8 year Sedentary time + Screen time 90.9 Children + Adolescents Arundell et al.
2013 [56]
Australia Longitudinal cohort 2053 Younger: 52 % M 48 % F
10–11 year Accelerometer Sedentary time 90.9 Older: 45 % M 55 % F 15–17 year Ridgway et al. 2011 [28]
Denmark Secondary data analyses on four cohort studies
4170 EYHS: 47 % M 53 % F
12.0 year Sedentary time 95.5 Norway
Portugal Roots study: 44 % M 56 % F 14.5 year Estonia UK Speedy study: 44 % M 56 % F 10.2 year Brazil Pelotas: 52 % M 48 % F 13.3 year Stierlin et al. Internati onal Journal of Behavioral Nutrition and Physical Activity (2015) 12:133 Page 7 of 19
Table 2 Descriptive characteristics of the included articles (Continued)
Francis et al. 2011 [49] USA Longitudinal cohort 434 47 % M 53 % F
13 years Parent-report questionnaire
TV time, video game time 90.9 Murdey et al.
2005 [29]
UK Longitudinal cohort 83 52 % M 48 % F
Cohort 1: 12.1 year Diaries Sedentary time 59.1 Cohort 2: 14.2 year
Cohort 3: 16.0 year
a
Data used of the four RCTs that were included:
-Delmas et al. [31]: Only the data from the control group were reported in the manuscript and therefore only those data were used in the review
-Evenson et al. [45]: In each analysis model, the treatment condition (intervention vs. control) was included as a covariate. Therefore, both intervention and control group data could be used -Atlantis et al. [58]: no significant effects or trends were seen for any of the dependent variables. Therefore, data of both intervention and control groups were used
-Schmitz et al. [48]: The self-reported PA and SLH were measured in spring whereas demographic and psychosocial variables were measured the previous fall (baseline data). Since the 16 schools of this study were randomized to intervention or comparison (delayed intervention) conditions after all baseline measures were taken, both intervention and control group data could be used for the current review
Stierlin et al. Internati onal Journal of Behavioral Nutrition and Physical Activity (2015) 12:133 Page 8 of 19
Table 3 Determinants of objectively measured total sedentary behaviour in children and direction and strength of association
Related to sedentary behaviour Unrelated to sedentary behaviour
Summary code1
Variables Reference number Direction of
association
Reference number n/N for row (%)2
Association (+/−)3 Individual variables: biological/genetic
Gender 54b - 1/1 (100 %) -Age (older) 36b, 36g, 39b, 39g, 39, 39, 39, 39, 54b, 54g, 57b, 57g + 15, 15 12/14 (86 %) ++ Birth weight 29 0/1 (0 %) 0 SES (high) 39, 39 + 2/2 (100 %) +
Individual variables: psychological/behavioural
Depressive symptoms 51b, 51g 0/2 (0 %) 0
Interpersonal variables: social Family influences
Number of parents living at home 39, 39 0/2 (0 %) 0
Number of siblings 39 - 39 1/2 (50 %) ?
Parental behaviour
Paternal PA 39b + 39g, 39, 39 1/4 (25 %) 0
Paternal TV/computer use (weekdays) 39, 39 0/2 (0 %) 0
Paternal TV/computer use (weekend days) 39 + 39 1/2 (50 %) ?
Maternal PA 39, 39 0/2 (0 %) 0
Maternal TV/computer use (weekdays) 39, 39 0/2 (0 %) 0
Maternal TV/computer use (weekend days) 39 + 39 1/2 (50 %) ?
Family behaviour
Going to the park as a family 39b - 39g, 39 1/3 (33 %) 0
Playing sports as a family 39b - 39g, 39 1/3 (33 %) 0
Visiting relatives as a family 39, 39 0/2 (0 %) 0
Reading as a family 39, 39 0/2 (0 %) 0
Watching TV as a family 39, 39 0/2 (0 %) 0
Rules and restrictions
Bedtime rules 39, 39 0/2 (0 %) 0
Restriction for playing outside 39g + 39b, 39 1/3 (33 %) 0
Rules for playing after dark 39, 39 0/2 (0 %) 0
Indoor play rules 39, 39 0/2 (0 %) 0
Restriction for SB 39, 39 0/2 (0 %) 0
Parental perceptions
Parents believe there is a high crime rate in their neighbourhood
52 0/1 (0 %) 0
Parents consider stranger danger to be a concern 52 0/1 (0 %) 0
Social network
Social network score 52 0/1 (0 %) 0
Social trust and cohesion score 52 0/1 (0 %) 0
Ostracism (social support) 46, 46, 46, 46 + 4/4 (100 %) +
Environmental variables Home
Shared bedroom 39 - 39 1/2 (50 %) ?
Stierlin et al. International Journal of Behavioral Nutrition and Physical Activity (2015) 12:133
Table 3 Determinants of objectively measured total sedentary behaviour in children and direction and strength of association (Continued)
Electronic games at home 39 - 39 1/2 (50 %) ?
Active games instead of traditional electronic games 56 - 56, 56, 56 1/4 (25 %) 0 Removal of traditional electronic games 56 - 56, 56, 56 1/4 (25 %) 0 Electronic equipment in the bedroom 39, 39 - 38, 38 2/4 (50 %) ?
Computer in the bedroom 38, 38, 38 0/3 (0 %) 0
TV in the bedroom 38, 38, 38 0/3 (0 %) 0
Neighbourhood
Urbanisation 39, 39 0/2 (0 %) 0
Area-level deprivation 39, 39 0/2 (0 %) 0
Living in a cul-de-sac 39, 39, 52 0/3 (0 %) 0
Neighbourhood play rules 39, 39 0/2 (0 %) 0
Parents are satisfied with quality of parks and playgrounds in their neighbourhood
52 0/1 (0 %) 0
Distance to closest public open space from home 52 0/1 (0 %) 0
Closest park: area of closest park to home 52 0/1 (0 %) 0
Closest park: number of recreational facilities 52 0/1 (0 %) 0
Closest park: number of playgrounds 52 0/1 (0 %) 0
Closest park: number of amenities 52 0/1 (0 %) 0
Closest park: walking paths 52 0/1 (0 %) 0
Closest park: cycling paths 52 0/1 (0 %) 0
Closest park: lighting along paths 52 0/1 (0 %) 0
Closest park: trees providing shade 52 0/1 (0 %) 0
Closest park: water feature 52 0/1 (0 %) 0
Closest park: signage regarding dogs 52 0/1 (0 %) 0
Safety of walking/jogging in the neighbourhood 45g 0/1 (0 %) 0
Walkers/bikers on the streets can be easily seen by people at home
45g 0/1 (0 %) 0
Much crime in the neighbourhood 45g 0/1 (0 %) 0
Good lighting in the streets 45g 0/1 (0 %) 0
Much traffic, difficulties to walk 45g 0/1 (0 %) 0
Children frequently play outdoors 45g 0/1 (0 %) 0
Many interesting things to look at in the neighbourhood 45g 0/1 (0 %) 0 Many places to go within easy walking distance of home 45g 0/1 (0 %) 0
Sidewalks on most of the streets 45g 0/1 (0 %) 0
Bicycle/walking trails 45g 0/1 (0 %) 0
Easy access to 14 specified facilities (e.g. basketball court) 45g 0/1 (0 %) 0 Difficulties to get home from after-school activity at school 45g 0/1 (0 %) 0 Difficulties to get to an after school activity not at school 45g 0/1 (0 %) 0 Difficulties to get home from an activity someplace else 45g 0/1 (0 %) 0 School
Location town fringe 34, 34 0/2 (0 %) 0
Location village/hamlet dwelling (urban) 34 + 34 1/2 (50 %) ?
School size (number of pupils in year 4) 34 - 34 1/2 (50 %) ?
School ground supportiveness for PA 34, 34 0/2 (0 %) 0
Aesthetics score 34, 34 0/2 (0 %) 0
Stierlin et al. International Journal of Behavioral Nutrition and Physical Activity (2015) 12:133
Table 3 Determinants of objectively measured total sedentary behaviour in children and direction and strength of association (Continued) Playground area 34, 34 0/2 (0 %) 0 Playground density 37, 37, 37, 37, 37, 37, 37 + 37, 37, 37 7/10 (70 %) +
Existence of a bike rack 34 0/1 (0 %) 0
Existence of an entrance for pedestrians/cyclists only 34 0/1 (0 %) 0
Walking access supportiveness for PA 34 0/1 (0 %) 0
Cycling access supportiveness for PA 34 - 1/1 (100 %)
-Existence of gym facility 34 0/1 (0 %) 0
Existence of indoor sports facility 34 0/1 (0 %) 0
Existence of sports field/pitch facility 34 0/1 (0 %) 0
Existence of pool facility 34 0/1 (0 %) 0
Existence of changing facilities 34 + 1/1 (100 %) +
Existence of play equipment 34 + 1/1 (100 %) +
Existence of sports equipment 34 + 1/1 (100 %) +
Use of local park or playground 34 0/1 (0 %) 0
Medium or high quality of sports facilities 34 0/1 (0 %) 0
Physical activity facility supportiveness for PA 34 0/1 (0 %) 0
Other facility supportiveness for PA 34 0/1 (0 %) 0
School neighbourhood
Existence of heavy traffic 34 0/1 (0 %) 0
Proportion of A-roads 34 0/1 (0 %) 0
Number of traffic accidents per km of road 34 0/1 (0 %) 0
Existence of pathways near school 34 0/1 (0 %) 0
Existence of safe places to cross roads 34 - 1/1 (100 %)
-Cars drive slowly 34 0/1 (0 %) 0
Streets are safe to walk or ride 34 0/1 (0 %) 0
Easy to get to school by foot 34 0/1 (0 %) 0
Number of PA facilities per km2 34 0/1 (0 %) 0
m2verge per m of road 34 0/1 (0 %) 0
Percentage of accessible land 34 0/1 (0 %) 0
Effective walkable area ratio 34 0/1 (0 %) 0
Connected node ratio 34 0/1 (0 %) 0
Herfindahl-hirschman index (diversity of land uses in the school neighbourhood to measure environmental supportiveness)
34 0/1 (0 %) 0
Streets are free from rubbish 34 0/1 (0 %) 0
Time
Specific day of the week 54b, 54g 0/2 (0 %) 0
Time of the day (school time vs out of school time (reference))
54b, 54g - 2/2 (100 %)
-Policy variables: industry
Advertisement 58 0/1 (0 %) 0
Policy variables: government
Participation in healthy school programme 34, 34 0/2 (0 %) 0
Provision of PA information 34, 34 0/2 (0 %) 0
Stierlin et al. International Journal of Behavioral Nutrition and Physical Activity (2015) 12:133
[39, 62]. Children from families with a higher SES en-gaged in higher amounts of objectively measured SB [39]. However, there is inconsistent evidence for the as-sociation between SES and subjectively measured SB [62]. Also for screen time specifically, inconsistent evi-dence was found for the association with SES [62].
Psychological/behavioural
Baseline assessment of screen time was found to be signifi-cantly associated with screen time at follow-up [40, 49, 50], indicating tracking of screen time over time. Scoring high on depressive symptoms was found to be significantly associated with screen time behaviour [48, 51]. Youth with more depressive symptoms tend to spend more time in front of screens. Furthermore, there is evidence for the association between eating in front of TV and screen time, with eating more frequently in front of TV being associated with more screen time [49].
Interpersonal determinants Cultural
There is evidence that being black is associated with more subjectively measured total SB [33]. In addition, African-Americans engaged in more screen time [48].
Social
There is inconsistent evidence or no evidence for the as-sociations for most social determinants (e.g. parental education, number of siblings, maternal PA). Only the association between ostracism (absence of social support) and objectively measured total SB [46], the association be-tween number of TV related parenting risk factors and screen time [42], and the association between watching TV as a family and screen time [42] were significant. The absence of social support can increase children’s time spent sedentary [46] and having more TV related parent-ing risk factors and watchparent-ing more TV as a family, can re-sult in higher screen time in youth.
Environmental determinants
For most environmental determinants (e.g. electronic games at home, living in a cul-de-sac, playground area at school) there is no evidence or inconsistent evidence for an association. However, youth living in lower SES neigh-bourhoods engaged in more subjectively measured total SB [33]. There is evidence for the association between playground density and objectively measured total SB, with more children sharing a playground resulting in higher levels of SB [37]. In addition, there is evidence for a consistent association between availability of play and
Table 3 Determinants of objectively measured total sedentary behaviour in children and direction and strength of association (Continued)
Provision of health promotion information 34 + 34 1/2 (50 %) ?
Provision of risks of unhealthy lifestyle information 34, 34 0/2 (0 %) 0
Hours of physical education 34 + 1/1 (100 %) +
Extracurricular PA before school 34 0/1 (0 %) 0
Extracurricular PA during lunch breaks 34 0/1 (0 %) 0
Extracurricular PA during weekends 34 - 1/1 (100 %)
-Duration of morning break (>15 minutes) 34 - 1/1 (100 %)
-Duration of lunch break 34 - 1/1 (100 %)
-Breaks: allowed to play outside in bad weather 34 0/1 (0 %) 0
Breaks: screenplay allowed 34 0/1 (0 %) 0
Breaks: >2 PA allowed 34 0/1 (0 %) 0
Existence of breakfast club 34 0/1 (0 %) 0
Existence of lollypop person (e.g. crossing guard) 34 - 1/1 (100 %)
-Existence of park and stride 34 0/1 (0 %) 0
Existence of travel plan 34 0/1 (0 %) 0
Existence of walking bus 34 0/1 (0 %) 0
Provision of cycle training 34 0/1 (0 %) 0
Provision of pedestrian training 34 + 1/1 (100 %) +
SB sedentary behaviour, SES socio-economic status
1
Summary code is an overall summary of the findings for each variable separately
2
n = Number of analyses that support the direction of the association; N = number of analyses that have investigated and reported on possible associations between the variable and sedentary behaviour
3
Shows the direction of the individual/summary association Subgroup analyses:b
only in boys;g
only in girls; other subgroup analyses are listed but are not specified
Stierlin et al. International Journal of Behavioral Nutrition and Physical Activity (2015) 12:133
sports equipment and changing facilities with higher ob-jectively measured total SB [34]. The existence of safe places to cross roads near the school, was associated with lower levels of objectively measured total SB [34].
Youth spent less time on objectively measured SB dur-ing school hours compared to out of school time [54]. There is evidence for a consistent association between screen time and year of measurement which indicates an increase in screen time over time [43, 61].
Policy level determinants Governmental
Unexpectedly, more hours of physical education and the provision of pedestrian training were associated with a higher total sedentary time [34]. Furthermore, having a crossing guard to help children cross the roads near school safely, having more extracurricular PA during weekends and having longer lunch breaks resulted in less time spent sedentary [34].
Discussion
The current paper reviewed the determinants of SB in toddlers, preschoolers, children and adolescents. SB re-search is a relatively new field, which is reflected in the fact that more than half of the included studies were published from 2010 onwards. In addition, most studies were conducted in Europe, USA, and Australia, which shows a wide international spread of studies, but largely restricted to high income countries. Also in the review of Uijtdewilligen et al. (2011), 28 of the 30 included
articles were carried out in high income countries (USA, Canada, Great Britain, Australia, France, The Netherlands, Estonia, Sweden and New Zealand) [21]. This shows the need for more research in low and middle income coun-tries as information from those councoun-tries is currently missing. The current review took a stringent approach by including only studies with a longitudinal design in order to provide evidence on prediction rather than mere associ-ation. However, only a few studies looked at a comprehen-sive set of factors at various levels, and as a consequence, the evidence available on the identified determinants is largely derived from only one or two studies. Nevertheless, these studies were in general of high quality.
In general, screen time– and TV viewing in particular – is the most commonly measured SB in youth and is fre-quently used as a proxy marker of total SB [64]. However, the results of the current systematic literature review clearly show that the determinants of total SB (e.g. maturation, SES, playground density) differ from the determinants of screen time (e.g. weight status, eating in front of TV, watch-ing TV as a family). Also within the nine studies that looked simultaneously at screen time and total sedentary time, we see that for the majority of investigated determinants, there are differences in significance between sedentary time and screen time [15, 35, 38, 51, 52, 56, 59, 62, 63]. Similarly, Verloigne et al. (2013) reported that TV and computer time do not adequately reflect total SB in European 10–12 year old children [11]. Consequently, solely focussing on the de-terminants of screen time may be too limited to obtain meaningful changes in total SB, as only one type of SB is
Table 4 Determinants of subjectively measured total sedentary behaviour in children and direction and strength of association
Related to sedentary behaviour Unrelated to sedentary behaviour Summary code1 Variables Reference number Direction of
association
Reference number n/N for row (%)2 Association (+/−)3 Individual variables: biological/genetic
Gender 33b + 35, 63 1/3 (33 %) 0 Age (older) 33b, 33g, 35b, 35g, 52, 59g, 59g, 59g, 59g, 62b, 62g + 63 11/12 (92 %) ++ Maturation 30b,wk, 62b, 62g, 62b, 62g + 30g,wk, 30b,wn, 30g,wn 5/8 (63 %) + Weight status 28, 30g,wn + 30b,wn, 30b,wk, 30g,wk, 62 2/6 (33 %) 0 SES (high) 62g + 62b 1/2 (50 %) ?
Interpersonal variables: cultural
Ethnicity (black) 33 + 1/1 (100 %) +
Environmental variables Neighbourhood
Neighbourhood SES (low) 33 + 1/1 (100 %) +
SES socio-economic status
1
Summary code is an overall summary of the findings for each variable separately
2
n = Number of analyses that support the direction of the association; N = number of analyses that have investigated and reported on possible associations between the variable and sedentary behaviour
3
Shows the direction of the individual/summary association Subgroup analyses:b
only in boys;g
only in girls;wk
only on weekdays;wn
only on weekend days; other subgroup analyses are listed but are not specified
Stierlin et al. International Journal of Behavioral Nutrition and Physical Activity (2015) 12:133
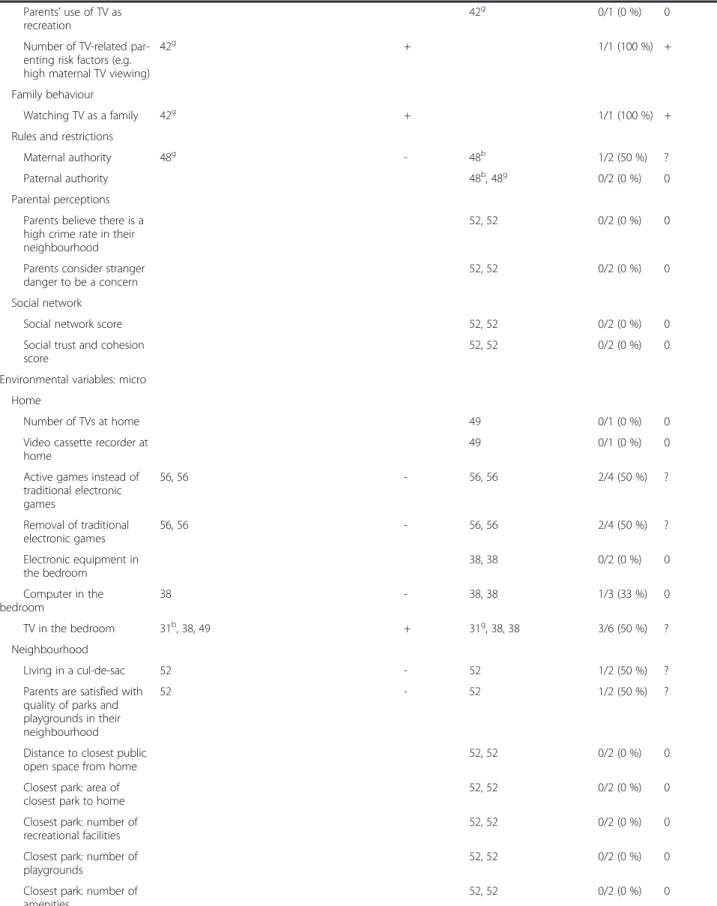
Table 5 Determinants of subjectively measured screen time in children and direction and strength of association
Related to screen time Unrelated to screen time Summary code1
Variables Reference number Direction of
association
Reference number n/N for row
(%)2 Association(+/−)3
Individual variables: biological/genetic
Gender 35b, 60b + 47b, 63 2/5 (40 %) ? 47g + Age (older) 15, 31b, 31g, 35g, 35, 40b, 40g, 40, 40, 40, 40, 43, 43, 43, 49b, 49g, 49, 49, 50b, 50g, 50b, 50g, 50, 50, 50, 50, 50, 50, 50, 50, 50, 50, 50, 50, 50, 50, 50, 52, + 15, 35b, 41g, 43, 43, 43, 43, 48b, 50, 50, 50, 50, 50, 52, 59g, 63 43/62(69 %) ++ 59g, 59g, 60b, 62b, 62g -43, 48g, 60g Maturation 32b, 32 + 32g, 32, 32, 32 2/6 (33 %) 0 Weight status 53, 53 + 2/2 (100 %) + SES (high) 62g + 62b 1/2 (50 %) ?
Individual variables: psychological/behavioural
Depressive symptoms 48b, 48g, 51g + 51b 3/4 (75 %) +
SB at baseline 40, 49, 50 + 3/3 (100 %) +
Eating in front of TV 49 + 1/1 (100 %) +
Food intake 53 (med) + 1/1 (100 %) +
Perceived academic rank 48b + 1/2 (50 %) ?
48g -Academic expectation 48b + 48g 1/2 (50 %) ? Future expectations 48b - 48g 1/2 (50 %) ? Value of health, achievement and appearance 48g - 48b 1/2 (50 %) ? Spiritual beliefs 48b - 48g 1/2 (50 %) ?
Interpersonal variables: cultural
Ethnicity (African-American) 48b, 48g + 2/2 (100 %) +
Interpersonal variables: social Family influences
Mother at home 48b, 48g 0/2 (0 %) 0
Father at home 48b, 48g 0/2 (0 %) 0
Maternal education 49 0/1 (0 %) 0
Parents working full time 48b, 48g 0/2 (0 %) 0
Parental education 48g - 48b 1/2 (50 %) ?
Parental weight status 41g 0/1 (0 %) 0
Parental behaviour Child’s perception of mother or father caring about staying fit
44, 44, 44, 44, 44, 44, 44, 44 0/8 (0 %) 0 Child’s perception of maternal or paternal encouragements to be active 44, 44, 44 - 44, 44, 44, 44, 44 3/8 (38 %) ?
Maternal TV viewing time 42g 0/1 (0 %) 0
Paternal TV viewing time 42g, 42b 0/2 (0 %) 0
Stierlin et al. International Journal of Behavioral Nutrition and Physical Activity (2015) 12:133
Table 5 Determinants of subjectively measured screen time in children and direction and strength of association (Continued)
Parents’ use of TV as recreation
42g 0/1 (0 %) 0
Number of TV-related par-enting risk factors (e.g. high maternal TV viewing)
42g + 1/1 (100 %) +
Family behaviour
Watching TV as a family 42g + 1/1 (100 %) +
Rules and restrictions
Maternal authority 48g - 48b 1/2 (50 %) ?
Paternal authority 48b, 48g 0/2 (0 %) 0
Parental perceptions Parents believe there is a high crime rate in their neighbourhood
52, 52 0/2 (0 %) 0
Parents consider stranger danger to be a concern
52, 52 0/2 (0 %) 0
Social network
Social network score 52, 52 0/2 (0 %) 0
Social trust and cohesion score
52, 52 0/2 (0 %) 0
Environmental variables: micro Home
Number of TVs at home 49 0/1 (0 %) 0
Video cassette recorder at home
49 0/1 (0 %) 0
Active games instead of traditional electronic games 56, 56 - 56, 56 2/4 (50 %) ? Removal of traditional electronic games 56, 56 - 56, 56 2/4 (50 %) ? Electronic equipment in the bedroom 38, 38 0/2 (0 %) 0 Computer in the bedroom 38 - 38, 38 1/3 (33 %) 0 TV in the bedroom 31b, 38, 49 + 31g, 38, 38 3/6 (50 %) ? Neighbourhood Living in a cul-de-sac 52 - 52 1/2 (50 %) ?
Parents are satisfied with quality of parks and playgrounds in their neighbourhood
52 - 52 1/2 (50 %) ?
Distance to closest public open space from home
52, 52 0/2 (0 %) 0
Closest park: area of closest park to home
52, 52 0/2 (0 %) 0
Closest park: number of recreational facilities
52, 52 0/2 (0 %) 0
Closest park: number of playgrounds
52, 52 0/2 (0 %) 0
Closest park: number of amenities
52, 52 0/2 (0 %) 0
Stierlin et al. International Journal of Behavioral Nutrition and Physical Activity (2015) 12:133
then targeted. However, since looking at“contextual” indi-cators of SB (such as screen time) often gives useful infor-mation regarding potential preventive strategies, future studies should look at both outcomes.
All three studies examining tracking of screen time found that baseline assessment of screen time was significantly as-sociated with screen time at follow-up [40, 49, 50]. Also the review of Biddle et al. (2010) showed that there is evidence for tracking of children’s SB from childhood into adoles-cence and adulthood [65]. Therefore, intervening in early age may be an effective strategy [66]. Future interventions aimed at decreasing sedentary behaviours should target young children before sedentary behaviours become entrenched into living habits. However, preventive interven-tions should be considered at all ages since it may still be possible to change behaviours at later ages. Furthermore, the lack of studies in this review investigating determinants of SB in toddlers and pre-schoolers [63], should be noted.
The majority of the identified determinants of both total SB and screen time, were found at the individual level of the socio-ecological model [20] (e.g., age, matur-ation, weight status, SES). The review by Uijtdewilligen et al. (2011) which at first found insufficient evidence for determinants of sedentary behaviour, only found strong evidence for a positive association between BMI and child sedentary behaviour after conducting a sensitivity test (taking into account the high quality studies twice and low quality studies once) [21]. However, it is difficult or even not possible to modify these individual deter-minants. Therefore, when developing interventions to reduce SB, differences in age, maturation, weight status and SES should be kept in mind.
In relation to environmental determinants, it firstly has to be acknowledged that although some studies
examined a very large number of neighbourhood and school variables [34, 39, 45, 52], hardly any were found to be associated with total SB or screen time. However, the home and the school environment are important set-tings in which children and adolescents spend most of their waking time. In the home environment, there was no evidence for an association between the number of TVs and having a TV in the bedroom with screen time al-though this might be due to the fact that recently in many households mobile phones or tablets became an important alternative to TV screens. However, there was evidence for a positive association between eating in front of TV with more screen time. This phenomenon, called‘constant tele-vision households’, which means that the TV is on during meals, promotes more overall children’s TV watching and could be an important target to decrease screen time [67].
The results from one study included in this review suggest that at the school level, lowering the playground density could be an effective intervention for decreasing children’s sedentary time [37]. Although the consistent intervention effects were rather small, decreasing the playground density by splitting up the recesses of different groups of children and decreasing the number of children sharing the playground, could be effective in a larger multi-component school-based intervention to decrease sedentary time. Since this simple and sustainable strategy is free of costs, requires no teacher training or alterations to the facilities, and does not put extra pressure on the curriculum, it merits further attention in improving sedentary levels in both younger and older children.
Counter-intuitively, one study showed a consistent asso-ciation between availability of play and sports equipment with higher total SB [34]. However, it should be noted that
Table 5 Determinants of subjectively measured screen time in children and direction and strength of association (Continued)
Closest park: walking paths
52 + 52 1/2 (50 %) ?
Closest park: cycling paths 52, 52 0/2 (0 %) 0
Closest park: lighting along paths
52, 52 0/2 (0 %) 0
Closest park: trees providing shade
52, 52 0/2 (0 %) 0
Closest park: water feature 52, 52 0/2 (0 %) 0
Closest park: signage regarding dogs 52, 52 0/2 (0 %) 0 Time Time (year) 43, 43, 61b, 61g, 61, 61, 61, 61, 61, 61 + 43, 43 10/12 (83 %) +
SB sedentary behaviour, SES socio-economic status
1
Summary code is an overall summary of the findings for each variable separately
2
n = Number of analyses that support the direction of the association; N = number of analyses that have investigated and reported on possible associations between the variable and sedentary behaviour
3
Shows the direction of the individual/summary association Subgroup analyses:b
only in boys;g
only in girls; other subgroup analyses are listed but are not specified
Stierlin et al. International Journal of Behavioral Nutrition and Physical Activity (2015) 12:133
there was no distinction between different kinds of equip-ment. Different kinds of equipment might stimulate youth to be more active (e.g. availability of balls) but it might in-duce more SB in other children because children who use this equipment may dominate the playground which can cause the other children perceiving the environment as more dangerous or too crowded to play safely.
In addition, it might be possible that there is too much equipment available at the school, which makes it a bur-den for youth to use. A further possibility might be that the equipment is heavy or too complex and requires ex-pertise and organisation to use. Finally, some play or sports equipment might also stimulate SB, for example the provision of little toys to use in the sandbox. There-fore, in order to reduce SB it may be important to give careful consideration to the specific play and sports equipment provided. Older children might not be chal-lenged by play equipment which is meant for younger children [68] or vice versa. It might also be advisable to create certain zones for ball games.
The results of the current systematic review suggest that if there are safe places to cross roads near the school and a crossing guard is present, less SB in children is noticed [34]. Safety is known to be the main factor for the decision making in transport mode in youth [69, 70]. Consequently, it can be assumed that safe cross roads cause less passive transport to school (e.g., by car, by bus). This underlines the importance of traffic safety issues near the school (e.g., design and accessibility of safe places to cross roads near schools, the provision of crossing guards).
Finally, some policy determinants showed a consistent association with total SB. These determinants are mainly found at the school policy level (e.g., hours of physical education, duration of morning break (>15 min) and lunch break). More hours of physical education induced higher levels of total SB in primary schoolchildren. A pos-sible explanation might be the fact that children might be more tired after a physical education lesson, and thus compensate for example during recess [71]. Furthermore, other studies in secondary schools already found that physical education lesson are largely sedentary [72–75]. As school environment and school policy were identified as important determinants of SB, in school principals and teachers, the awareness of the importance of decreasing children’s SB should be raised.
Strengths and limitations
A first strength of this systematic review is that the in-cluded studies comprised a wide range of sample sizes. However, a median sample size of 759 participants across the included studies, strengthens the generalizability of our results. A second strength is the use of a high quality standardized protocol and data-extraction process. The
evidence from the included studies seems trustworthy as it generally comes from high quality studies (median: 82 %). However, the level of evidence may be somewhat affected by study methodology. For example, in the youn-ger age groups (toddlers and pre-schoolers and primary schoolchildren), proxy reported questionnaires were some-times used to assess children’s SB as young children cannot self-report on their levels of SB because of their cognitive limitations. Therefore, parents often report on their child’s SB but recalling young children’s SB might be difficult for them [76]. For older children like adolescents, sometimes self-report questionnaires were used, which may have led to social desirability bias.
Furthermore, the used quality assessment tool did not assess losses of follow-up. Another limitation is that the systematic literature search was conducted one year ago so as a result more recently published studies were not included in this review. Finally, in the current review multi-component interventions were excluded. However, significant associations found in the included single-component interventions, enable researchers to specific-ally focus on those determinants in future interventions.
Conclusions
In conclusion, while the research on SB has only recently emerged, results of this systematic literature review show that several longitudinal studies have been carried out looking into the determinants of SB in youth. Not only individual but also interpersonal, environmen-tal and policy determinants according to socioecological models have been studied. As SB tends to increase with age, interventions should start in young children. Fur-thermore, there is consistent evidence for weight status and baseline assessment of screen time being positively associated with screen time (at follow-up). A higher playground density and a higher availability of play and sports equipment at school, were consistently related to an increased total SB. Evidence was also reported for the presence of safe places to cross roads and lengthening morning and lunch breaks being associ-ated with less total SB. However, most factors were examined in only one or two studies and few studies examined a comprehensive set of factors at different levels of influences. Furthermore, the inconclusive results of the present review highlight the need for more longitudinal research and well-designed randomized controlled experiments.
Additional files
Additional file 1: Details of search strategy: Four main elements of the search and complete list of search terms. (DOCX 15 kb) Additional file 2: Quality Assessment of quantitative studies. (DOCX 15 kb)
Stierlin et al. International Journal of Behavioral Nutrition and Physical Activity (2015) 12:133
Abbreviations
CPM:Counts per minute; DEDIPAC: DEterminants of DIet and Physical ACtivity; SB: Sedentary behaviour; SES: Socioeconomic status. Competing interests
The authors declare that they have no competing interests. Authors’ contributions
AS, SdL, GC, SC and MdC conceptualized and designed the study. AS, SdL, BH, AK, GOD and MdC extracted the data. All authors contributed to the writing of the manuscript. All authors read and approved the final manuscript. Authors’ information
AS and SdL are joint first author. Acknowledgments
The preparation of this paper was supported by the DEterminants of DIet and Physical ACtivity (DEDIPAC) knowledge hub. This work is supported by the Joint Programming Initiative‘Healthy Diet for a Healthy Life’. The funding agencies supporting this work are (on alphabetical order of participating Member State): Belgium: Research Foundation– Flanders; France: Institut National de la Recherche Agronomique (INRA); Germany: Federal Ministry of Education and Research (BMBF); Ireland: The Health Research Board (HRB); The United Kingdom: The Medical Research Council (MRC).
Sara De Lepeleere is a recipient of a PhD-scholarship from the Flemish Agency for Care and Health (B/12732/01) and is supported by the Research Foundation Flanders (FWO) (FWO14/ASP/066). Marieke De Craemer is supported by the Research Foundation Flanders (FWO) (FWO.OPR.2013.0366.01). Author details
1Institute of Epidemiology and Medical Biometry, Ulm University, Ulm,
Germany.2Section Health Economics and Health Services Research, Department of Psychiatry II, Ulm University, Bezirkskrankenhaus Günzburg, Ulm, Germany.3Department of Movement and Sports Sciences, Ghent University, Ghent, Belgium.4Univ Paris Descartes, UMRS 1153, F-94807
Villejuif, France.5Division of Sports and Rehabilitation Medicine, Department of Medicine II, Ulm University, Ulm, Germany.6Sport and Exercise Sciences
Research Institute, University of Ulster, Northern Ireland, UK.7Centre for Preventive Medicine, Dublin City University, Dublin, Ireland.8Institute of
Applied Health Research, School of Health and Life Science, Glasgow Caledonian University, Glasgow, Scotland, UK.9Inserm U1153, ORCHARD,
Centre de Recherche Epidémiologie et Statistique Sorbonne Paris Cité (CRESS), Villejuif F-94807, France.
Received: 11 April 2015 Accepted: 25 September 2015
References
1. Chinapaw M, Altenburg T, Brug J. Sedentary behaviour and health in children - evaluating the evidence. Prev Med. 2015;70:1–2. 2. Carrel AL, Clark RR, Peterson SE, Nemeth BA, Sullivan J, Allen DB.
Improvement of fitness, body composition, and insulin sensitivity in overweight children in a school-based exercise program: a randomized, controlled study. Arch Pediatr Adolesc Med. 2005;159:963–8. 3. Gortmaker SL, Peterson K, Wiecha J, Sobol AM, Dixit S, Fox MK, et al.
Reducing obesity via a school-based interdisciplinary intervention among youth: Planet Health. Arch Pediatr Adolesc Med. 1999;153:409–18.
4. Robinson TN. Reducing children’s television viewing to prevent obesity: a randomized controlled trial. JAMA. 1999;282:1561–7.
5. Chinapaw MJ, Proper KI, Brug J, van Mechelen W, Singh AS. Relationship between young peoples’ sedentary behaviour and biomedical health indicators: a systematic review of prospective studies. Obes Rev. 2011;12:e621–32.
6. Tremblay MS, LeBlanc AG, Kho ME, Saunders TJ, Larouche R, Colley RC, et al. Systematic review of sedentary behaviour and health indicators in school-aged children and youth. Int J Behav Nutr Phys Act. 2011;8:98.
7. Ekelund U, Luan J, Sherar LB, Esliger DW, Griew P, Cooper A. Moderate to vigorous physical activity and sedentary time and cardiometabolic risk factors in children and adolescents. JAMA. 2012;307:704–12.
8. Herman KM, Hopman WM, Sabiston CM. Physical activity, screen time and self-rated health and mental health in Canadian adolescents. Prev Med. 2015;73C:112–6.
9. Gracia-Marco L, Rey-Lopez JP, Santaliestra-Pasias AM, Jimenez-Pavon D, Diaz LE, Moreno LA, et al. Sedentary behaviours and its association with bone mass in adolescents: the HELENA Cross-Sectional Study. BMC Public Health. 2012;12:971.
10. Chastin SF, Mandrichenko O, Skelton DA. The frequency of osteogenic activities and the pattern of intermittence between periods of physical activity and sedentary behaviour affects bone mineral content: the cross-sectional NHANES study. BMC Public Health. 2014;14:4.
11. Verloigne M, Van LW, Maes L, Yildirim M, Chinapaw M, Manios Y, et al. Self-reported TV and computer time do not represent accelerometer-derived total sedentary time in 10 to 12-year-olds. Eur J Pub Health. 2013;23:30–2. 12. Brug J, van Stralen MM, Te Velde SJ, Chinapaw MJ, De Bourdeaudhuij I, Lien
N, et al. Differences in Weight Status and Energy-Balance Related Behaviors among Schoolchildren across Europe: The ENERGY-Project. PLoS One. 2012;7:e34742.
13. Tremblay MS, LeBlanc AG, Janssen I, Kho ME, Hicks A, Murumets K, et al. Canadian sedentary behaviour guidelines for children and youth. Appl Physiol Nutr Metab. 2011;36:59–64.
14. Salmon J, Tremblay MS, Marshall SJ, Hume C. Health risks, correlates, and interventions to reduce sedentary behavior in young people. Am J Prev Med. 2011;41:197–206.
15. Janz KF, Burns TL, Levy SM. Tracking of activity and sedentary behaviors in childhood: the Iowa Bone Development Study. Am J Prev Med. 2005;29:171–8. 16. Hirvensalo M, Lintunen T. Life-course perspective for physical activity and
sports participation. Eur Rev Aging Phys Act. 2011;8:13–22.
17. Owen N, Sugiyama T, Eakin EE, Gardiner PA, Tremblay MS, Sallis JF. Adults’ sedentary behavior determinants and interventions. Am J Prev Med. 2011;41:189–96.
18. van Sluijs EM, McMinn AM, Griffin SJ. Effectiveness of interventions to promote physical activity in children and adolescents: systematic review of controlled trials. BMJ. 2007;335:703.
19. van Sluijs EM, Kriemler S, McMinn AM. The effect of community and family interventions on young people’s physical activity levels: a review of reviews and updated systematic review. Br J Sports Med. 2011;45:914–22. 20. Sallis JF, Owen N, Fisher EB. Ecological models of health behavior. In:
Glanz K, Rimer BK, Viswanath K, editors. Health behavior and health education. Theory, research, and practice. 4th ed. San Francisco, CA: Jossey-Bass; 2008. p. 465–86.
21. Uijtdewilligen L, Nauta J, Singh AS, van Mechelen W, Twisk JW, van der Horst K, et al. Determinants of physical activity and sedentary behaviour in young people: a review and quality synthesis of prospective studies. Br J Sports Med. 2011;45:896–905.
22. Lakerveld J, van der Ploeg HP, Kroeze W, Ahrens W, Allais O, Andersen LF, et al. Towards the integration and development of a cross-European research network and infrastructure: the DEterminants of DIet and Physical ACtivity (DEDIPAC) Knowledge Hub. Int J Behav Nutr Phys Act. 2014;11:143. 23. Bauman AE, Sallis JF, Dzewaltowski DA, Owen N. Toward a better
understanding of the influences on physical activity: the role of determinants, correlates, causal variables, mediators, moderators, and confounders. Am J Prev Med. 2002;23:5–14.
24. Treuth MS, Schmitz K, Catellier DJ, McMurray RG, Murray DM, Almeida MJ, et al. Defining accelerometer thresholds for activity intensities in adolescent girls. Med Sci Sports Exerc. 2004;36:1259–66.
25. Centre for Reviews and Dissemination: Systematic Reviews: CRD’s guidance for undertaking systematic reviews in health care. York: CRD, University of York; 2009. 26. Sallis JF, Prochaska JJ, Taylor WC. A review of correlates of physical activity
of children and adolescents. Med Sci Sports Exerc. 2000;32:963–75. 27. Kmet L, Lee RC, Cook LS. Standard quality assessment criteria for
evaluating primary research papers from a variety of fields. Institute of Health Economics 2004;1–31.
28. Hjorth MF, Chaput JP, Ritz C, Dalskov SM, Andersen R, Astrup A, et al. Fatness predicts decreased physical activity and increased sedentary time, but not vice versa: support from a longitudinal study in 8- to 11-year-old children. Int J Obes (Lond). 2014;38:959–65.
29. Ridgway CL, Brage S, Sharp SJ, Corder K, Westgate KL, van Sluijs EM, et al. Does birth weight influence physical activity in youth? A combined analysis of four studies using objectively measured physical activity. PLoS One. 2011;6:e16125.
Stierlin et al. International Journal of Behavioral Nutrition and Physical Activity (2015) 12:133