Reproducing Botryosphaeria dieback foliar symptoms in a simple model system
1 2 3
Reis Pedro1, Magnin-Robert Maryline2, Nascimento Teresa3, Spagnolo Alessandro2,
Abou-4
Mansour Eliane4, Cristina Fioretti2, Christophe Clément2, Rego Cecilia1*‡, Fontaine
5
Florence2*‡
6 7
1
Centro de Investigação em Agronomia, Alimentos, Ambiente e Paisagem (LEAF), Instituto
8
Superior de Agronomia, Universidade de Lisboa, Tapada da Ajuda, 1349-017 Lisbon, Portugal 9
2
SFR Condorcet, Université de Reims Champagne-Ardenne, URVVC EA 4707, Laboratoire Stress 10
Défenses et Reproduction des Plantes, Moulin de la Housse, BP 1039, 51687 Reims Cedex 2, 11
France 12
3
Departamento de Ciências e Engenharia de Biossistemas, Instituto Superior de Agronomia, 13
Universidade de Lisboa, Tapada da Ajuda, 1349-017, Lisbon, Portugal 14
4
Université de Fribourg, Département biologie végétale, 10 chemin du musée, 1700 Fribourg, 15
Switzerland. 16
17 ‡
These 2 authors participated equally in this work. 18
* Corresponding author: Fontaine Florence, E-mail: [email protected] 19 20 21 22 23 24
Plant Disease "First Look" paper • http://dx.doi.org/10.1094/PDIS-10-15-1194-RE • posted 02/10/2016
Abstract
25
Botryosphaeria dieback is a grapevine trunk disease with a worldwide distribution and associated 26
with Diplodia seriata and Neofusicoccum parvum among several other Botryosphaeriaceae species. 27
The aforementioned xylem-inhabiting fungi cause wood lesions, leaf and berry symptoms and 28
eventually lead to the death of the plant. The aim of this work was to develop a simple model 29
system to reproduce the foliar symptoms caused by D. seriata and N. parvum to better characterize 30
fungal pathogenicity and determine the mechanisms involved in symptom development. Green 31
stems of grafted grapevine cuttings cv. Aragonez were inoculated with three isolates of N. parvum 32
and two isolates of D. seriata with different degrees of virulence and the experiment was repeated 33
four times from 2011 to 2014. Three months after inoculation, the lesions associated with N. 34
parvum were larger than those associated with D. seriata. Similarly, eight months after inoculation
35
the percentage of plants showing foliar symptoms was greater in the N. parvum treatments than in 36
the D. seriata treatments. During the emergence of foliar symptoms, plant stress-related responses 37
were modulated in green stems and leaves, especially a down-regulation of superoxide dismutase 38
(SOD) and fasciclin-like arabinogalactan protein (fascAGP) and an up-regulation of stilbene 39
synthase (STS) with an accumulation of phenolics. In conclusion, the simple model system 40
developed allowed a good characterization of isolate pathogenicity and correlation with foliar 41
symptoms of Botryosphaeria dieback, namely spots on leaf margin and blade. 42
43 44
Plant Disease "First Look" paper • http://dx.doi.org/10.1094/PDIS-10-15-1194-RE • posted 02/10/2016
Several Botryosphaeriaceae species are associated worldwide with the grapevine trunk diseases 45
(GTDs) known as Botryosphaeria dieback (Moller and Kasimatis 1978; Larignon and Dubos 1997; 46
Graniti et al. 2000; Fischer 2006; Larignon et al. 2009; Úrbez-Torres 2011; Spagnolo et al. 2014a; 47
Larignon et al. 2015). The most common species isolated from grapevine-growing regions around 48
the world include Diplodia seriata De Not. (Cristinzio 1978; Rovesti and Montermini 1987; 49
Larignon et al. 2001; Castillo-Pando et al. 2001; Phillips et al. 2007; Savocchia et al. 2007; Úrbez-50
Torres et al. 2008) and Neofusicoccum parvum (Pennycook & Samuels) Crous, Slippers & A.J.L. 51
Phillips (Crous et al. 2006). These fungi are xylem-inhabiting and attack the framework of 52
grapevines causing perennial cankers in the wood, resulting in leaf and berry symptoms and finally 53
leading to the death of the plant. Symptoms are characterized by yellowish-orange (white cultivars) 54
or wine-red (red cultivars) spots on leaf margins and blade, and in most cases, the emergence of a 55
brown stripe on the wood under the bark (Larignon et al. 2001; Spagnolo et al. 2014a). This 56
symptom is often associated with a grey sector of rotted wood. Shrivelling and drying of 57
inflorescences or fruit clusters are frequently observed. 58
The incidence of Botryosphaeria dieback, together with two other trunk diseases, esca and 59
Eutypa dieback, has increased over the years. In France it was estimated that 13% of productive 60
vines were affected by GTDs in 2012 (Grosman and Doublet 2012; Bruez et al. 2013). Although 61
GTDs, including Botryosphaeria dieback, appear to be increasingly common, accurate knowledge 62
of host-pathogen interactions poses certain problems, including (i) determining the seasonal 63
influence on field-collected data due to an uncontrolled environment and (ii) distinguishing 64
pathogen effects on grapevines from effects in response to other biotic agents in the field. Research 65
has been developed to gain a better understanding of the mechanisms that are involved in symptom 66
expression by the artificial reproduction of the symptoms through individual or combined 67
inoculations of pathogenic fungi or by the use of simpler grapevine model systems (e.g., cuttings, 68
grapevine in vitro plants, or grapevine cultured cells) under controlled conditions. Regarding 69
Plant Disease "First Look" paper • http://dx.doi.org/10.1094/PDIS-10-15-1194-RE • posted 02/10/2016
Eutypa dieback symptoms, the stunting of new shoots with small cup-shaped, chlorotic and tattered 70
leaves, were reproduced on greenhouse cuttings that were infected with Eutypa lata ascospores or 71
mycelial plugs (Petzoldt et al. 1981; Péros and Berger 1994, 1999; Sosnowski et al. 2007). For esca 72
disease, pathogenicity tests were carried out in a greenhouse with vines inoculated with 73
Phaeomoniella chlamydospora (Chiarappa 2000). Although a significant reduction of growth was
74
observed, typical foliar symptoms were not reproduced. With P. chlamydospora, similar results 75
were obtained with inoculated cuttings as reported by Gerbore (2013) and Pierron et al. (2015). For 76
Botryosphaeria dieback, no studies have been reported on the development of such model systems, 77
both necrosis and foliar symptom development, for the analysis of pathogenicity. 78
Data crossing of plant-response and fungal-activity in compatible interactions could yield 79
important information about the mechanisms developed by fungi to colonize grapevine and the 80
protective response of the grapevine to limit the development of the fungi. The difficulties of such 81
work could arise from the fact that the grapevine is a perennial plant cultivated worldwide under 82
various environmental conditions. The development of a simple model system for the inoculation of 83
grapevine plants under controlled conditions to optimize and validate disease development is 84
required. With such a tool, knowledge of the interactions between the GTD agents could progress 85
and such a model system could represent a first step towards the development of management 86
solutions against these diseases as the visual presence of symptoms in leaves leads to an early 87
diagnostic. The aim of this work was to develop a simple model system using D. seriata and N. 88
parvum to better characterize their virulence by measuring the size of lesions and evaluating the
89
percentage of vines developing foliar symptoms, and thereby understand their impact on vine 90
physiology by studying the stress response at a molecular level and by quantification of phenolic 91
compounds. 92
93
Materials and Methods
94
Plant Disease "First Look" paper • http://dx.doi.org/10.1094/PDIS-10-15-1194-RE • posted 02/10/2016
Plant material and fungal inoculation. Each year, during a four-year period (2011–2014),
95
one year old grafted grapevine cuttings cv. Aragonez (= Tempranillo) were potted individually in 96
one litre, free draining bag containing a sandy soil mixture (1/3 sand, 1/3 soil, 1/3 organic matter) 97
and placed using a completely randomized design in a ventilated greenhouse at 24°C under natural 98
light. After one month of growth, plants were inoculated with isolates of N. parvum (Np) and D. 99
seriata (Ds) with two different origins (Portuguese, isolated by C. Rego and French, isolated by P.
100
Larignon) and different degrees of aggressiveness (Larignon et al. 2001; Rego et al. 2009) (Table 101
1). A three mm area of the bark was removed with a cork borer from the base of the primary stems 102
(approximately 1.5cm diameter) between the second and third nodes. The wounds were inoculated 103
with three mm mycelial plugs taken from the actively growing margin of 8-day old colonies of Np 104
and Ds growing on potato dextrose agar (PDA, Difco, BD, Sparks, MD, USA) at 24°C in darkness. 105
Each inoculation point was covered with moist cotton wool and sealed with Parafilm. In 2014, the 106
causal agent of black rot of vine Phyllosticta ampelicida (Engelm.) Aa (isolates Gb 32 and Gb 17), 107
Cladosporium sp. and Penicillium sp. isolates (Table 1) were also inoculated in the same manner as
108
positive controls to determine if the expression of foliar symptoms was specific to both Np and Ds. 109
Negative controls were inoculated using the same method but with sterile three mm PDA plugs to 110
confirm that lesions were due to infection by the pathogens and not to the wounding. There were 30 111
replicates for each treatment and the experiment was kept in the same greenhouse to observe foliar 112
symptom emergence eight months after inoculation. 113
Determination of lesion size, symptoms appearance and isolation of pathogens.
114
The dimension of lesions was evaluated three months after inoculation on green shoots, before 115
lignification occurred, by measuring the width and the length and therefore calculating the elliptical 116
area of the lesion. All statistical analyses were performed using STATISTICA (StatSoft, Inc. 2007, 117
version 8.0). Homogeneity of variance was tested using Levene’s test. Residuals were visually 118
inspected for each experiment, and when necessary the log10 transformation was used to improve
119
Plant Disease "First Look" paper • http://dx.doi.org/10.1094/PDIS-10-15-1194-RE • posted 02/10/2016
homogeneity of variance. One–way analysis of variance (ANOVA) was used to compare 120
differences in mean lesions (width, length and area of discoloration) among fungal isolates and 121
species. Means were separated using Tukey’s test at the 5% significance level. Percentage of 122
grapevines in each treatment that showed foliar symptoms was visually inspected. When one or 123
more leaves expressed spots and/or chlorotic areas the plant was considered positive for expression 124
of foliar symptoms. Data collected from each trial were subjected to Chi-Square statistical analysis 125
(χ2 test) at the 5% significance level. Treatment means were compared using Tukey’s test at the 5% 126
significance level. Percentages were transformed to arcsine-square root values before analysis. 127
In order to fulfil Koch’s postulates, small pieces of necrotic tissue from the edge of each 128
lesion were cut and placed on PDA medium amended with 250 mg L-1 chloramphenicol 129
(BioChemica, AppliChem, Germany) to recover the inoculated fungi. 130
Plant RNA extraction. When foliar symptoms first appeared, symptomatic and
131
asymptomatic leaves and stems were collected in 2012 from symptomatic and asymptomatic plants, 132
respectively, immediately wrapped in aluminium foil, frozen in liquid nitrogen and stored at -80°C. 133
Samples were ground in liquid nitrogen to a fine powder. Plant RNA Purification Reagent 134
(Invitrogen, Cergy Pontoise, France) was used to isolate total RNA from 1×50 mg of leaf tissue 135
powder and 2×50 mg of green stem powder. The RNA pellet was resuspended in 20 µL of RNase-136
free water, treated with RQ1 DNase enzyme (Promega, Mannheim, Germany), and RNA was 137
quantified by measuring the absorbance at 260 nm according to the manufacturer’s instructions and 138
stored at -80°C before use. 139
Real-time RT-PCR analysis of gene expression. In all, 150 ng of total RNA was
reverse-140
transcribed using the Verso SYBR 2-step QRT ROX enzyme (ABgene, Surrey, UK) according to 141
the manufacturer’s protocol. PCR conditions were as described by Bézier et al. (2002). Gene 142
expression was tracked by quantitative Reverse-Transcription Polymerase Chain Reaction using the 143
primers reported in Table 2. The fourteen genes studied were previously selected from a proteomic 144
Plant Disease "First Look" paper • http://dx.doi.org/10.1094/PDIS-10-15-1194-RE • posted 02/10/2016
study (Spagnolo et al. 2012) focused on grapevine reactions in response to trunk diseases, six genes 145
involved in detoxication and stress tolerance (Halh, epoxHF, GST5, SOD, HSP, epoxH2), one 146
involved in terpenoid synthesis (DXS1), 2 genes encoding for PR protein, one involved in wall cell 147
compound synthesis (fascAGP), one encoding for an aquaporin (PIP2.2) and the three last ones 148
involved in the phenylpropanoid pathway (STS, PPO, Lac17) (Table 2). Two housekeeping genes 149
were used as the internal standard to normalize the starting template of cDNA for each matrix (for 150
leaves: α-chain elongation factor 1 gene EF1- α and 39S ribosomal protein L41-A 39SRP; for green 151
stem EF1- α and 60S ribosomal protein L18 60SRP). Reactions were carried out in a real-time PCR 152
detector Chromo 4 apparatus (Bio-Rad) using the following thermal profile: 15 s at 95°C 153
(denaturation) and 1 min at 60°C (annealing/extension) for 40 cycles. Melting curve assays were 154
performed from 65 to 95°C at 0.5°C s-1. Melting peaks were visualized to check the specificity of 155
each amplification. Results correspond to the means of the independent experiments that were 156
expressed relative to the control corresponding to a fixed value of 1. Control samples consisted of 157
non-inoculated plant. The genes analysed were considered significantly up- or down-regulated 158
when changes in their expression was >2× or <0.5×, respectively. 159
Extraction and quantification of phenolic compounds. The protocol used is described in
160
Spagnolo et al. (2014b). Briefly, methanolic extracts were prepared from 50 mg of powdered leaf 161
and green stem tissues mixed with 1 mL of methanol (MeOH) and 25 µL of the internal standard 162
trans-4-hydroxystilbene (0.5 mg mL-1). For quantitative analysis of stilbenes, 60 µL of methanolic
163
extract was analysed by high-performance liquid chromatography. Standards such as trans-piceid, 164
trans-resveratrol and trans-pterostilbene (Supplemental Fig. 1) were purchased from Extrasynthèse
165
(Genay - France). The trans-ε-viniferin, trans-vitisin A and trans-vitisin B (Supplemental Fig. 1) 166
were obtained from lignified canes of cv. Syrah as described in Spagnolo et al. (2014). Spectral data 167
for all peaks were accumulated in the range between 220 and 600 nm. The data are reported as µg g -168
1
of fresh weight, with a standard deviation from three independent extractions and analyses. To 169
Plant Disease "First Look" paper • http://dx.doi.org/10.1094/PDIS-10-15-1194-RE • posted 02/10/2016
determine whether concentration of control plants were significantly different from the inoculated 170
plants, a Dunn’s Multiple Comparison Test was used. Differences at P ≤ 0.05 were considered 171 significant. 172 173 Results 174
Observation of lesion and foliar symptom expression on plants inoculated with N.
175
parvum and D. seriata. For each year and for each isolate, thirty grafted vines growing under
176
greenhouse conditions were inoculated individually with Np 19, Np 67, Np AR, Ds 98-1 and Ds 99-177
7 fungal isolates. Control grafted vines were maintained under the same greenhouse conditions. 178
Three months after inoculation, dark brown lesions developed on green stems for all the inoculated 179
isolates (Fig. 1) and their size was evaluated in terms of width, length and surface area (Table 3). V-180
shaped cankers were also observed when cross sections were made on symptomatic canes. For the 181
four years repetitions, mean lesion widths associated with Ds 98-1, Ds 99-7 and Np AR infection 182
were slightly lower than those associated with Np 19 and Np 67. Mean lesion lengths associated 183
with Np 67 and Np AR were higher than those for Ds 98-1, Ds 99-7 and Np 19. Thus, the mean 184
lesion surface areas associated with Np 67 and Np AR were greater than those associated with Ds 185
98-1, Ds 99-7 and Np 19 (Table 3). Each year, eight months after inoculation, foliar symptoms 186
appeared in some of the thirty infected grapevines per isolate. These were characterized by typical 187
orange/red spots at the margins of the leaf and large chlorotic areas between veins (Fig. 2). Plants 188
were visually evaluated and the percentage of infected plants showing foliar symptoms was greater 189
for Np 67 and Np 19 (for example, 73.3% in 2014) than for Ds 99-7, Ds 98-1 and Np AR with 190
values of 30.0%, 50.0% and 60.0%, respectively. None of the 30 control plants showed symptoms 191
(Table 4). The positive control assay revealed that both Gb 17 and Gb 32 produced lesions on green 192
stems but no foliar symptoms were observed, while Cladosporium sp. and Penicillium sp. gave rise 193
to small necroses similar to those recorded for the negative controls and foliar symptoms were 194
Plant Disease "First Look" paper • http://dx.doi.org/10.1094/PDIS-10-15-1194-RE • posted 02/10/2016
absent (Table 5). Reisolation of Ds, Np and Gb isolates was always higher than 70%. No N. parvum 195
and D. seriata were reisolated neither from the Cladosporium sp. and Penicillium sp. inoculations 196
nor from the controls. 197
198
Stress-related responses in stems and leaves of symptomatic plants inoculated with N.
199
parvum and D. seriata. The expression of selected stress-related genes was monitored in organs of
200
symptomatic plants to determine if there was a correlation between the severity of symptoms 201
(lesions and foliar symptoms) and the stress induced in plants in response to fungal inoculation. 202
Results of the gene expression analysis in leaves and green stems are summarized in Fig. 3. The 203
genes considered were grouped in different functional categories according to the organ studied. 204
Concerning the genes involved in detoxification and stress tolerance, no changes in gene 205
expression were observed for GST5 (glutathione-S-transferase) and both epoxHF and epoxH2 206
(epoxide hydrolases) in plant tissues under our conditions (Figs. 3 and 4). A slight down-regulation 207
of Hahl (haloacid dehalogenase hydrolase) was observed in all inoculated plants irrespective of the 208
fungal species (Fig. 3). The expression of SOD, encoding a superoxide dismutase was weakly 209
repressed in asymptomatic (AP) and symptomatic leaves (SP) of plants inoculated with Np 19 and 210
not affected in plants inoculated with other isolates tested (Np 67, Np AR, Ds 98-1 and Ds 99-7) 211
(Fig. 3). The gene expression of an alpha crystalline small heat-shock protein (HSP), regarded as a 212
molecular chaperone, was not affected in leaves of inoculated plants. On the contrary, this gene was 213
up-regulated in green stems with AP and SP leaves of plants infected by all 5 isolates of 214
Botryosphaeriaceae apart from Ds 99-7 where HSP was up-regulated, but only in stems with
215
symptomatic leaves (Fig. 4). 216
Two genes encoding pathogenesis-related (PR) proteins were also investigated, a β-1,3-217
glucanase (Gluc) gene and a serine protease inhibitor (PR6) gene. In leaves of plants inoculated 218
with Botryosphaeriaceae fungi, Gluc was generally weakly repressed in AP, while PR6 was 219
Plant Disease "First Look" paper • http://dx.doi.org/10.1094/PDIS-10-15-1194-RE • posted 02/10/2016
generally induced in both AP and SP (Fig. 3). Interestingly, GLUC was up-regulated in green stems 220
of plants infected with Np and down-regulated in plants infected with Ds (Fig. 4). The gene DXS 221
encodes the enzyme 1-deoxy-D-xylulose 5-phosphate synthase, involved in the first major step of 222
terpenoid synthesis, DXS was weakly down-regulated in leaves of SP inoculated with Np or Ds 223
species. Our results also showed that the expression of the gene encoding a fasciclin-like 224
arabinogalactan protein (fascAGP) was repressed in green stems of AP and SP infected with Np 67 225
and Np AR, both these Botryosphaeriaceae species produced the biggest necroses. The aquaporin 226
plasma membrane intrinsic protein 2-2 encoding gene (PIP2.2) was not affected in green stems, 227
whereas it was repressed in asymptomatic and symptomatic leaves of plants inoculated with both 228
Np and Ds 99-7, with a high repression in SP plants. 229
For genes involved in the phenylpropanoid pathway, the stilbene synthase (STS) gene was 230
weakly up-regulated in green stems of grapevine inoculated with Np67, Np19 and NpAR (Fig. 4). 231
The second gene involved in this pathway, encoding a polyphenoloxidase (PPO) was tested. PPO 232
was only down-regulated in stems (AP and SP) of plants inoculated with Np 67 and Np 19, such as 233
7-fold for Np 67 (Fig. 4). Moreover, the laccase 17-like (Lac17) gene, encoding the enzyme that 234
belongs to the group of PPO, was also generally repressed in leaves of AP and SP, infected by the 5 235
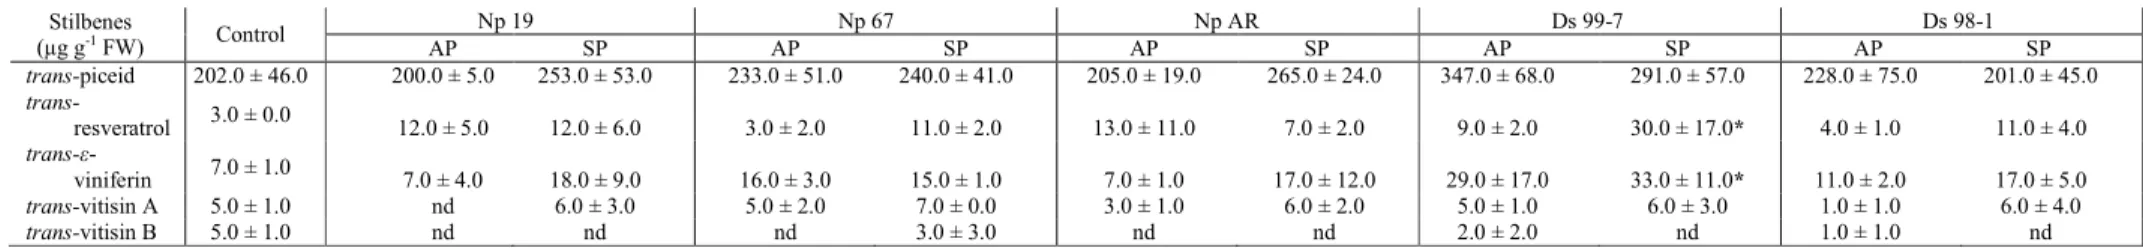
isolates of Botryosphaeriaceae tested. For plant metabolites monitored, targeted polyphenolic 236
compounds were quantified, especially piceid, resveratrol, ε-viniferin, trans-237
vitisin A and trans-vitisin B (leaves - Table 6; green stems – Table 7). Their distribution was 238
different between leaves and green stems. A high level of trans-piceid was observed in leaves in 239
comparison to green stems, where trans-vitisin B was well detected and quantified in green stems 240
and only weakly accumulated in leaves (Tables 6 and 7). A similar pattern was found for trans-ε-241
viniferin, with a high content in green stems compared to leaves (Tables 6 and 7). This variation 242
may be impacted by the developmental stage of green stems. Thus, the sampling of green stems was 243
carried out when lignification began under greenhouse conditions. Moreover, phenolics were 244
Plant Disease "First Look" paper • http://dx.doi.org/10.1094/PDIS-10-15-1194-RE • posted 02/10/2016
significantly accumulated in symptomatic organs of plant inoculated with Ds strains. Both trans-245
resveratrol and trans-ε-viniferin were detected in symptomatic leaves of plants inoculated with Ds 246
99-7 (Table 6). A significant accumulation of trans-resveratrol and trans-vitisin B was also 247
observed in symptomatic green stems of plants inoculated with Np AR (Table 7), which could 248
correlate with an up-regulation of STS in the same samples. 249
250
Discussion
251
This study is the first to report the reproduction of foliar symptoms after artificial infection 252
of grapevines with Botryosphaeriaceae species as described for E. lata and the reproduction of 253
Eutypa dieback (Péros and Berger 1994, Camps et al. 2010). Pathogenicity trial with 254
Botryosphaeriaceae species have already been conducted but solely lesions at the initial inoculation
255
point were described and no foliar symptoms were developed (Taylor et al. 2005, Úrbez-Torres and 256
Gubler 2009). In our study, lesion sizes and expression of foliar symptoms differed according to the 257
fungal strains inoculated. Pathogenicity experiments showed that isolates Np 67 and Np AR 258
produced longer lesions with greater surface area than isolates Ds 98-1, Ds 99-7 and Np 19. 259
Furthermore, in plants inoculated with Np species the percentage of infected plants displaying foliar 260
symptoms was more than 50% and could reach 73%. 261
According to Úrbez-Torres (2011) Botryosphaeriaceae species that infect grapevines can be 262
divided into three different groups based on aggressiveness rankings (high, moderate or low) where 263
Neofusicoccum spp. belong to the highly aggressive group while Diplodia spp. belong to the
264
moderately aggressive group. In pathogenicity tests on grapevine green stems (cv. Mourvèdre) 265
inoculated with Np or Ds, Spagnolo et al. (2014a) showed that mean lesion lengths differed 266
significantly between Np and Ds isolates. Lesions associated with Np infection were 39.6 ± 9.1 mm 267
long, while those associated with Ds infection were 14.3 ± 3.9 mm. Moreover, the largest lesions 268
were recorded at the onset of flowering, whereas at separated clusters (G stage) and veraison, no 269
Plant Disease "First Look" paper • http://dx.doi.org/10.1094/PDIS-10-15-1194-RE • posted 02/10/2016
significant differences between the fungi could be detected. These results reveal that the 270
development of lesions may be influenced by aggressiveness of the fungal strain as well as plant 271
phenological stage (Spagnolo et al. 2014b). 272
Production of phytotoxic metabolites by Botryosphaeriaceae species has been reported by 273
Martos et al. (2008), Andolfi et al. (2011) and Abou-Mansour et al. (2015). Ramirez-Suero et al. 274
(2014) reported necrosis that appeared in calli of cv. Chardonnay sub-cultured on media containing 275
extracellular metabolites produced by different isolates of Np and Ds. The metabolites produced by 276
Np Bourgogne S-116 caused total necrosis of calli whereas metabolites from both isolates Ds 98.1 277
and Ds 99.7 induced only partial necrosis. These results are also in agreement with those obtained 278
by Martos et al. (2008) who found a greater phytotoxic activity on grapevine leaves cv. Aragonez 279
treated with culture filtrates from Np compared to Ds. These results confirm that Np isolates are 280
more virulent than those of Ds. Moreover, studies from different countries reported differential 281
susceptibility to wood necrosis caused by Botryosphaeriaceae fungi (Taylor et al. 2005; Amponsah 282
et al. 2011; Guan et al 2015). Further work needs to be carried out to elucidate the mechanisms of 283
the various susceptibility in cultivars in terms of plant immunity and phytotoxic activity of fungi. 284
The response of plants to infection and emergence of foliar symptoms were studied in terms 285
of the genes involved in detoxification and stress tolerance. Thus, no modifications of GST5, 286
epoxHF or epoxH2 expression were detected under the conditions tested in this paper. In contrast,
287
Spagnolo et al. (2012) showed that these genes were up-regulated in leaves and stems of grapevine 288
affected by GTDs in the vineyard. It has been demonstrated that several toxins produced by GTD 289
agents contain epoxides (Andolfi et al. 2011; Abou-Mansour et al. 2015) and detoxification 290
enzymes have been hypothesized to have a role in the detoxification of these compounds or their 291
active derived-compounds metabolized in grapevines (Spagnolo et al. 2014a; Abou-Mansour et al. 292
2015). A weak repression of SOD was observed in leaves of plants inoculated with Np 19 and Ds 293
98-1. A similar trend was reported in asymptomatic leaves and green stems of apoplectic plants and 294
Plant Disease "First Look" paper • http://dx.doi.org/10.1094/PDIS-10-15-1194-RE • posted 02/10/2016
those affected by esca proper (Letousey et al. 2010; Magnin-Robert et al. 2011; Spagnolo et al. 295
2012). These results suggest that important down-regulation of SOD occurs before symptoms 296
appear on the plant. Repression of SOD could indicate a lack of oxidative stress control, which 297
could be lethal for plants (Letousey et al. 2010). Similar to previous studies, where an increased 298
abundance of HSPs was reported in green stems of both field-grown plants artificially infected with 299
Np and Ds (Spagnolo et al. 2014b) and grapevine affected by esca proper and apoplexy (Spagnolo 300
et al. 2012), an up-regulation of HSP was detected in green stems of plants inoculated with the 5 301
Botryosphaeriaceae isolates. HSPs function by binding partially denatured proteins to prevent
302
irreversible protein inactivation and aggregation (Waters et al. 1995) and could be an indicator of a 303
plant tolerant state. 304
To compare defence responses of plants inoculated by Np and Ds isolates, we targeted the 305
most frequently observed and the best characterized active defence mechanisms in grapevine, 306
namely the phenylpropanoid pathway. STS expression was induced in green stems of vines 307
inoculated with the three Np isolates. These two fungi were previously described as inducing the 308
largest lesion sizes (surface and length). In addition to STS up-regulation, only the symptomatic 309
green stems of plants inoculated with Np AR showed significant accumulation of trans-resveratrol. 310
Various studies have also described an up-regulation of STS in the leaves of field-grown grapevines 311
affected by GTDs (Letousey et al. 2010; Magnin-Robert et al. 2011). Moreover, Ramirez-Suero et 312
al. (2014) showed that extracellular compounds produced by Np and Ds induce the expression of 313
STS in cv. Chardonnay calli. All these data suggest that the STS gene could be a good marker of
314
stress responses, such as oxidant stress. In this sense, stilbenic polyphenols are also able to scavenge 315
reactive oxygen species (ROS) and so protect the plant cells from oxidative stresses after pathogen 316
attack (Bertsch et al. 2013). Another targeted gene, PPO, shown to be involved in plant resistance 317
(Thipyapong et al. 2007) was down-regulated only in stems of plants inoculated with Np isolates, 318
thus inducing larger cankers. Moreover, a repression of Lac17 expression was observed in leaves of 319
Plant Disease "First Look" paper • http://dx.doi.org/10.1094/PDIS-10-15-1194-RE • posted 02/10/2016
plants inoculated with Np and Ds strains. These results suggest that GTD fungal agents induce 320
strong perturbations of PPO. Regarding the absence of variation in stilbenoids and the repression of 321
PPO expression in plants inoculated with Np strains, another group of phenolics may be impacted
322
such as flavonoids or lignin precursors. Along the same lines, Lima et al. (2010) reported an 323
accumulation of quercetin-3-O-glucoside and caffeic acid in healthy leaves of the asymptomatic 324
cordons of esca-affected plants and a decrease in the same compounds in diseased leaves. 325
Regarding PR proteins expression, an up-regulation of PR6 was observed in leaves in 326
response to infection with Botryosphaeriaceae. These observations are in accordance with previous 327
studies showing modulation of PR-protein (PR6, chitinase, β-1,3-glucanase) expression in leaves, 328
green stems and wood of vines affected by GTDs (Valtaud et al. 2009; Camps et al. 2010; Letousey 329
et al. 2010; Magnin-Robert et al. 2011; Spagnolo et al. 2012; Spagnolo et al. 2014b, Fontaine et al. 330
2015). Altogether, these data may indicate that PR6 plays a defensive role during the response of 331
grapevines to GTD fungal agents. The fascAGP genes belong to the large family of hydroxyproline-332
rich glycoproteins (HRGPs) proteins, which are thought to accumulate in response to elicitor 333
molecules released by fungi and to play a role in plant defence responses (Agrios 2005). Our results 334
showed an alteration of fascAGP expression, which suggests its possible role as a marker of stress 335
responses triggered by GTD agents. Meanwhile, expression of PIP2.2, encoding a membrane water 336
channel playing a role in controlling the water content of cells, was repressed by fungal infection 337
only in leaves as previously reported in leaves of field-grown vines affected by apoplexy events 338
(Letousey et al. 2010). It seems that GTDs may perceive a water stress signal only in the later steps 339
of the disease and that the appearance of symptoms cannot be simply considered as a water 340
transport-deficit-inducing disease but other physiological mechanisms may be involved (Christen et 341
al. 2007). 342
343
Plant Disease "First Look" paper • http://dx.doi.org/10.1094/PDIS-10-15-1194-RE • posted 02/10/2016
To conclude, our study shows that one-year-old vines infected with Botryosphaeriaceae species,
344
Ds and Np, induce lesions on the stem and expression of foliar symptoms. This is the first time that 345
the reproduction of foliar symptoms with both species is reported, with a frequency reaching 77% 346
and a value close to those observed in the vineyard. In addition, since the responses of plants 347
artificially infected show similarities to those observed in plants naturally infected in the vineyard, 348
this simple model system could be useful in future studies aimed at determining the relationship 349
between fungi and the appearance of foliar symptoms, especially in a chronic form, and to test eco-350
friendly strategies to manage Botryosphaeria dieback. Among the gene expressions studied and the 351
phenolics found, some could be selected as markers for the emergence of disease such as SOD, STS 352
and fascAGP and flavonoids. Further work will be aimed at quantifying phytotoxic compounds 353
reported from Ds and Np (Djoukeng et al. 2009; Evidente et al. 2010; Abou-Mansour et al. 2015) 354
such as dihydroisocoumarin and epoxytoluquinol derivatives, on leaves and green stems to better 355
appreciate the molecular dialogue between fungi and plants, since these fungi have never been 356 detected in leaves. 357 358 Acknowledgments 359
This research was financed by the French government CASDAR V903 and V1301 (Compte 360
d’Affectation Spéciale au Développement Agricole et Rural), by Champagne-Ardenne Region, by 361
the national program France Agrimer and was also supported by the European COST Action 362
FA1303 “Sustainable control of grapevine trunk diseases”. The authors thank Philippe Larignon for 363
giving Diplodia seriata strains; Mariana Mota (PhD) from the University of Lisboa for the support 364
in processing the sequencing data; Phillips Alan, a native speaker and researcher in the University 365
Nova of Lisboa, Portugal, and Buchala Antony, researcher in the University of Fribourg, 366
Switzerland, for revising the English of this manuscript. 367
368
Plant Disease "First Look" paper • http://dx.doi.org/10.1094/PDIS-10-15-1194-RE • posted 02/10/2016
369
Literatured cited
370
Abou-Mansour, E., Débieux, J., Ramírez-Suero, M., Bénard-Gellon, M., Magnin-Robert, M., 371
Spagnolo, A., Chong, J., Farine, S., Bertsch, C., L’Haridon, F., Serrano, M., Fontaine, F., Rego 372
C., and Larignon, P. 2015. Phytotoxic metabolites from Neofusicoccum parvum, a pathogen of 373
Botryosphaeria dieback of grapevine. Phytochemistry 115:207-215. 374
Agrios, G.N. 2005. Plant Pathology. Academic Press. San Diego, USA. 375
Amponsah, N.T., Jones, E.E., Ridgway, H.J., and Jaspers, M.V. 2011. Identification, potential 376
inoculum sources and pathogenicity of botryosphaeriaceous species associated with grapevine 377
dieback disease in New Zealand. Eur. J. Plant Pathol. 131:467–482. 378
Andolfi, L., Mugnai, L., Luque, J., Surico, G., Cimmino, A., and Evidente, A. 2011. Phytotoxins 379
produced by fungi associated with grapevine trunk diseases. Toxins 3:1569–605. 380
Bézier, A., Lambert, B., and Baillieul, F. 2002. Study of defense‐related gene expression in 381
grapevine leaves and berries infected with Botrytis cinerea. Eur. J. Plant Pathol. 108:111-120. 382
Bertsch, C., Ramirez-Suero, M., Magnin-Robert, M., Larignon, P., Chong, J., Abou-Mansour, E., 383
Spagnolo, A., Clément, C., Fontaine F. 2013. Trunk diseases of grapevine: complex and still 384
poorly. Plant Pathol. 62:243-265. 385
Bruez, E., Lecomte, P., Grosman, J., Doublet, B., Bertsch, C., Fontaine, F., Da Costa, J. P., Ugaglia, 386
A., Teissedre, P. L., Guerin-Dubrana, L., and Rey, P. 2013. Overview of grapevine trunk 387
diseases in France in the early 2000s. Phytopathol. Mediterr. 52:262-275. 388
Camps, C., Kappel, C., Lecomte, P., Léon, C., Gomès, E., Coutos-Thévenot, P. and Delrot, S. 2010. 389
A transcriptomic study of grapevine (Vitis vinifera cv. Cabernet-Sauvignon) interaction with the 390
vascular ascomycete fungus Eutypa lata. J. Exp. Bot. 61:1719-1737. 391
Castillo-Pando, M., Sommers, A., Green, C. D., Priest, M., and Sriskanthades, M. 2001. Fungi 392
associated with dieback of Semillon grapevines in the Hunter Valley of New South Wales. 393
Australas. Plant Pathol. 30:59-63. 394
Plant Disease "First Look" paper • http://dx.doi.org/10.1094/PDIS-10-15-1194-RE • posted 02/10/2016
Chiarappa, L. 2000. Esca (black measles) of grapevine. An overview. Phytopathol. Mediterr. 39:11-395
15. 396
Christen, D., Schonmann, S., Jermini, M., Strasser, R. J., and Defago, G. 2007. Characterization 397
and early detection of grapevine (Vitis vinifera) stress responses to esca disease in situ 398
chlorophyll fluorescence and comparison with drought stress. Env. Exp. Bot. 60:504–514. 399
Cristinzio, G. 1978. Gravil attachi di Botryosphaeria obtusa su vite provincial di Insernia. Inf. 400
Fitopatol. 6:21-23. 401
Crous, P. W., Slippers, M. J., Rheeder, J., Marasas, W. F. O., Phillips, A. J. L., Alves, A., Burgess, 402
T., Barber, P., and Groenewald, J. Z. 2006. Phylogenetic lineages in the Botryosphaeriaceae. 403
Stud. Mycol. 55:235-253. 404
Djoukeng, J. D., Polli, S., Larignon, P., and Abou-Mansour, E., 2009. Identification of phytotoxins 405
from Botryosphaeria obtusa, a pathogen of black dead arm disease of grapevine. Eur. J. Plant 406
Pathol. 124: 303-308. 407
Evidente, A., Punzo, B., Andolfi, A., Cimmino, A., Melck, D., and Luque, J. 2010. Lipophilic 408
phytotoxins produced by Neofusicoccum parvum, a grapevine canker agent. Phytopathol. 409
Mediterr. 49:74-79. 410
Fontaine, F., Pinto, C., Vallet, J., Clément, C., Gomes, A., and Spagnolo, A. 2015. The effects of 411
Grapevine Trunk Diseases (GTDs) on vine physiology. Eur. J. Plant Pathol. DOI 412
10.1007/s10658-015-0770-0 413
Fischer, M. 2006. Biodiversity and geographic distribution of Basidiomycetes causing esca-414
associates white rot in grapevine: a worlwide perspective. Phytopathol. Mediterr. 45:S30–S42. 415
Gerbore, J., Benhamou, N., Vallance, J., Le Floch, G., Grizard, D., Regnault-Roger, C., and Rey, P. 416
2013. Biological control of plant pathogens: advantages and limitations seen through the case 417
study of Pythium oligandrum. Environ. Sci.Pollut. Res. 21:4847-4860. 418
Plant Disease "First Look" paper • http://dx.doi.org/10.1094/PDIS-10-15-1194-RE • posted 02/10/2016
Graniti, A., Surico, G., and Mugnai, L. 2000. Esca of grapevine: a disease complex or a complex of 419
diseases? Phytopathol. Mediterr. 39:16–20. 420
Grosman, J., and Doublet, B. 2012. Maladies du bois de la vigne. Synthèse des dispositifs 421
d’observation au vignoble, de l’observatoire 2003–2008 au réseau d’epidémio-surveillance 422
actuel. Phytoma 651:31–35. 423
Guan, X., Essakhi, S., Laloue, H., Nick, P., Bertsch, C., and Chong, J. 2015. Mining new resources 424
for grape resistance against Botryosphaeriaceae: a focus on Vitis vinifera ssp. sylvestris. Plant 425
Pathol. Doi:10.1111/ppa.12405. 426
Larignon, P., and Dubos, B. 1997. Fungi associated with esca disease in grapevine. Eur. J. Plant 427
Pathol. 103:147–157. 428
Larignon, P., Fulchic, R., Laurent, C., and Dubos, B. 2001. Observation of black dead arm in 429
French vineyards. Phytopathol. Mediterr. 40:S336-S342. 430
Larignon, P., Fontaine, F., Farine, S., Clément, C., and Bertsch, C. 2009. Esca et Black Dead Arm: 431
deux acteurs majeurs des maladies du bois chez la vigne. C. R. Biologies 332:765–783. 432
Larignon, P., Spagnolo, A., Bertsch, C., Fontaine, F. 2015. First report of young grapevine decline 433
caused by Neofusicoccum parvum in France. Plant disease, first look, 15 June 2015. 434
Lima, M. R. M., Felgueiras, M. L., Graça, G., Rodrigues, J. E. A., Barros, A., Gil, A. M., and Dias, 435
A. C. P. 2010. NMR metabolomics of esca-disease-affected Vitis vinifera cv. Alvarinho leaves. 436
J. Exp. Bot. 14:4033-4042. 437
Letousey, P., Baillieul, F., Perrot, G., Rabenoelina, F., Boulay, M., Valliant-Gaveau, N., Clément, 438
C., and Fontaine, F. 2010. Early events prior to visual symptoms in the apoplectic form of 439
grapevine esca disease. Phytopathology 100:424–431. 440
Magnin-Robert, M., Letousey, P., Spagnolo, A., Rabenoelina, F., Jacquens, L., Mercier, L., 441
Clément, C., and Fontaine, F. 2011. Leaf stripe form of esca induces alteration of photosynthesis 442
and defence reactions in presymptomatic leaves. Funct. Plant Biol. 38:856-866. 443
Plant Disease "First Look" paper • http://dx.doi.org/10.1094/PDIS-10-15-1194-RE • posted 02/10/2016
Martos, S., Andolfi, A., Luque, J., Mugnai, L., Surico, G., and Evidente, A. 2008. Production of 444
phytotoxic metabolites by five species of Botryosphaeriaceae causing decline on grapevines, 445
with special interest in the species Neofusicoccum luteum and N. parvum. Eur. J. Plant Pathol. 446
121:451-461. 447
Moller, W. J., and Kasimatis, A. N. 1978. Dieback of grapevines caused by Eutypa armeniacae. 448
Plant Dis. Rep. 62:254–258. 449
Péros, J. P., and Berger, G. 1994. A rapid method to assess the aggressiveness of Eutypa lata 450
isolates and the susceptibility of grapevine cultivar to eutypa dieback. Agronomie 14:515–523. 451
Péros, J. P., and Berger, G. 1999. Diversity within natural progenies of the grapevine dieback 452
fungus eutypa dieback. Curr. Gen. 36:301–309. 453
Petzoldt, C. H., Moller, W. J., and Sall, M. A. 1981. Eutypa dieback of grapevines: seasonal 454
differences in infection and duration of susceptibility of pruning wounds. Phytopathology 455
71:540-543. 456
Phillips, A. J. L., Crous, P. W., and Alves, A. 2007. Diplodia seriata, the anamorph of 457
“Botryosphaeria“ obtusa. Fungal Divers. 25:141-155. 458
Pierron, R. J. G., Pages, M., Couderc, C., Compant, S., Jacques, A. and Violleau, F. 2015. In vitro 459
and in planta fungicide properties of ozonated water against the esca-associated fungus 460
Phaeoacremonium aleophilum. Sci. Hortic. 189:184-191.
461
Ramírez-Suero, M., Bénard-Gellon, M., Chong, J., Laloue, H., Stempien, E., Abou-Mansour, E., 462
Fontaine, F., Larignon, P., Mazket-Kieffer, F., Farine, S., and Bertsch, C. 2014. Extracellular 463
compounds produced by fungi associated with Botryosphaeria dieback induce differential 464
defense gene expression patterns and necrosis in Vitis vinifera cv. Chardonnay cells. 465
Protoplasma. 251:1417-1426. 466
Rego, C., Nascimento, T., Cabral, A., Silva, M. J., and Oliveira, H. 2009. Control of grapevine 467
wood fungi in commercial nurseries. Phytopathol. Mediterr. 48:128-135. 468
Plant Disease "First Look" paper • http://dx.doi.org/10.1094/PDIS-10-15-1194-RE • posted 02/10/2016
Rovesti, L., and Montermini, A. 1987. Un deprimento della vitte causato de Sphaeropsis malorum 469
in provincia di Reggio Emilia. Inf. Fitopatol. 1:59–61. 470
Savocchia, S., Steel, C. C., Stodart, B. J., and Somers, A. 2007. Pathogenicity of Botryosphaeria 471
species from declining grapevines in sub tropical of Eastern Australia. Vitis 46:27-32. 472
Sosnowski, M. R., Lardner, R., Wicks, T. J., and Scott, E.S. 2007. The influence of grapevine 473
cultivar and isolate of Eutypa lata on wood and foliar symptoms. Plant Dis. 91:924–931. 474
Spagnolo A., Magnin-Robert, M., Alayi, T. D., Cilindre, C., Mercier, L., Schaeffer-Reiss, C., Van 475
Dorsselaer, A., Clément, C., and Fontaine F. 2012. Physiological changes in green stems of Vitis 476
vinifera L. cv. Chardonnay in response to esca proper and apoplexy revealed by proteomic and
477
transcriptomic analyses. J. Proteome Res. 11:461–475. 478
Spagnolo, A., Larignon, P., Magnin-Robert, M., Hovasse, A., Cilindre, C., Van Dorsselaer, A., 479
Clément, C., Schaffer-Reiss, C. and Fontaine, F. 2014a. Flowering as the most highly sensitive 480
period of grapevine (Vitis vinifera cv. Mourvèdre) to the botryosphaeria dieback agents of 481
Neofusicoccum parvum and Diplodia seriata infection. Int. J. Mol. Sci. 15:9644-9669.
482
Spagnolo, A., Magnin-Robert, M., Alayi,T. D., Cilindre, C., Schaeffer-Reiss, C., Van Dorsselaer, 483
A., Clément, C., Larignon, P., Ramirez-Suero, M., Chong, J., Bertsch, C., Abou-Mansour, E., 484
and Fontaine, F. 2014b. Differential responses of three grapevine cultivars to Botryosphaeria 485
dieback. Phytopathology 104:1021–1035. 486
Taylor, A., Hardy, G. E. St J., Wood, P., and Burgess, T. 2005. Identification and pathogenicity of 487
Botryosphaeria species associated with grapevine decline in Western Australia. Australasian 488
Plant Pathology 34: 187–95. 489
Thipyapong, P., Stout, M. J., and Attajarusit, J. 2007. Functional analysis of polyphenol oxidases by 490
antisense/sense technology. Molecules 12:1569-1595. 491
Úrbez-Torres, J. R. and Gubler, W. D. 2019. Pathogenicity of Botryosphaeria species isolated from 492
grapevine cankers in California. Plant Dis. 93:584-92. 493
Plant Disease "First Look" paper • http://dx.doi.org/10.1094/PDIS-10-15-1194-RE • posted 02/10/2016
Úrbez-Torres, J. R., Leavitt, G. M., Guerrero, J. C., Guevara, J., and Gubler, W. D. 2008. 494
Identification and pathogenicity of Lasiodiplodia theobromae and Diplodia seriata, the causal 495
agents of bot canker disease of grapevines in Mexico. Plant Dis. 92:519-529. 496
Úrbez-Torres, J. R. 2011. The status of Botryophaeriaceae species infecting grapevines. 497
Phytopathol. Mediterr. 50:S5–S45. 498
Valtaud, C., Larignon, P., Roblin, G., and Fleurat-Lessard, P. 2009. Development and 499
ultrastructural features of Phaeomoniella chlamydospora and Phaeoacremonium aleophilum in 500
relation to xylem degradation in esca disease of the grapevine. J. Plant Pathol. 91:37-51. 501
Waters, E. R. 1995. The molecular evolution of the small heat-shock proteins in plants. Genetics 502
141:785-795. 503
504
Plant Disease "First Look" paper • http://dx.doi.org/10.1094/PDIS-10-15-1194-RE • posted 02/10/2016
Table 1. Isolates of Neofusicoccum parvum, Diplodia seriata, Phyllosticta ampelicida, Penicillium 505
sp. and Cladosporium sp. used for inoculation. 506
507
Strain Species Aggressiveness Origin
Np 19 Neofusicoccum parvum High Portugal
Np 67 Neofusicoccum parvum Low Portugal
Np AR Neofusicoccum parvum nd France
Ds 98-1 Diplodia seriata High France
Ds 99-7 Diplodia seriata Low France
Gb 17 Phyllosticta ampelicida Medium Portugal
Gb 32 Phyllosticta ampelicida High Portugal
- Penicillium sp. Not pathogenic France
- Cladosporium sp. Not pathogenic France
nd
Not determined.
508 509
Plant Disease "First Look" paper • http://dx.doi.org/10.1094/PDIS-10-15-1194-RE • posted 02/10/2016
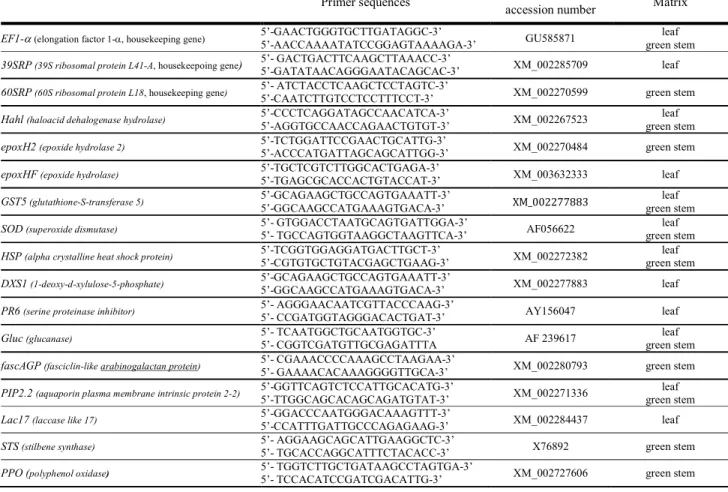
Table 2. Primers of genes analyzed by real-time reverse-transcription polymerase chain reaction. 510 511 512 513 Genes
Primer sequences Genbank or TC TIGR
accession number Matrix EF1-α (elongation factor 1-α, housekeeping gene) 5’-GAACTGGGTGCTTGATAGGC-3’
5’-AACCAAAATATCCGGAGTAAAAGA-3’ GU585871
leaf green stem
39SRP (39S ribosomal protein L41-A, housekeepoing gene) 5’- GACTGACTTCAAGCTTAAACC-3’ 5’-GATATAACAGGGAATACAGCAC-3’ XM_002285709 leaf
60SRP (60S ribosomal protein L18, housekeeping gene) 5’- ATCTACCTCAAGCTCCTAGTC-3’
5’-CAATCTTGTCCTCCTTTCCT-3’ XM_002270599 green stem
Hahl (haloacid dehalogenase hydrolase) 5’-CCCTCAGGATAGCCAACATCA-3’
5’-AGGTGCCAACCAGAACTGTGT-3’ XM_002267523
leaf green stem
epoxH2 (epoxide hydrolase 2) 5’-TCTGGATTCCGAACTGCATTG-3’
5’-ACCCATGATTAGCAGCATTGG-3’ XM_002270484 green stem
epoxHF (epoxide hydrolase) 5’-TGCTCGTCTTGGCACTGAGA-3’
5’-TGAGCGCACCACTGTACCAT-3’ XM_003632333 leaf
GST5 (glutathione-S-transferase 5) 5’-GCAGAAGCTGCCAGTGAAATT-3’
5’-GGCAAGCCATGAAAGTGACA-3’ XM_002277883
leaf green stem
SOD (superoxide dismutase) 5’- GTGGACCTAATGCAGTGATTGGA-3’
5’- TGCCAGTGGTAAGGCTAAGTTCA-3’ AF056622
leaf green stem
HSP (alpha crystalline heat shock protein) 5’-TCGGTGGAGGATGACTTGCT-3’
5’-CGTGTGCTGTACGAGCTGAAG-3’ XM_002272382
leaf green stem
DXS1 (1-deoxy-d-xylulose-5-phosphate) 5’-GCAGAAGCTGCCAGTGAAATT-3’
5’-GGCAAGCCATGAAAGTGACA-3’ XM_002277883 leaf
PR6 (serine proteinase inhibitor) 5’- AGGGAACAATCGTTACCCAAG-3’
5’- CCGATGGTAGGGACACTGAT-3’ AY156047 leaf
Gluc (glucanase) 5’- TCAATGGCTGCAATGGTGC-3’
5’- CGGTCGATGTTGCGAGATTTA AF 239617
leaf green stem
fascAGP (fasciclin-like arabinogalactan protein) 5’- CGAAACCCCAAAGCCTAAGAA-3’
5’- GAAAACACAAAGGGGTTGCA-3’ XM_002280793 green stem
PIP2.2 (aquaporin plasma membrane intrinsic protein 2-2) 5’-GGTTCAGTCTCCATTGCACATG-3’
5’-TTGGCAGCACAGCAGATGTAT-3’ XM_002271336
leaf green stem
Lac17 (laccase like 17) 5’-GGACCCAATGGGACAAAGTTT-3’
5’-CCATTTGATTGCCCAGAGAAG-3’ XM_002284437 leaf
STS (stilbene synthase) 5’- AGGAAGCAGCATTGAAGGCTC-3’
5’- TGCACCAGGCATTTCTACACC-3’ X76892 green stem
PPO (polyphenol oxidase) 5’- TGGTCTTGCTGATAAGCCTAGTGA-3’
5’- TCCACATCCGATCGACATTG-3’ XM_002727606 green stem
Plant Disease "First Look" paper • http://dx.doi.org/10.1094/PDIS-10-15-1194-RE • posted 02/10/2016
Table 3. Dimensions of lesions produced by isolates of Neofusicoccum parvum (Np) and Diplodia seriata (Ds) in green stems, three months after inoculation: width (mm), length (mm), area (mm2).
Isolates Width (mm) ± SEX Length (mm) ± SEX Area (mm2) ± SEX
2011 2012 2013 2014 2011 2012 2013 2014 2011 2012 2013 2014 Control 4.2 ± 0.5 a 5.6 ± 0.8 a 5.7 ± 0.7 a 5.5 ± 0.7 a 8.7 ± 0.5 a 5.7 ± 1.0 a 5.8 ± 0.9 a 5.4 ± 0.8 a 28.8 ± 4.2 a 25.0 ± 4.6 a 25.7 ± 5.0 a 23.4 ± 4.9 a Ds 98-1 7.1 ± 1.0 ab 9.1 ± 1.5 ab 10.0 ± 1.6 ab 9.7 ± 1.6 b 12.8 ± 2.3a 17.5 ± 5.4 b 18.3 ± 3.3 b 19.1 ± 4.9 b 71.5±17.6 a 126.3 ± 50.3 ab 143.9 ± 34.5 b 145.9 ± 48.3 b Ds 99-7 nd 12.8 ±1.1 ab 12.7 ± 1.0 b 13.1 ± 1.1 cd nd 20.4 ± 2.9 bc 19.5 ± 2.2 b 20.1 ± 2.6 b nd 205.9 ± 34.6 ab 194.3 ± 24.6 b 206.5 ± 31.2 c Np AR 9.9 ± 1.1 ab 13.8 ± 1.7 ab 13.9 ± 1.6 bc 12.7 ± 1.7 c 41.3 ± 1.9 c 37.8 ± 2.3 d 38.2 ± 2.6 d 39.7 ± 3.1 d 320.8 ± 42.4 b 410.6 ± 54.3 c 416.4 ± 59.9 d 394.9 ± 68.1 e Np 19 12.8 ± 1.5 b 14.7 ± 1.7 b 15.1 ± 1.3 c 14.1 ± 1.8 d 20.4 ± 3.5 b 24.6 ± 3.2 c 25.3 ± 2.0 c 24.9 ± 2.6 c 203.9 ± 41.3 ab 282.7 ± 48.4 bc 297.4 ± 34.2 c 274.1 ± 40.0 d Np 67 28.2 ± 3.6 c 24.6 ± 2.7 c 24.2 ± 2.5 d 23.4 ± 2.6 e 81.3 ± 5.9 d 78.8 ± 3.1 e 79.5 ± 3.2 e 83.4 ± 3.8 e 1793.9 ± 240.5 c 1523.1 ± 165.2 d 1508.3 ±160.1 e 1531.7 ± 168.3 f X
Data are means (n=30) and columns with the same letter are not significantly different according to Tukey’s test (P<0.05). All log values are back transformed to the original scale (millimetres).
nd
Not determined.
Table 4. Foliar symptoms produced in grapevines of cv. Aragonez (= Tempranillo) by isolates of Neofusicoccum parvum (Np) and Diplodia
seriata (Ds) eight months after inoculation.
Grapevines with foliar symptoms (%)x
Isolates 2011 2012 2013 2014 Control 0.0 a 0.0 a 0.0 a 0.0 a Ds 99-7 nd 33.3 b 36.7 b 30.0 ab Ds 98-1 36.7 b 50.0 bc 53.3 bc 50.0 bc Np AR 6.7 a 60.0 bc 56.7 bc 60.0 bc Np 19 63.3 bc 66.7 c 76.7 c 73.3 c Np 67 76.7 c 73.3 c 76.7 c 73.3 c
X Data are percentages (n=30) and columns with the same letter are not significantly different according to Tukey’s test (P<0.05). All values are back transformed to percentages. nd Not determined.
Table 5. Dimensions of lesions produced by isolates of Phyllosctita ampelicida (Gb), Cladosporium and Penicillium three months after inoculation in green stems: width (mm), length (mm), area (mm2).
Width ± SEX (mm) Length ± SEX (mm) Area ± SEX (mm2)
Isolates 2014 2014 2014 Control 5.5 ± 0.7 a 5.4 ± 0.8 a 23.4 ± 4.9 Cladosporium 5.1 ± 0.9 a 5.2 ± 0.8 a 20.9 ± 5.1 a Penicillium 5.5 ± 0.8 a 5.4 ± 1.0 a 23.3 ± 5.3 a Phyllosctita ampelicida (Gb17) 11.0 ± 2.2 b 16.0 ± 2.3 b 137.4 ± 33.0 b Phyllosctita ampelicida (Gb32) 11.0 ± 1.7 b 28.0 ± 2.7 c 243.6 ± 48.2 c
X Data are means (n=30) and columns with the same letter are not significantly different according to Tukey’s test(P<0.05).
All log values are back transformed to the original scale (millimetres).
Plant Disease "First Look" paper • http://dx.doi.org/10.1094/PDIS-10-15-1194-RE • posted 02/10/2016
Table 6. Stilbenic compound contents in leaves of control plants, in asymptomatic (AP) and symptomatic (SP) leaves of plants inoculated with three N. parvum (Np 19, Np 67 and Np AR) and with two D. seriata (Ds 99-7 and Ds 98-1) isolates.
nd, indicates compounds not detected. Values followed by an asterisk are significantly different to the control value (Dunn’s Multiple Comparison Test, P ≤ 0.05).
Table 7: Stilbenic compound contents in green stems of control plant, in asymptomatic (AP) and symptomatic (SP) green stems of plants inoculated with three N. parvum (Np 19, Np 67 and Np AR) and with two D. seriata (Ds 99-7 and Ds 98-1) isolates.
nd, indicates compounds not detected. Values followed by an asterisk are significantly different to the control value (Dunn’s Multiple Comparison Test, P ≤ 0.05) Stilbenes (µg g-1 FW) Control Np 19 Np 67 Np AR Ds 99-7 Ds 98-1 AP SP AP SP AP SP AP SP AP SP trans-piceid 202.0 ± 46.0 200.0 ± 5.0 253.0 ± 53.0 233.0 ± 51.0 240.0 ± 41.0 205.0 ± 19.0 265.0 ± 24.0 347.0 ± 68.0 291.0 ± 57.0 228.0 ± 75.0 201.0 ± 45.0 trans-resveratrol 3.0 ± 0.0 12.0 ± 5.0 12.0 ± 6.0 3.0 ± 2.0 11.0 ± 2.0 13.0 ± 11.0 7.0 ± 2.0 9.0 ± 2.0 30.0 ± 17.0* 4.0 ± 1.0 11.0 ± 4.0 trans-ε-viniferin 7.0 ± 1.0 7.0 ± 4.0 18.0 ± 9.0 16.0 ± 3.0 15.0 ± 1.0 7.0 ± 1.0 17.0 ± 12.0 29.0 ± 17.0 33.0 ± 11.0* 11.0 ± 2.0 17.0 ± 5.0 trans-vitisin A 5.0 ± 1.0 nd 6.0 ± 3.0 5.0 ± 2.0 7.0 ± 0.0 3.0 ± 1.0 6.0 ± 2.0 5.0 ± 1.0 6.0 ± 3.0 1.0 ± 1.0 6.0 ± 4.0 trans-vitisin B 5.0 ± 1.0 nd nd nd 3.0 ± 3.0 nd nd 2.0 ± 2.0 nd 1.0 ± 1.0 nd Stilbenes (µg g-1 FW) Control Np 19 Np 67 Np AR Ds 99-7 Ds 98-1 AP SP AP SP AP SP AP SP AP SP trans-piceid nd nd 11.0 ± 10.0 0.021 ± 0.003 nd 39.0 ± 6.0 nd nd nd 1.0 ± 1.0 26.0 ± 7.0 trans-resveratrol nd 31.0 ± 12.0 30.0 ± 5.0 51.0 ± 2.0 22.0 ± 6.0 nd 87.0 ± 19.0* nd nd 28.0 ± 10.0 67.0 ± 18.0 trans-ε-viniferin 13.0 ± 2.0 840.0 ± 386.0 907.0 ± 159.0 1615.0 ± 265.0 863.0 ± 267.0 2847.0 ± 503.0 1387.0 ± 404.0 510.0 ± 36.0 146.0 ± 24.0 785.0 ± 251.0 1188.0 ± 341.0 trans-vitisin A nd nd 12.0 ± 11.0 166.0 ± 37.0 32.0 ± 9.0 195.0 ± 61.0 nd nd nd 34.0 ± 19.0 41.0 ± 13.0 trans-vitisin B nd 120.0 ± 82.0 174.0 ± 58.0 258 ± 35.0 150.0 ± 31.0 919.0 ± 14.0 263.0 ± 6.0* 78.0 ± 21.0 nd 115.0 ± 65.0 383.0 ± 112.0
Caption for figures
Figure 1. Lesions observed in the green stems of grafted cuttings cv. Aragonez inoculated with control (A), three N. parvum (Np 19 (B), Np 67 (C) and Np AR (D)) and two D. seriata (Ds 98-1 (E) and Ds 99-7 (F)) isolates.
Figure 2. Foliar symptoms in leaves of grafted cuttings cv. Aragonez (= Tempranillo) inoculated in green stems of control (A) and with three N. parvum (Np19 (B), Np67 (C) and Np AR (D)), two D.
seriata (Ds98-1 (E), Ds99-7 (F)) isolates.
Figure 3. Relative expression of 10 selected genes in the leaves of asymptomatic (AP) and symptomatic plants (SP) inoculated with three N. parvum (Np 67, Np 19 and Np AR) and with two
D. seriata (Ds 98-1 and Ds 99-7) isolates. The colour scale represents the ratio values
corresponding to the mean of two or three independent experiments. Genes over-expressed appear in shades of red, with an expression level higher than 30 in bright red, while those repressed appear in shades of blue, with an intensity lower than 0.1 in dark blue (white: no change in gene expression compared to the control). Gene changes in relative expression were > 2x or <0.5x, respectively. Figure 4. Relative expression of 10 selected genes in the green stems of asymptomatic (AP) and symptomatic plants (SP) inoculated with three N. parvum (Np 67, Np 19 and Np AR) and with two
D. seriata (Ds 98-1 and Ds 99-7) isolates. The colour scale represents the ratio values
corresponding to the mean of two or three independent experiments. Genes over-expressed appear in shades of red, with an expression level higher than 30 in bright red, while those repressed appear in shades of blue, with an intensity lower than 0.1 in dark blue (white: no change in gene expression compared to the control). Gene changes in relative expression were > 2x or <0.5x, respectively.
Supplemental Material
Supplemental Fig. 1 shows structures of stilbenic compounds studied.
Plant Disease "First Look" paper • http://dx.doi.org/10.1094/PDIS-10-15-1194-RE • posted 02/10/2016
Figure 1.
A B C
E F
D
Plant Disease "First Look" paper • http://dx.doi.org/10.1094/PDIS-10-15-1194-RE • posted 02/10/2016
Figure 2. B F C E D A
Plant Disease "First Look" paper • http://dx.doi.org/10.1094/PDIS-10-15-1194-RE • posted 02/10/2016
Fig 3
208x114mm (150 x 150 DPI)
Plant Disease "First Look" paper • http://dx.doi.org/10.1094/PDIS-10-15-1194-RE • posted 02/10/2016
Fig 4
208x114mm (150 x 150 DPI)
Plant Disease "First Look" paper • http://dx.doi.org/10.1094/PDIS-10-15-1194-RE • posted 02/10/2016