A multivariate model for predicting segmental body composition
Simiao Tian
1,2,3*, Laurence Mioche
3, Jean-Baptiste Denis
1and Be´atrice Morio
2,31INRA, Unite´ de Recherche MIA, F-78352 Jouy-en-Josas, France
2
Unite´ de Nutrition Humaine, Clermont Universite´, Universite´ d’Auvergne, BP 10448, F-63000 Clermont-Ferrand, France
3INRA, UMR 1019, UNH, F-63000 Clermont-Ferrand, France
(Submitted 14 December 2012 – Final revision received 2 May 2013 – Accepted 2 May 2013 – First published online 11 July 2013)
Abstract
The aims of the present study were to propose a multivariate model for predicting simultaneously body, trunk and appendicular fat and lean masses from easily measured variables and to compare its predictive capacity with that of the available univariate models that predict body fat percentage (BF%). The dual-energy X-ray absorptiometry (DXA) dataset (52 % men and 48 % women) with White, Black and Hispanic ethnicities (1999 – 2004, National Health and Nutrition Examination Survey) was randomly divided into three sub-datasets: a train-ing dataset (TRD), a test dataset (TED); a validation dataset (VAD), compristrain-ing 3835, 1917 and 1917 subjects. For each sex, several multivariate prediction models were fitted from the TRD using age, weight, height and possibly waist circumference. The most accurate model was selected from the TED and then applied to the VAD and a French DXA dataset (French DB) (526 men and 529 women) to assess the prediction accuracy in comparison with that of five published univariate models, for which adjusted formulas were re-estimated using the TRD. Waist circumference was found to improve the prediction accuracy, especially in men. For BF%, the standard error of prediction (SEP) values were 3·26 (3·75) % for men and 3·47 (3·95) % for women in the VAD (French DB), as good as those of the adjusted univariate models. Moreover, the SEP values for the prediction of body and appendicular lean masses ranged from 1·39 to 2·75 kg for both the sexes. The prediction accuracy was best for age , 65 years, BMI , 30 kg/m2and the Hispanic ethnicity. The application of our multivariate model to large populations could be useful to address various public health issues.
Key words:Multivariate models: Body composition: Dual-energy X-ray absorptiometry: Predictions
The assessment of human body composition is important for evaluating health and nutritional status. Among health issues, overweight and obesity are worldwide problems. Increased fat mass, especially in the trunk location(1 – 4), has been associated with an increased risk of metabolic diseases, such as type 2 diabetes and CVD. The amount of lean body mass, especially of appendicular muscle mass, is also directly correlated with health and particularly with the mortality rate(3,4). Accurate measurements of body composition can be obtained from different methods, such as underwater weigh-ing, dilution techniques and dual-energy X-ray absorptiometry (DXA). However, their applications are not always convenient for large populations, because they require fixed equipment and they are also time consuming and expensive.
The potential uses of statistical methods for body compo-sition assessment have been highlighted(5), and several
attempts to predict body composition, particularly body fat percentage (BF%), using linear models with simple predictor
variables have been made. A summary of the body compo-sition prediction models published between 1985 and 2003 has been given by Sun & Chumlea(6). They pointed out that
(1) a general model for two sexes, different ethnicities and wide age ranges may lose its accuracy due to increased het-erogeneity; (2) cross-validation of prediction models was needed to assess their generalisability; (3) for validation studies, accuracy should be standardised for the mean of the predicted variable; (4) few prediction models were derived from datasets using DXA.
The advantages of using sex, age, ethnicity and easily acces-sible anthropometric measurements, such as body weight and height, are simplicity and cost efficiency. Their use would allow access to large datasets to describe body composition characteristics. Previous published linear models have made univariate predictions(7 – 11). Alternatively, a non-parametric
model based on Bayesian networks that uses the same predic-tor variables has been proposed(12,13). This Bayesian networks
* Corresponding author: S. Tian, email [email protected]
Abbreviations: APF, appendicular fat; APL, appendicular lean; BF, body fat; BF%, body fat percentage; BFF, body fat-free mass; BL, body lean; DXA, dual-energy X-ray absorptiometry; French DB, French dual-dual-energy X-ray absorptiometry dataset; MWC, models with waist circumference; MWoC, models without waist circumference; NHANES, National Health and Nutrition Examination Survey; RSD, relative standard deviation; SEP, standard error of prediction; TED, test dataset; TF, trunk fat; TRD, training dataset; VAD, validation dataset.
qThe Authors 2013
British
Journal
of
Nutrition
https://www.cambridge.org/core . IP address: 118.70.52.165 , on 24 Jun 2021 at 12:19:32, subject to the Cambridge Core terms of use, available at
https://www.cambridge.org/core/terms
.
approach consists in selecting a subset of individuals so that their predictor variable characteristics are similar to those of the individuals to be predicted. This model allows simul-taneous prediction of segmental compartments, but requires the availability of a reference dataset. To our knowledge, until now, no multivariate linear prediction model has been proposed for body composition assessment. The aim of the present study was, therefore, to develop sex-specific multivari-ate models for estimating some segmental compartments of metabolic importance (i.e. lean body mass, appendicular muscle mass and trunk fat (TF)) from age and easily accessible anthropometric variables. The usefulness of waist circumfer-ence was also investigated and combined with age, height and weight as predictor variables. These multivariate models, based on the reference dataset National Health and Nutrition Examination Survey (NHANES), were validated with two different populations in agreement with the prin-ciples proposed by Sun & Chumlea(6).
Subjects and methods Databases
All body composition values related to predictions were extracted from the NHANES website (http://www. cdc.gov/ nchs/about/major/nhanes/) from the 1999 – 2004 period. Subjects were characterised by predictor variables, such as sex, ethnicity, age, height, weight and waist circumference. For the present study, we selected subjects aged 20 – 85 years, with BMI values ranging from 18 to 40 kg/m2 and who belonged to one of the three considered ethnicity cat-egories: White, Black and Hispanic. This selection resulted in a sample size of 3977 men (1984 White, 720 Black and 1273 Hispanic) and 3692 women (1830 White, 697 Black and 1165 Hispanic).
The study was conducted separately on men and women; therefore, the complete NHANES dataset was split by sex. For each sex, we randomly split the corresponding NHANES dataset into three sub-datasets: a training dataset (TRD); a test dataset (TED); a validation dataset (VAD).
As the number of individuals was high, the splitting was done at random as suggested by Hastie et al.(14)and Nivre(15)in data-rich situations. The TRD was used as a reference dataset to fit the parameters of a series of possible models. The test dataset was used to estimate the prediction error of each fitted model to make model selection, and the VAD was used to perform a one-round validation calculation and to assess the prediction accuracy of the final chosen models.
An independent external dataset (French DB, French DXA dataset) was used to assess the performance of the prediction models in a different population context. The French DB was obtained from a routine examination at the Radiology Depart-ment of the Clermont-Ferrand University Hospital Centre between 1998 and 2008. It contains data on 1095 French sub-jects, 526 men and 569 women, aged between 20 and 85 years and with BMI values ranging between 18 and 40 kg/m2. However, ethnicity was not mentioned and waist circumfer-ence was not measured during the examination.
The study carried out using the NHANES dataset complies with the Declaration of Helsinki, the National Center for Health Statistics Ethics Review Board approved the protocols, and written informed consent was obtained from each participant. Moreover, the study using the French dataset was conducted according to the guidelines laid down in the Declaration of Helsinki, and all procedures involving human subjects were approved by the Clermont-Ferrand University Hospital Centre, France, and by the local ethics committee. Written informed consent was obtained from all subjects at recruitment after being informed of the nature, purpose and possible risks of the protocols.
Measurement of body composition
Whole-body and segmental body compositions were assessed using DXA (Hologic QDR 4500A fanbeam densitometer for the NHANES dataset and Hologic QDR-4500 densitometer for the French DB; http://www.gmecorp-usa.com/IM/XR/BD/ HOLLOGIC/4500/SV/Qdr4500dos.pdf). For the NHANES dataset, detailed descriptions have been published earlier(16). Briefly, whole-body DXA scans were taken at the NHANES mobile examination centre for eligible participants during the 6-year period from 1999 to 2004; the participants with certain physical conditions were excluded from the DXA examination(17). The DXA scans allow the quantification of multiple whole-body and regional components, including bone mineral content, fat and lean soft tissue. Body fat (BF) and body lean (BL) masses and TF and trunk lean masses were thus determined(18). Appendicular composition was the sum of arm and leg fat (APF, appendicular fat) and lean (APL, appendicular lean) masses(19). Body fat-free mass (BFF) was calculated as the sum of the BL mass and bone mineral content.
Statistical methods
Non-parametric approaches. First, several non-parametric approaches were evaluated to make absolute body compo-sition predictions. The term ‘non-parametric’ implies that the number and nature of the parameters are flexible and not fixed in advance(20). These non-parametric approaches followed the statistical methodology described by Mioche et al.(12). The local prediction models included weighted linear regression, support vector machine regression(21,22)
and Bayesian regression(23). For a given individual to be pre-dicted, these methods follow three steps: (1) dissimilarities are calculated between the individual to be predicted and each individual of the TRD based on the values of the predictor variables; (2) the dissimilarities are transformed into weights to give more importance to similar individuals; (3) a prediction model is developed from this weighted dataset. When weights are constrained to be 0 or 1, the method corresponds to the selection of a sub-dataset as performed by Mioche et al.(12).
Multivariate linear regression. In the present study, a mul-tivariate multiple linear regression, supposed to satisfy linear model assumptions, was also used as a possible alternative to these sophisticated prediction models. Multiple univariate linear regression is easily extended to deal with situations
British
Journal
of
Nutrition
https://www.cambridge.org/core . IP address: 118.70.52.165 , on 24 Jun 2021 at 12:19:32, subject to the Cambridge Core terms of use, available at
https://www.cambridge.org/core/terms
.
where the response consists of P. 1 different variables; this is termed ‘multivariate linear regression’(24). Estimates of the regression parameters are determined by the least squares method. The fitting model in a multivariate model for each variable will be the same as that which would result from a univariate model. However, the constraint in the multivariate model consists in using identical predictor variables for all the predicted variables. The advantage of using the multivari-ate approach is that it takes the correlation structure between the responses into account, which is useful for a number of inference tasks, e.g. to give simultaneous confidence regions for all the responses together.
Validation analysis. The selection of models from pre-viously described multivariate approaches was based on the prediction accuracy and complexity of the models. The accu-racy was measured by the standard error of prediction (SEP) and the relative standard deviation (RSD, two criteria defined below), and the complexity of the models was assessed by the number of parameters and computing time.
Waist circumference usefulness analysis. The usefulness of waist circumference for prediction was investigated. To do so, prediction accuracy was checked for some categories of BMI (18 – 25, 25 – 30 and 30 – 40 kg/m2), age (20 – 35, 35 – 50, 50 – 65 and 65 – 80 years) and ethnicity (White, Black and Hispanic). This categorical analysis was performed only on the VAD. The prediction accuracy in this categorical study was expressed by a 100-scale score. A score of 100 denotes a baseline, i.e. the average level of prediction quality for all the categories; a score less than 100 denotes a better quality than the average level; and in contrast a score greater than 100 indicates a worse quality.
Comparison with published univariate models. In the literature, univariate linear regressions have been developed to primarily predict BF% from BMI, age and, occasionally, waist circumference or ethnicity as predictor variables(7 – 11). Of the univariate models published between 2000 and 2012, five were retained with different combinations of predictor variables (Table 1). Gallagher’s(7) and Larsson’s(9) models
were derived from a DXA dataset, Jackson’s(8) model from a
densitometry dataset from four clinical centres, Levitt’s(10) model from a densitometry and water dilution dataset, and Go´mez-Ambrosi’s(11)model from an air-displacement
plethys-mography dataset. Original and adjusted formulas were applied to the VAD and French DB. The adjusted formulas were derived by re-estimating the parameters of the published models using the TRD. Their prediction accuracies were con-sidered as baseline values to evaluate those of our proposed combination of predictor variables in the multivariate models. The prediction of BF% from our multivariate model was calculated by dividing the predicted value of BF by body weight, multiplied by 100.
Assessment of the prediction accuracy. The accuracy of a prediction for a given variable was globally assessed using the SEP:
SEP ¼
ffiffiffiffiffiffiffiffiffiffiffiffiffiffiffiffiffiffiffiffiffiffiffiffiffiffiffiffiffiffiffiffiffiffiffiffiffiffiffiffiffiffiffiffiffiffiffiffiffiffiffiffiffiffiffiffiffiffiffiffiffiffiffiffiffi Pn
i¼1ðmeasuredi2predictediÞ2
n ;
s
where n is the number of subjects in the VAD or French DB. The unit of SEP is the same as the unit of the predicted vari-able (kg or %). The SEP is then detailed into bias and standard deviation: SEP2¼ bias2þ
SD2 to investigate the trade-off between model bias and variance in prediction. The RSD pro-vides another assessment of the prediction accuracy. It was calculated by dividing 100 £ SEP by the mean of the predicted variable, and it is expressed in percentage of the global mean. Finally, the coefficient of determination R2was used to assess the goodness of fit in the validation procedure.
Statistical test analyses. Population characteristics are expressed as means and standard deviations. Differences between each of the three subsets of the NHANES dataset and French DB were analysed using Student’s t tests. These t tests aimed to assess the differences between the American and French samples. Only the SEP difference was analysed by a permutation test(25). Furthermore, paired t tests and Bland – Altman plots(26)were used to determine the difference and the limits of agreement between the published univariate models and the multivariate model. A CI for the mean of the difference was also calculated under a normality assumption. Statistical calculations and analyses were performed using Table 1. Formulas of the five published prediction models for body fat percentage (BF%) for men and women*
Models
References Men Women
Gallagher et al.(7)† Original 55·49 2 43·8/BMI þ 0·087 age 76 2 1097·8/BMI þ 0·053 age Adjusted 45·65 2 708·3/BMI þ 0·104 age 58·72 2 675·2/BMI þ 0·069 age Jackson et al.(8) Original 3·76 BMI 2 0·04 BMI2
247·8 4·35 BMI 2 0·05 BMI2
246·24 Adjusted 2·29 BMI 2 0·023 BMI2220·8 3·27 BMI 2 0·042 BMI2220·55
Larsson et al.(9)‡ Original – –
Adjusted 46·8 (1 2 exp(2 0·047 (BMI 2 11·18))) 47·2 (1 2 exp(2 0·099 (BMI 2 10·95))) Levitt et al.(10) Original 48·1 2 952·38/BMI þ 0·176 age 63·2 2 948/BMI þ 0·135 age
Adjusted 45·65 2 708·3/BMI þ 0·104 age 58·72 2 675·2/BMI þ 0·069 age Go´mez-Ambrosi et al.(11) Original 244·988 þ 0·503 age þ 3·172 BMI 2 0·026 BMI2
20·02 BMI age þ 0·00 021 BMI2age
234·299 þ 0·503 age þ 3·1353 BMI 2 0·031 BMI2
20·02 BMI age þ 0·00 021 BMI2age Adjusted 226·627 þ 0·259 age þ 2·211 BMI 2 0·019 BMI2
20·008 BMI age þ 0·0001 BMI2age 216·206 2 0·011 age þ 2·53 BMI 2 0·025 BMI 2
20·009 BMI age 2 0·0002 BMI2age
* Adjusted formulas were estimated from the training dataset. † For Gallagher’s model, only the non-Asian model is reported.
‡ For Larsson’s model, the parameter values are not provided; only the statistical formula is provided, which is as follows: y ¼ a £ ð1 2 e2bðBMI2BMIoÞÞ:
British
Journal
of
Nutrition
https://www.cambridge.org/core . IP address: 118.70.52.165 , on 24 Jun 2021 at 12:19:32, subject to the Cambridge Core terms of use, available at
https://www.cambridge.org/core/terms
.
version 2.12.2 of the R software (http://cran.r-project.org/doc/ contrib/Lam-IntroductionToR_LHL.pdf)(27), a language and an
environment for statistical computing.
Results
Sample characteristics
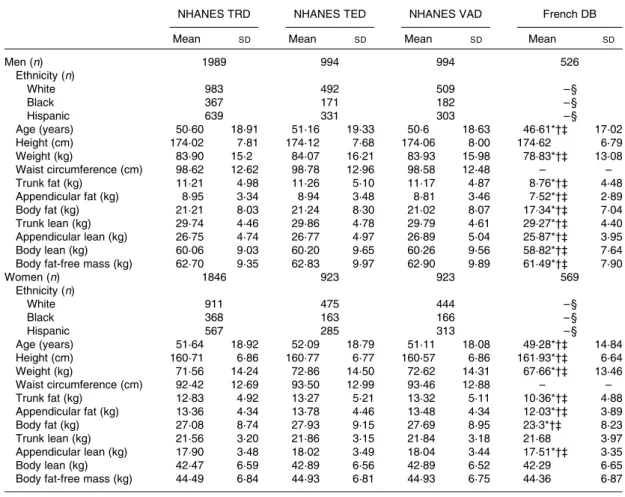
The means and standard deviations of age, anthropometric variables and DXA body composition for the different datasets are presented in Table 2 for men and women. Within the three subsets of the NHANES dataset, the men and women were of the same age, but some difference was observed for the French subjects. For men, except for height, all the variables were significantly different between the French DB and the three NHANES dataset subsets. For women, most of the variables were significantly different between the French DB and the three NHANES dataset subsets, except for trunk lean, BL and BFF.
Prediction models
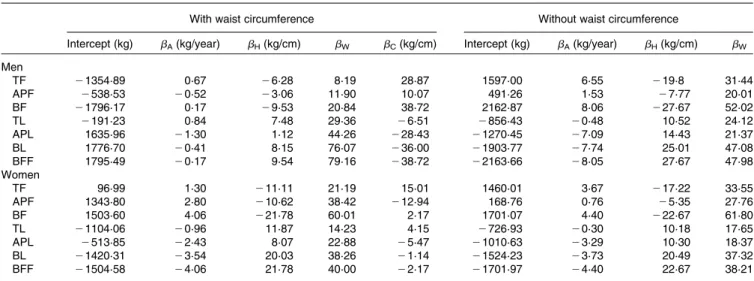
The study of the selection of models from the test dataset showed that the non-parametric approaches did not provide a significantly better SEP than the multivariate linear regression. Moreover, the non-parametric approaches need more parameters and computing times. Therefore, multivari-ate linear regression is the only model mentioned in the paper to predict segmental compartments. The parameters of this multivariate model are given in Table 3 for models with and without waist circumference (MWC and MWoC, respectively) as a predictor variable.
Inclusion of waist circumference
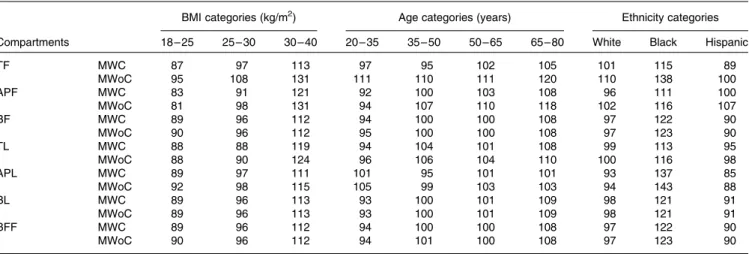
Tables 4 and 5 summarise the prediction accuracy for three categories of BMI and ethnicity and four age ranges when MWC and MWoC are applied to the VAD. Predictions were more accurate when waist circumference was included, especially for men with a BMI value that ranged from 18 to 30 kg/m2 and whose age ranged from 25 to 65 years.
Table 2. Age, anthropometric variables and dual-energy X-ray absorptiometry body composition characteristics for men and women in the National Health and Nutrition Examination Survey (NHANES) training dataset (TRD), test dataset (TED) and validation dataset (VAD) and in the French dataset (French DB)
(Mean values and standard deviations)
NHANES TRD NHANES TED NHANES VAD French DB
Mean SD Mean SD Mean SD Mean SD
Men (n) 1989 994 994 526 Ethnicity (n) White 983 492 509 – § Black 367 171 182 – § Hispanic 639 331 303 – § Age (years) 50·60 18·91 51·16 19·33 50·6 18·63 46·61*†‡ 17·02 Height (cm) 174·02 7·81 174·12 7·68 174·06 8·00 174·62 6·79 Weight (kg) 83·90 15·2 84·07 16·21 83·93 15·98 78·83*†‡ 13·08 Waist circumference (cm) 98·62 12·62 98·78 12·96 98·58 12·48 – – Trunk fat (kg) 11·21 4·98 11·26 5·10 11·17 4·87 8·76*†‡ 4·48 Appendicular fat (kg) 8·95 3·34 8·94 3·48 8·81 3·46 7·52*†‡ 2·89 Body fat (kg) 21·21 8·03 21·24 8·30 21·02 8·07 17·34*†‡ 7·04 Trunk lean (kg) 29·74 4·46 29·86 4·78 29·79 4·61 29·27*†‡ 4·40 Appendicular lean (kg) 26·75 4·74 26·77 4·97 26·89 5·04 25·87*†‡ 3·95 Body lean (kg) 60·06 9·03 60·20 9·65 60·26 9·56 58·82*†‡ 7·64
Body fat-free mass (kg) 62·70 9·35 62·83 9·97 62·90 9·89 61·49*†‡ 7·90
Women (n) 1846 923 923 569 Ethnicity (n) White 911 475 444 – § Black 368 163 166 – § Hispanic 567 285 313 – § Age (years) 51·64 18·92 52·09 18·79 51·11 18·08 49·28*†‡ 14·84 Height (cm) 160·71 6·86 160·77 6·77 160·57 6·86 161·93*†‡ 6·64 Weight (kg) 71·56 14·24 72·86 14·50 72·62 14·31 67·66*†‡ 13·46 Waist circumference (cm) 92·42 12·69 93·50 12·99 93·46 12·88 – – Trunk fat (kg) 12·83 4·92 13·27 5·21 13·32 5·11 10·36*†‡ 4·88 Appendicular fat (kg) 13·36 4·34 13·78 4·46 13·48 4·34 12·03*†‡ 3·89 Body fat (kg) 27·08 8·74 27·93 9·15 27·69 8·95 23·3*†‡ 8·23 Trunk lean (kg) 21·56 3·20 21·86 3·15 21·84 3·18 21·68 3·97 Appendicular lean (kg) 17·90 3·48 18·02 3·49 18·04 3·44 17·51*†‡ 3·35 Body lean (kg) 42·47 6·59 42·89 6·56 42·89 6·52 42·29 6·65
Body fat-free mass (kg) 44·49 6·84 44·93 6·81 44·93 6·75 44·36 6·87
* Mean values were significantly different from those of the TRD (P, 0·05; t test). † Mean values were significantly different from those of the TED (P, 0·05; t test). ‡ Mean values were significantly different from those of the VAD (P, 0·05; t test). § Ethnicity was not mentioned in the French DB.
British
Journal
of
Nutrition
https://www.cambridge.org/core . IP address: 118.70.52.165 , on 24 Jun 2021 at 12:19:32, subject to the Cambridge Core terms of use, available at
https://www.cambridge.org/core/terms
.
Regarding ethnicity categories, a remarkable improvement in accuracy was found for Black men when waist circumference was used as a predictor variable. Compared with that of MWoC, the prediction accuracy of MWC was improved by a 45 % unit (in a 100-scale score) for TF and APL masses and by a 30 % unit (in a 100-scale score) for BF, BL and BFF masses. By contrast, for women in all the BMI, age and ethnicity categories, the quality of the predictions was similar between MWC and MWoC.
For subjects of both sexes, the prediction by MWC was less reliable with BMI values in the range 30 – 40 kg/m2than for the
other BMI categories. Indeed, the prediction accuracy of MWC was reduced by 35 and 25 % units for a BMI . 30 kg/m2than for the BMI categories of 18 – 25 and 25 – 30 kg/m2.
Regarding the three ethnicity categories, MWC provided the best quality of fit for Hispanic individuals, followed by White and Black individuals. More precisely, for the BF, BL and appendicular compartments in Hispanic individuals, the prediction accuracy of MWC was improved by 20 % unit in Hispanic men than in White and Black men. Similarly, it was improved by 10 and 30 % units in Hispanic women than in White and Black women, respectively.
Table 3. Multivariate prediction model estimates of parameters for the seven segmental compartments (kg) including or not including waist circumference as a predictor variable*
With waist circumference Without waist circumference
Intercept (kg) bA(kg/year) bH(kg/cm) bW bC(kg/cm) Intercept (kg) bA(kg/year) bH(kg/cm) bW
Men TF 21354·89 0·67 26·28 8·19 28·87 1597·00 6·55 219·8 31·44 APF 2538·53 20·52 23·06 11·90 10·07 491·26 1·53 27·77 20·01 BF 21796·17 0·17 29·53 20·84 38·72 2162·87 8·06 227·67 52·02 TL 2191·23 0·84 7·48 29·36 26·51 2856·43 20·48 10·52 24·12 APL 1635·96 21·30 1·12 44·26 228·43 21270·45 27·09 14·43 21·37 BL 1776·70 20·41 8·15 76·07 236·00 21903·77 27·74 25·01 47·08 BFF 1795·49 20·17 9·54 79·16 238·72 22163·66 28·05 27·67 47·98 Women TF 96·99 1·30 211·11 21·19 15·01 1460·01 3·67 217·22 33·55 APF 1343·80 2·80 210·62 38·42 212·94 168·76 0·76 25·35 27·76 BF 1503·60 4·06 221·78 60·01 2·17 1701·07 4·40 222·67 61·80 TL 21104·06 20·96 11·87 14·23 4·15 2726·93 20·30 10·18 17·65 APL 2513·85 22·43 8·07 22·88 25·47 21010·63 23·29 10·30 18·37 BL 21420·31 23·54 20·03 38·26 21·14 21524·23 23·73 20·49 37·32 BFF 21504·58 24·06 21·78 40·00 22·17 21701·97 24·40 22·67 38·21
TF, trunk fat; APF, appendicular fat; BF, body fat; TL, trunk lean; APL, appendicular lean; BL, body lean; BFF, body fat-free mass, calculated as the sum of the BL mass and bone mineral content.
* The parameters are, respectively, associated with the intercept, age (bA), height (bH), weight (bW) and waist circumference (bC). For the sake of presentation, all values have
been multiplied by 100.
Table 4. Accuracy of the proposed prediction models with waist circumference (MWC) and without waist circumference (MWoC) as a predictor variable for the seven segmental compartments in different BMI, age and ethnicity categories for men in the National Health and Nutrition Examination Survey validation dataset*
BMI categories (kg/m2) Age categories (years) Ethnicity categories
Compartments 18 – 25 25 – 30 30 – 40 20 – 35 35 – 50 50 – 65 65 – 80 White Black Hispanic
TF MWC 90 95 116 86 97 105 113 104 102 90 MWoC 105 120 136 126 114 125 119 120 145 103 APF MWC 77 94 127 108 98 101 99 105 109 84 MWoC 81 98 129 115 100 106 98 108 117 86 BF MWC 87 94 120 99 96 102 110 104 105 88 MWoC 100 113 133 129 108 120 112 117 137 98 TL MWC 88 93 119 97 99 107 105 100 108 95 MWoC 89 95 119 100 98 108 105 102 107 95 APL MWC 84 98 118 98 99 95 111 101 125 80 MWoC 105 121 142 138 124 121 114 116 172 95 BL MWC 86 94 121 98 96 102 111 105 104 88 MWoC 98 112 134 127 108 119 112 116 134 98 BFF MWC 87 94 120 99 96 102 110 104 105 88 MWoC 100 113 134 129 109 120 112 117 137 98
TF, trunk fat; APF, appendicular fat; BF, body fat; TL, trunk lean; APL, appendicular lean; BL, body lean; BFF, body fat-free mass, calculated as the sum of the BL mass and bone mineral content.
* The accuracy is assessed by a 100-scale score: the smaller the score, the better the prediction. A value of 100 corresponds to the global standard error of prediction for all the categories with waist circumference as a predictor variable.
British
Journal
of
Nutrition
https://www.cambridge.org/core . IP address: 118.70.52.165 , on 24 Jun 2021 at 12:19:32, subject to the Cambridge Core terms of use, available at
https://www.cambridge.org/core/terms
.
Multivariate prediction models
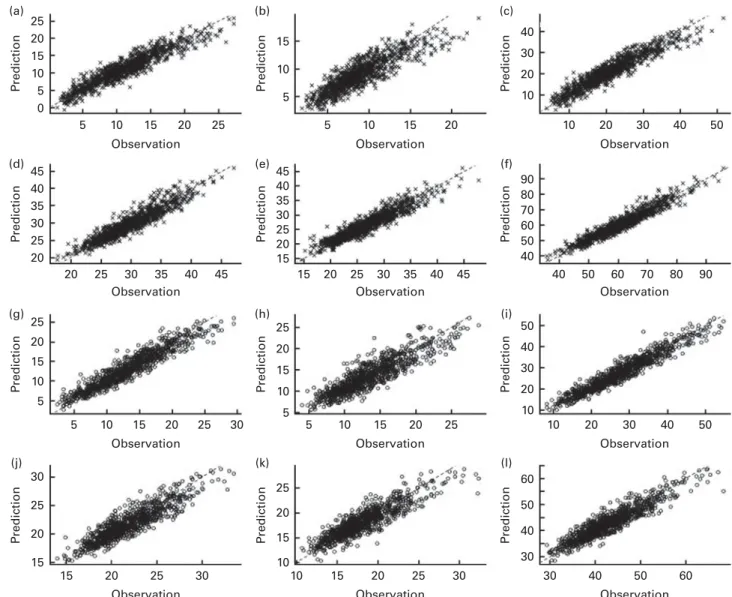
The validation scores for the multivariate model were calcu-lated using the VAD, and they are given in Table 6. For the prediction of BF and BL masses, a SEP value less than 2·8 kg was found for both men and women (men: 2·75 and 2·66 kg; women: 2·52 and 2·47 kg, respectively). By contrast, because of the differences in the compartment masses, the RSD values were much lower for the BL prediction than for the BF prediction (men: 4·41 and 13·08 %; women: 5·76 and 9·01 %, respectively). The corresponding R2 values averaged 0·9 for both the sexes (men: 0·88 and 0·92; women: 0·92 and 0·86, respectively).
Regarding other segmental compartments such as trunk and APF and APL masses and BFF, the SEP values ranged from 1·65 to 2·75 kg for men and from 1·39 to 2·52 kg for women. Simi-larly, in both the sexes, because of the differences in the com-partment sizes, the RSD values were lower for trunk and APL masses than for the corresponding fat masses. They varied from 5·54 to 8·76 % for trunk and APL masses and from
12·54 to 19·18 % for trunk and APF masses. The corresponding R2values ranged from 0·8 to 0·9 for both the sexes.
The bias ranged approximately from 0·50 to 0·90 kg for both men and women, which were low in comparison with the model variance (Table 6). Comparisons of the predictions by models and the observations are shown in Fig. 1 for men and women. For men, segmental body compositions were globally well predicted, even if for extreme parts, some bias appeared: an underestimation for a high fat mass and an over-estimation for low lean mass. For women, an underover-estimation for high APF and APL masses was observed.
When the multivariate prediction model without waist cir-cumference was applied to the French DB, the predictions were still good (table not shown). For men, the SEP values were 2·95 kg (R2 0·84) for BF mass and 2·84 kg (R20·87) for BL mass, with the RSD values being equal to 17·01 and 4·83 %, respectively. For women, the corresponding SEP values were 2·86 kg (R20·89) and 2·80 kg (R20·84) with the respective RSD values of 12·27 and 6·62 %.
Table 5. Accuracy of the proposed prediction models with waist circumference (MWC) and without waist circumference (MWoC) as a predictor variable for the seven segmental compartments in different BMI, age and ethnicity categories for women in the National Health and Nutrition Examination Survey validation dataset*
BMI categories (kg/m2) Age categories (years) Ethnicity categories Compartments 18 – 25 25 – 30 30 – 40 20 – 35 35 – 50 50 – 65 65 – 80 White Black Hispanic
TF MWC 87 97 113 97 95 102 105 101 115 89 MWoC 95 108 131 111 110 111 120 110 138 100 APF MWC 83 91 121 92 100 103 108 96 111 100 MWoC 81 98 131 94 107 110 118 102 116 107 BF MWC 89 96 112 94 100 100 108 97 122 90 MWoC 90 96 112 95 100 100 108 97 123 90 TL MWC 88 88 119 94 104 101 108 99 113 95 MWoC 88 90 124 96 106 104 110 100 116 98 APL MWC 89 97 111 101 95 101 101 93 137 85 MWoC 92 98 115 105 99 103 103 94 143 88 BL MWC 89 96 113 93 100 101 109 98 121 91 MWoC 89 96 113 93 100 101 109 98 121 91 BFF MWC 89 96 112 94 100 100 108 97 122 90 MWoC 90 96 112 94 101 100 108 97 123 90
TF, trunk fat; APF, appendicular fat; BF, body fat; TL, trunk lean; APL, appendicular lean; BL, body lean; BFF, body fat-free mass, calculated as the sum of the BL mass and bone mineral content.
* The accuracy is assessed by a 100-scale score: the smaller the score, the better the prediction. A value of 100 corresponds to the global standard error of prediction for all the categories with waist circumference as a predictor variable.
Table 6. Accuracy of the multivariate prediction model calculated using the National Health and Nutrition Examination Survey validation dataset using waist circumference for the seven segmental compartments*
Men Women
Compartments SEP (kg) Bias (kg) SD(kg) RSD (%) R2 SEP (kg) Bias (kg)
SD(kg) RSD (%) R2 TF 1·73 0·50 1·65 15·49 0·87 1·67 0·71 1·51 12·54 0·90 APF 1·69 0·90 1·43 19·18 0·76 1·99 0·85 1·80 14·76 0·79 BF 2·75 0·92 2·59 13·08 0·88 2·52 0·83 2·38 9·10 0·92 TL 1·65 0·52 1·56 5·54 0·87 1·39 0·61 1·25 6·36 0·81 APL 1·76 0·62 1·65 6·55 0·88 1·58 0·70 1·41 8·76 0·79 BL 2·66 0·70 2·56 4·41 0·92 2·47 0·90 2·30 5·76 0·86 BFF 2·75 0·73 2·65 4·37 0·92 2·52 0·90 2·36 5·61 0·86
SEP, standard error of prediction; RSD, relative standard deviation; TF, trunk fat; APF, appendicular fat; BF, body fat; TL, trunk lean; APL, appendicular lean; BL, body lean; BFF, body fat-free mass, calculated as the sum of the BL mass and bone mineral content.
* The absolute value of the total weight of the segmental compartments is predicted. The accuracy is assessed by the SEP in kg and the RSD in %. RSD ¼ 100 £ (SEP/y ) for a predicted variable Y and its mean y , and it is expressed as a percentage. For example, for BF of men, RSD ¼ 100 £ 2·75/21·02 ¼ 13·08 %.
British
Journal
of
Nutrition
https://www.cambridge.org/core . IP address: 118.70.52.165 , on 24 Jun 2021 at 12:19:32, subject to the Cambridge Core terms of use, available at
https://www.cambridge.org/core/terms
.
Comparison with published prediction models
When the published formulas with their predictor variables were re-adjusted in the TRD and then applied to the VAD and French DB, the quality of fit was improved in comparison with that of their original formulas. For the BF% of men, the prediction accuracy of the adjusted formula was increased in the VAD by 0·5 % unit for Gallagher’s and Jackson’s prediction models and by 1 % unit for Levitt’s and Go´mez-Ambrosi’s prediction models. For the BF% of women, the prediction accuracy was improved, on average, by 1 % unit for all the models (Table 7). For the same compartment in French men and women, only a slight improvement in accuracy was found for the univariate models, except for Go´mez-Ambrosi’s prediction model, for which the prediction accuracy was improved by 1·5 % unit.
The accuracy of our multivariate prediction model, based on age, height, weight and waist circumference, was com-pared with that of the five adjusted published prediction
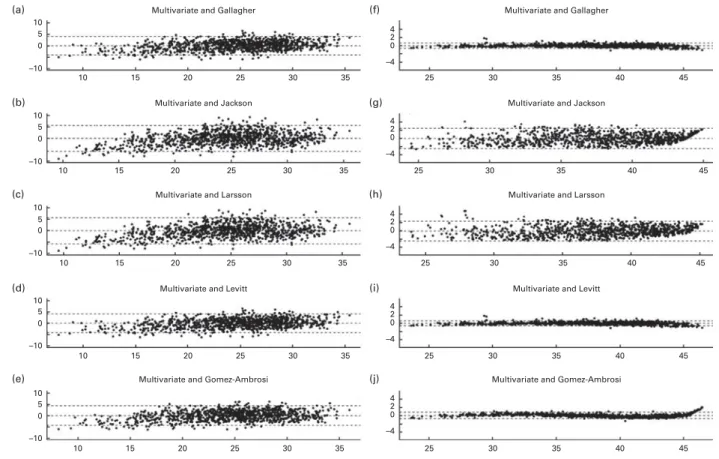
models. In the VAD, the multivariate prediction of BF% yielded one of the best accuracies, with SEP values of 3·26 and 3·74 %, respectively, for men and women. For men, our SEP values were 0·5 % unit better than those of Gallagher’s, Levitt’s and Go´mez-Ambrosi’s prediction models and 1 % unit better than those of Jackson’s and Larsson’s prediction models. By contrast, for women, the differences between SEP values of the various models were small (Table 7). The Bland – Altman plots are shown in Fig. 2 for men and women in the VAD. It appeared that the agreement between our model and the adjusted published models was better for women than for men. In addition, for all the paired t tests, P values ranged from 0·51 to 0·95 and 0·18 to 0·89 for men and women, respectively. Therefore, the difference in predic-tions was not statistically significant. With respect to the CI of the mean of the difference, it ranged from 2 0·17 to 0·19 for men and 2 0·03 to 0·13 for women. These results show that there is no systematic difference between our multivariate 25 (a) (b) (c) (d) (e) (f) (g) (h) (i) (j) (k) (l) 25 20 20 15 15 10 10 P rediction 5 5 25 30 20 15 25 30 20 15 10 25 30 20 15 10 5 5 10 15 20 25 20 15
Observation Observation Observation
Observation Observation Observation
Observation Observation Observation
Observation Observation Observation
10 5 0 15 40 40 50 30 30 20 20 10 10 90 90 80 80 70 70 60 60 50 50 40 40 50 40 30 60 50 40 30 20 10 50 40 30 60 50 40 30 20 10 10 P rediction P rediction P rediction P rediction P rediction P rediction 5 25 20 15 10 P rediction P rediction P rediction 5 25 20 15 25 20 35 30 45 40 15 25 20 30 35 40 45 15 25 20 30 35 40 45 25 20 35 30 45 40 25 30 20 15 10 P rediction 5 25 20 15 10 P rediction
Fig. 1. Scatter plot of the multivariate model for the prediction of different segmental body compositions against their observations in the validation dataset. Men are represented by and women by . The first bisectors are drawn ( ). Men: (a) trunk fat (TF); (b) appendicular fat (APF); (c) body fat (BF); (d) trunk lean (TL); (e) appendicular lean (APL); (f) body lean (BL). Women: (g) TF; (h) APF; (i) BF; (j) TL; (k) APL; (l) BL.
British
Journal
of
Nutrition
https://www.cambridge.org/core . IP address: 118.70.52.165 , on 24 Jun 2021 at 12:19:32, subject to the Cambridge Core terms of use, available at
https://www.cambridge.org/core/terms
.
prediction model and each of the adjusted published predic-tion models.
In the French DB, the prediction of BF% was based on age, height and weight. The SEP values of our multivariate prediction model were 3·74 and 3·95 %. They were slightly higher than those of Go´mez-Ambrosi’s prediction model (3·63 %) in men and than those of Gallagher’s and Levitt’s prediction models (3·93 %) in women.
Discussion
BF, TF and other segmental compartments, such as appendicular muscle mass, are useful factors for assessing pre-disposition to metabolic risks; therefore, examinations of these segmental compartments provide interesting information. The proposed multivariate model aimed at simultaneously predicting them from age and easily measured anthropometric predictor variables, with a particular focus on the importance of waist circumference. It was built using a US dataset and validated independently using two different datasets. The present results showed that, with the proposed combination of four predictor variables, including waist circumference, the multivariate model enabled accurate predictions for segmental body compositions.
Waist circumference is a well-known predictor of abdominal accumulation of subcutaneous and visceral adipose tissues. In 2001, the National Cholesterol Education Program – Adult Treatment Panel III included waist circumference as a risk
factor for the metabolic syndrome(1). Waist circumference was then widely used to improve the prediction of BF% in combination with a weight-for-height index, such as BMI(28,29). In the study by Lean et al.(30), BF%, which was assessed by densitometry, was more closely related to waist circumference than to BMI, particularly for men. In another study related to BFF, Bosty-Westphal et al.(31) found that waist circumference was a risk factor for decreased BFF and that it was a good anthropometric index for health risk assessment. Similarly in the present study, the accuracy of our multivariate model was improved when waist circumfer-ence was entered as a predictor variable. This was particularly meaningful for men for the segmental compartments, such as TF, APL, total BF and total BL masses. For men, a significant improvement in accuracy was observed in all the BMI categories and in the age categories of 20 – 35, 35 – 50 and 50 – 65 years. In addition, waist circumference was especially required to improve the prediction accuracy for Black men in comparison with the other two ethnicity categories. We thus concluded that waist circumference should be included in the multivariate prediction model for normal, overweight and obese subjects, although it is known in clinical practice that there is a physical difficulty in measuring waist circumfer-ence of the latter subjects.
One important aspect of our proposed model is that it is capable of predicting simultaneously several segmental compartments; to our knowledge, this is the first proposal made for a multivariate model. The joint use of several Table 7. Accuracy of the five published models, original and adjusted, and our proposed model for body fat percentage prediction calcu-lated using the National Health and Nutrition Examination Survey (NHANES) validation dataset (VAD) and the French dataset (French DB)*
Original Adjusted
Datasets Sex Models SEP (%) RSD (%) R2 SEP (%) RSD (%) R2
NHANES VAD Men Gallagher et al.(7) 4·05 16·61 0·59 3·77 15·45 0·61
Jackson et al.(8) 4·89 20·05 0·51 4·23 17·33 0·51
Larsson et al.(9) – ‡ – ‡ – ‡ 4·23 17·33 0·51
Levitt et al.(10) 5·11 20·94 0·60 3·77 15·45 0·61
Go´mez-Ambrosi et al.(11) 5·52 22·62 0·61 3·75 15·37 0·61
Multivariate prediction – – – 3·26 13·26 0·71
Women Gallagher et al.(7) 4·46 11·95 0·67 3·47 9·29 0·68
Jackson et al.(8) 5·09 13·62 0·62 3·77 10·10 0·63
Larsson et al.(9) – ‡ – ‡ – ‡ 3·75 10·04 0·63
Levitt et al.(10) 4·48 11·99 0·68 3·47 9·29 0·68
Go´mez-Ambrosi et al.(11) 4·90 13·13 0·67 3·75 10·40 0·63
Multivariate prediction – – – 3·47 9·29 0·68
French DB Men Gallagher et al.(7) 3·95 18·45 0·62 3·76 17·56 0·61
Jackson et al.(8) 4·23 19·74 0·58 3·97† 18·54 0·58
Larsson et al.(9) – ‡ – ‡ – ‡ 3·97† 18·54 0·58
Levitt et al.(10) 5·23 24·42 0·60 3·76 17·56 0·61
Go´mez-Ambrosi et al.(11) 5·39 25·17 0·64 3·63 16·95 0·63
Multivariate prediction – – – 3·74 17·47 0·62
Women Gallagher et al.(7) 4·43 13·18 0·66 3·93 11·68 0·67
Jackson et al.(8) 5·02 14·91 0·63 4·12 12·25 0·64
Larsson et al.(9) – ‡ – ‡ – ‡ 4·10 12·19 0·64
Levitt et al.(10) 4·28 12·73 0·67 3·93 11·68 0·67
Go´mez-Ambrosi et al.(11) 5·37 15·97 0·66 3·93 11·68 0·67
Multivariate prediction – – – 3·95 11·74 0·67
SEP, standard error of prediction; RSD, relative standard deviation.
* The accuracy is assessed by the SEP and RSD, and both are expressed in percentage. The R2is also calculated.
† There is a significant difference in SEP values between the adjusted univariate prediction models and the multivariate prediction model with the permutation test (P , 0·05).
‡ The original parameter coefficients are not available.
British
Journal
of
Nutrition
https://www.cambridge.org/core . IP address: 118.70.52.165 , on 24 Jun 2021 at 12:19:32, subject to the Cambridge Core terms of use, available at
https://www.cambridge.org/core/terms
.
segmental body compositions has been justified in some meta-bolic disease risk studies. Indeed, an excess amount of TF is associated with a higher cardiometabolic risk, but in addition, after TF mass is controlled, a higher APF mass can be shown to be associated with a more favourable metabolic profile, par-ticularly in women(32,33). In a study on subjects aged 60 – 80 years, Saunders et al.(34) found that the absolute amount of TF and APF masses influenced the metabolic risk in elder men and women. Moreover, based on a study using DXA, BF was shown to be a complementary significant contributor to BMR in addition to BFF(35). Some longitudinal studies in cohorts of older subjects(36,37) have highlighted that the loss of APL mass, measured using DXA, was associated with a greater risk of all-cause mortality compared with individuals with stable APL mass. Furthermore, Kilgour et al.(38) found that in advanced cancer patients, an APL mass-for-height index, measured by DXA, had a significant impact on cancer-related fatigue in men. Therefore, in order to better assess the health status or the metabolic risks of individuals, it is beneficial to predict simultaneously several segmental compartments from the statistical models. In the present study, the results for different populations underline that our proposed model enables the accurate assessment of several segmental compartments for the three ethnicities studied. The reliable prediction for body, trunk and appendicular
components may be used for further studies related to patho-physiological and metabolic issues.
Of the already published models, five were retained for evaluating the usefulness of the proposed combination of four predictor variables in the multivariate model. These published models mainly integrated BMI and age as predictor variables; some were derived from either densitometry-based or air-displacement plethysmography-based datasets. Original and adjusted formulas, derived from the TRD, were applied to the VAD and their prediction accuracies were used as baseline values for comparison. The results show that the prediction of BF% of predictor variables used in our multivariate model yields a competing accuracy in comparison with the five adjusted published models. This finding justifies the relevance of using age, height, weight and waist circumference for pre-dicting body composition.
Measurements of body composition can be obtained using a variety of methods, each of which provides a different amount of information about body compartments. Each method has specific limitations and measurement errors(39,40). DXA and
the four-compartment models are usually designated as refer-ence methods for assessing body composition(41 – 43). For BF%, the precision is approximately 3 % for DXA and even lower than 3 % for the four-compartment models(42). If we take into account these measurement errors combined with the prediction accuracy of our model, we can calculate the
10 10 15 20 25 30 35 5 0 –10 10 5 0 –10 10 5 0 –10 10 5 0 –10 10 5 0 –10 25 30
Multivariate and Gallagher Multivariate and Gallagher
(a) (f)
(b) (g)
(c) (h)
(d) (i)
(e) (j)
Multivariate and Jackson Multivariate and Jackson
Multivariate and Larsson Multivariate and Larsson
Multivariate and Levitt Multivariate and Levitt
Multivariate and Gomez-Ambrosi Multivariate and Gomez-Ambrosi
35 40 45 10 15 20 25 30 35 25 30 35 40 45 10 15 20 25 30 35 25 30 35 40 45 10 15 20 25 30 35 25 30 35 40 45 10 15 20 25 30 35 4 2 0 –4 4 2 0 –4 4 2 0 –4 4 2 0 –4 4 2 0 –4 25 30 35 40 45
Fig. 2. Bland – Altman plots for the difference between body fat percentage (BF%) prediction by the multivariate model and that by the five adjusted published models v. average BF% prediction by the two models. The three dashed lines represent the mean difference and the mean and 1·96SD. (a – e) Men and (f – j) women.
British
Journal
of
Nutrition
https://www.cambridge.org/core . IP address: 118.70.52.165 , on 24 Jun 2021 at 12:19:32, subject to the Cambridge Core terms of use, available at
https://www.cambridge.org/core/terms
.
model precision using the following formula:
ffiffiffiffiffiffiffiffiffiffiffiffiffiffiffiffiffiffiffiffiffiffiffiffiffiffiffiffiffiffiffiffiffiffiffiffiffiffiffiffiffiffiffiffiffiffiffiffiffiffiffiffiffiffiffiffiffiffiffiffiffiffiffiffiffiffiffiffiffiffiffiffiffiffiffiffiffiffiffiffiffiffiffiffiffiffiffiffiffiffiffiffiffiffiffiffiffiffiffiffiffiffiffiffiffiffiffiffiffiffiffiffiffiffiffiffiffiffi DXA precision ð%Þ2þ model prediction accuracy ð%Þ2:
q
In our model, the SEP values for BF% were 3·2 % for men in the VAD and less than 4 % for women in the VAD and French DB. Our model thus yields an interesting precision of 4·4 and 4·8 % for men and women in the VAD and 5·0 % in the French DB. Interestingly, Lohman(44)developed standards for evaluat-ing prediction errors (SEP) for BF%. He proposed that an ideal prediction would be denoted by a SEP value less than 2 %, a good prediction by a SEP value ranging from 3·5 to 4 % and a poor prediction by a SEP value greater than 5 %. According to these standards, our multivariate model with the four pre-dictor variables yielded a good prediction error. Indeed, the SEP values for BF% were equal to 3·26 and 3·74 % in men and women, respectively. Even if our prediction model was shown to be good, it cannot replace a direct measurement such as DXA. Nevertheless, due to its easy application and cost efficiency, it appears to be a convenient tool to evaluate the need of DXA prescription. Besides this, the multivariate model enables to suggest a pathophysiological situation or detect a dangerous evolution in case of follow-up. Moreover, such applications could be of interest to educate patients with chronic metabolic diseases. Finally, from a research perspec-tive, such a model could be highly relevant in predicting specific risks in large populations.
The present study was limited in some aspects. First, while working with the NHANES dataset, ethnic groups were limited to White, Black and Hispanic subjects for whom accurate pre-dictions were provided. Furthermore, only subjects aged from 20 to 85 years with BMI values ranging from 18 to 40 kg/m2 were examined. Subjects with a BMI . 40 kg/m2 were excluded because they are morbidly obese. Already for a BMI . 30 kg/m2, the accuracy of our model was lower than that for the other two BMI categories. Moreover, waist circum-ference has little incremental predictive power of disease risk for subjects with a BMI . 35 kg/m2 (45). Thus, a particular study should be conducted to predict body composition of morbidly obese individuals. Finally, since data on waist circumference were not available in the French DB, the prediction of body composition for this database only used the three other predictor variables, with the result being a lower accuracy compared with that of the VAD. This result strengthens the conclusions regarding the importance of including waist circumference as a predictor variable.
In summary, waist circumference is an important predictor variable for the prediction of segmental body composition, especially in men. When using age, height, weight and waist circumference, our multivariate model yields a competing accuracy compared with other published univariate models for the prediction of BF%. Compared with these published formulas, the originality and advantage of the proposed model consist in predicting simultaneously several segmental compartments (such as TF mass or APL mass) with a good accuracy; the multivariate outcomes might then be used in studies necessitating the assessment of metabolic risk factors in large populations.
Acknowledgements
We thank the Human Nutrition Department and Applied Math-ematics and Informatics unit of the French National Institute for Agricultural Research for a fellowship that permitted us to conduct the study. The authors are grateful to Dr Ristori from the Radiology Department of the Clermont-Ferrand University Hospital for providing DXA data from the Cler-mont-Ferrand University Hospital dataset. The authors’ responsibilities were as follows: S. T. was responsible for model computations, statistical analysis and the first draft of the manuscript; L. M. was responsible for data acquisition, design of the study and physiological interpretation; J.-B. D. was responsible for the design of the study, model compu-tations and statistical analysis; B. M. was responsible for the design of the study and physiological interpretation. All authors read and agreed with the contents of the manuscript. None of the authors has any conflict of interest concerning the manuscript.
References
1. Carr DB, Utzschneider KM, Hull RL, et al. (2004) Intra-abdominal fat is a major determinant of the National Cholesterol Education Program Adult Treatment Panel III criteria for the metabolic syndrome. Diabetes 53, 2087 – 2094. 2. Vega GL, Adams-Huet B, Peshock R, et al. (2006) Influence of body fat content and distribution on variation in metabolic risk. J Clin Endocrinol Metab 91, 4459 – 4466.
3. Greenlund LJ & Nair KS (2003) Sarcopenia – consequences, mechanisms, and potential therapies. Mech Ageing Dev 124, 287 – 299.
4. Vandervoot AA & Symons TB (2001) Functional and meta-bolic consequences of sarcopenia. Can J Appl Physiol 26, 90 – 101.
5. Snijder MM, Van Dam RM, Visser M, et al. (2006) What aspects of body fat are particularly hazardous and how do we measure them? Int J Epidemiol 35, 83 – 92.
6. Sun SS & Chumlea WC (2005) Statistical methods. In Human Body Composition, 2nd ed., pp. 151 – 160 [SB Heymsfield, TG Lohman and Z Wang, et al., editors]. Champaign, IL: Human Kinetics.
7. Gallagher D, Heymsfield SB, Heo M, et al. (2000) Healthy percentage body fat ranges: an approach for developing guidelines based on body mass index. Am J Clin Nutr 72, 694 – 701.
8. Jackson AS, Stanforth PR, Gagnon J, et al. (2002) The effect of sex, age and race on estimating percentage body fat from body mass index: The Heritage Family Study. Int J Obes 26, 789 – 796.
9. Larsson I, Henning B, Lindroos AK, et al. (2006) Optimized predictions of absolute and relative amounts of body fat from weight, height, other anthropometric predictors, and age. Am J Clin Nutr 83, 252 – 259.
10. Levitt DG, Heymsfield SB, Pierson RN Jr, et al. (2007) Phys-iological models of body composition and human obesity. Nutr Metab (Lond) 4, 19 – 32.
11. Go´mez-Ambrosi J, Silva C, Catala´n V, et al. (2012) Clinical usefulness of a new equation for estimating body fat. Diabetes Care 35, 383 – 388.
12. Mioche L, Bidot C & Denis JB (2011) Body composition predicted with a Bayesian network from simple variables. Br J Nutr 105, 1265 – 1271.
British
Journal
of
Nutrition
https://www.cambridge.org/core . IP address: 118.70.52.165 , on 24 Jun 2021 at 12:19:32, subject to the Cambridge Core terms of use, available at
https://www.cambridge.org/core/terms
.
13. Mioche L, Brigand A, Bidot C, et al. (2011) Fat-free mass predictions through a Bayesian network enable body com-position comparisons in various populations. J Nutr 1411, 573 – 580.
14. Hastie T, Tibshirani R and Friedman J (2009) The Elements of Statistical Learning: Data Mining, Inference, and Predic-tion, 2nd ed. New York: Springer.
15. Nivre J (2006) Inductive Dependency Parsing. Dordrecht: Springer.
16. Centers for Disease Control and Prevention (2000) National Health and Nutrition Examination Survey: body composition procedures manual. http://www.cdc.gov/nchs/data/nhanes/ BC.pdf (accessed 27 September 2008).
17. Centers for Disease Control and Prevention (2008) The 1999 – 2004 dual energy X-ray absorptiometry (DXA) mul-tiple imputation data files and technical documentation. http://www.cdc.gov/nchs/about/major/nhanes/dxx/dxa.html (accessed January 2008).
18. Mazess RB, Barden HS, Bisek JP, et al. (1990) Dual-energy X-ray absorptiometry for total body and regional bone min-eral and soft tissue composition. Am J Clin Nutr 51, 1106 – 1112.
19. Wang ZM, Visser M, Ma R, et al. (1996) Skeletal muscle mass: evaluation of neutron activation and dual-energy X-ray absorptiometry methods. J Appl Physiol 80, 824 – 831. 20. Sprent P & Smeeton NC (2001) Applied Nonparametric
Statistical Methods, 3rd ed. Boca Raton, FL: Chapman, Hall/CRC.
21. Vapnik VN (1998) Statistical Learning Theory. New York, NY: Wiley.
22. Lin CF & Wang SD (2002) Fuzzy support vector machines. IEEE Trans Neural Net 13, 464 – 471.
23. Gelman A, Carlin JB, Stern HS, et al. (2003) Bayesian Data Analysis, 2nd ed. Boca Raton, FL: Chaplan & Hall/CRC. 24. Anderson TW (1951) Estimating linear restrictions on
regression coefficients for multivariate normal distributions. Ann Math Statist 22, 327 – 351.
25. Ro¨hmel J (1996) Precision intervals for estimates of the difference in success rates for binary random variables based on the permutation principle. Biometrical J 38, 977 – 993.
26. Bland JM & Altman DG (1996) Statistical method for asses-sing agreement between two methods of clinical measure-ment. Lancet i, 307 – 310.
27. R Development Core Team (2006) R: A Language and Environment for Statistical Computing. Vienna: R Foun-dation for Statistical Computing. http://www.R-project.org (accessed January 2011).
28. Jassen I, Heymsfield SB, Allison DB, et al. (2002) Body mass index and waist circumference independently contribute to prediction of nonabdominal, abdominal subcutaneous, and visceral fat. Am J Clin Nutr 75, 683 – 688.
29. Aeberli I, Gut-Knabenhans M, Kusche-Ammann RS, et al. (2012) A composite score combining waist circumference and body mass index more accurately predicts body fat percentage in 6- to 13-year-old children. Eur J Nutr 52, 247 – 253.
30. Lean ME, Han TS & Deurenberg P (1996) Predicting body composition by densitometry from simple anthropometric measurements. Am J Clin Nutr 63, 4 – 14.
31. Bosty-Westphal A, Danielzik S, Geisler C, et al. (2006) Use of height3:waist circumference3as an index for metabolic risk assessment. Br J Nutr 95, 1212 – 1220.
32. Snijder MB, Dekker JM, Visser M, et al. (2004) Trunk fat and leg fat have independent and opposite association with fast-ing and postload glucose levels: the Hoorn study. Diabetes Care 27, 372 – 377.
33. Van Pelt RE, Evans EM, Schechtman KB, et al. (2002) Contribution of total and regional fat mass to risk for cardio-vascular disease in older women. J Physiol Endocrinol Metab 282, 1023 – 1028.
34. Saunders TJ, Davidson LE, Janiszewski PM, et al. (2009) Association of the limb fat to trunk fat ratio with makers of cardiometabolic risk in elderly men and women. J Gerontol A Biol Sci Med Sci 64, 1066 – 1070.
35. Johnstone AM, Murison SD, Duncan JS, et al. (2005) Factors influencing variation in basal metabolic rate include fat-free mass, fat mass, age, and circulating thyroxine but not sex, circulating leptin, or triiodothyronine. Am J Clin Nutr 82, 941 – 948.
36. Szulc P, Munoz F, Marchand F, et al. (2010) Rapid loss of appendicular skeletal muscle mass is associated with higher all-cause mortality in older men: the prospective MINOS study. Am J Clin Nutr 91, 1227 – 1236.
37. Lee CG, Boyko EJ, Nielson CM, et al. (2011) Mortality risk in older men associated with changes in weight, lean mass, and fat mass. J Am Geriatr Soc 2, 233 – 240.
38. Kilgour RD, Vigano A, Trutschnigg B, et al. (2010) Cancer-related fatigue: the impact of skeletal muscle mass and strength in patients with advanced cancer. J Cachexia Sarco-penia Muscle 1, 177 – 185.
39. Ellis KJ (2000) Human body composition: in vivo methods. Physiol Rev 80, 649 – 680.
40. Lee SY & Gallagher D (2008) Assessment methods in human body composition. Curr Opin Clin Nutr Metab Care 11, 566 – 572.
41. Wellens R, Chumlea WC, Guo S, et al. (1994) Body compo-sition in white adults by dual-energy X-ray absorptiometry, densitometry, and total body water. Am J Clin Nutr 59, 547 – 555.
42. Plank LD (2005) Dual-energy X-ray absorptiometry and body composition. Curr Opin Clin Nutr Metab Care 8, 305 – 309. 43. Lohman TG & Chen Z (2005) Dual-energy X-ray
absorptio-metry. In Human Body Composition, 2nd ed., pp. 63 – 78 [SB Heymsfield, TG Lohman and Z Wang, et al., editors]. Champaign, IL: Human Kinetics.
44. Lohman TG (1992) Advances in Body Composition Assessment. Current Issues in Exercise Science Series (Monograph 3). Champaign, IL: Human Kinetics.
45. National Institutes of Health (2000) The Practical Guide: Identification, Evaluation, and Treatment of Overweight and Obesity in Adults. Bethesda, MD: National Institutes of Health.
British
Journal
of
Nutrition
https://www.cambridge.org/core . IP address: 118.70.52.165 , on 24 Jun 2021 at 12:19:32, subject to the Cambridge Core terms of use, available at
https://www.cambridge.org/core/terms
.