arXiv:1203.5015v2 [hep-ex] 20 Jun 2012
CERN-PH-EP-2012-062
Submitted to: Eur. Phys. J. C
Measurement of
t¯
t
production with a veto on additional central
jet activity in
pp
collisions at
√s = 7
TeV using the ATLAS
detector
The ATLAS Collaboration
Abstract
A measurement of the jet activity in
t¯
t
events produced in proton-proton collisions at a
centre-of-mass energy of
7
TeV is presented, using
2.05
fb
−1of integrated luminosity collected by the ATLAS
detector at the Large Hadron Collider. The
t¯
t
events are selected in the dilepton decay channel with
two identified
b
-jets from the top quark decays. Events are vetoed if they contain an additional jet
with transverse momentum above a threshold in a central rapidity interval. The fraction of events
surviving the jet veto is presented as a function of this threshold for four different central rapidity
interval definitions. An alternate measurement is also performed, in which events are vetoed if the
scalar transverse momentum sum of the additional jets in each rapidity interval is above a threshold.
In both measurements, the data are corrected for detector effects and compared to the theoretical
models implemented in
MC@NLO
,
Powheg
,
Alpgen
and
Sherpa
. The experimental uncertainties
are often smaller than the spread of theoretical predictions, allowing deviations between data and
theory to be observed in some regions of phase space.
(will be inserted by the editor)
Measurement of t¯
t
production with a veto on additional
central jet activity in pp collisions at
√s = 7 TeV using the
ATLAS detector
The ATLAS Collaboration1CERN, 1211 Geneva 23, Switzerland
April 19, 2012
Abstract A measurement of the jet activity in t¯t events produced in proton-proton collisions at a centre-of-mass energy of 7 TeV is presented, using 2.05 fb−1 of inte-grated luminosity collected by the ATLAS detector at the Large Hadron Collider. The t¯t events are selected in the dilepton decay channel with two identified b-jets from the top quark decays. Events are vetoed if they contain an additional jet with transverse momentum above a threshold in a central rapidity interval. The fraction of events surviving the jet veto is presented as a function of this threshold for four different central ra-pidity interval definitions. An alternate measurement is also performed, in which events are vetoed if the scalar transverse momentum sum of the additional jets in each rapidity interval is above a threshold. In both mea-surements, the data are corrected for detector effects and compared to the theoretical models implemented in MC@NLO, Powheg, Alpgen and Sherpa. The experimental uncertainties are often smaller than the spread of theoretical predictions, allowing deviations between data and theory to be observed in some re-gions of phase space.
PACS 14.65.Ha, 12.38.Qk, 13.85.Qk
1 Introduction
Measurements of the top quark provide an important test of the Standard Model (SM) and any observed de-viation from the SM predictions could indicate the pres-ence of new physics. However, many top quark measure-ments have large uncertainties that arise from the the-oretical description of quark and gluon radiation in the standard Monte Carlo (MC) event generators. Recent measurements that are affected by such modelling un-certainties include the t¯t production cross-section [1–4],
the spin correlations in t¯t events [5], the charge asym-metry [6, 7] and the top quark mass [4]. In addition, a significant disagreement between data and the predic-tion from MC@NLO [8, 9] was observed by the D0 Col-laboration in the transverse momentum distribution of the t¯t system [10]. This disagreement obscures the inter-pretation of the observed forward-backward asymmetry in terms of a deviation from SM predictions. Measure-ments sensitive to the theoretical description of quark and gluon radiation in events containing a t¯t final state are therefore needed in order to constrain the modelling and reduce the impact on future experimental measure-ments.
In this article, a jet veto is used to quantify the jet activity that arises from quark and gluon radiation pro-duced in association with the t¯t system. The events are selected in the dilepton decay channel so that the addi-tional jets can be easily distinguished from the t¯t decay products (two leptons and two jets originating from b-quarks). The variable of interest is the ‘gap fraction’, defined as
f (Q0) = n(Q0)
N , (1)
where N is the number of selected t¯t events and n(Q0) is the subset of these events that do not contain an ad-ditional jet with transverse momentum, pT, above a threshold, Q0, in a central rapidity1 interval. The min-imum jet pT used in the measurement is 25 GeV. The
1 ATLAS uses a right-handed coordinate system with the z-axis along the beam line. Cylindrical coordinates (r, φ) are used in the transverse plane, φ being the azimuthal angle. Pseudorapidity is defined in terms of the polar an-gle θ as η = −ln [tan(θ/2)]. Rapidity is defined as y = 0.5 ln [(E + pz)/(E − pz)] where E denotes the energy and pz is the component of the momentum along the beam di-rection. Transverse momentum and energy are defined as pT= p sin θ and ET= E sin θ, respectively.
measurement is corrected for detector effects and pre-sented in a fiducial region. The gap fraction can then be written as
f (Q0) = σ(Q0)
σ , (2)
where σ is the fiducial cross section for inclusive t¯t pro-duction and σ(Q0) is the fiducial cross section for t¯t events produced in the absence of an additional jet with pT > Q0 in the rapidity interval. The gap fraction is measured for multiple values of Q0 and for four jet ra-pidity intervals: |y| < 0.8, 0.8 ≤ |y| < 1.5, 1.5 ≤ |y| < 2.1 and |y| < 2.1.
The veto criterion can be extended to probe jet ac-tivity beyond the leading additional jet. An alternate definition of the gap fraction is used in this case, f (Qsum) =
n(Qsum)
N ≡
σ(Qsum)
σ , (3)
where n(Qsum) is the number of t¯t events, and σ(Qsum) is the cross section, in which the scalar transverse mo-mentum sum of the additional jets in the rapidity inter-val is less than Qsum. The gap fraction defined using Q0 is mainly sensitive to the leading-pTemission accompa-nying the t¯t system, whereas the gap fraction defined using Qsum is sensitive to all hard emissions accompa-nying the t¯t system.
Many of the experimental systematic uncertainties cancel in the ratio, as observed in the ATLAS measure-ment of the gap fraction in dijet events [11]. The data are therefore expected to constrain the modelling of quark and gluon radiation in t¯t events and provide use-ful information about the general theoretical descrip-tion of jet vetoes, which have been proposed as a tool to enhance new physics signals [12–14], and to study the properties of new fundamental particles [15–17].
2 ATLAS Detector
The ATLAS detector [18] surrounds one of the proton-proton interaction points at the Large Hadron Collider. The inner tracking detector is composed of silicon pixel detectors, silicon microstrip detectors and a transition radiation tracking detector. The inner detector is sur-rounded by a superconducting solenoid that provides a 2 T magnetic field. This allows the momentum of charged particles that pass through the inner detector to be determined for |η| < 2.5. Outside the solenoid are liquid-argon electromagnetic sampling calorimeters (|η| < 3.2). Hadronic energy measurements are pro-vided by a scintillator tile calorimeter in the central re-gion (|η| < 1.7) and by liquid-argon calorimetry up to |η| < 4.9. The muon spectrometer system surrounds the
calorimeter system and incorporates a toroidal magnet system, with a field of approximately 0.5 and 1 T in the barrel and endcap regions respectively. The muon spectrometer provides precision measurements of the momentum of muons up to |η| < 2.7, while the corre-sponding trigger chambers are limited to |η| < 2.4.
The data are collected using a three-level trigger system. The first level is implemented in hardware and reduces the data rate to less than 75 kHz. The following two software trigger levels reduce the rate to several hundred Hz. The data passing the trigger selections are recorded for use in subsequent analyses.
The measurements presented in this paper use data from proton-proton collisions at a centre-of-mass en-ergy √s = 7 TeV, and rely on triggers designed to select events that contain high transverse momentum electrons or muons. The integrated luminosity of the data sample is 2.05 ± 0.08 fb−1 [19, 20].
3 Theoretical Predictions
The theoretical predictions for t¯t production are pro-duced using the MC@NLO [8, 9], Powheg [21, 22], Alpgen[23], Sherpa [24] and AcerMC [25, 26] event generators.
MC@NLO provides a calculation of t¯t production at next-to-leading order (NLO) accuracy and is inter-faced to Herwig [27] and Jimmy [28] for parton shower-ing, hadronisation and underlying event from multiple partonic interactions. The parton distribution functions (PDF) chosen to generate the MC@NLO events are CTEQ6.6 [29] and the underlying event tune for Her-wig/Jimmy is chosen to be AUET1 [30]. Powheg also produces the t¯t final state to NLO accuracy using the CTEQ6.6 PDF. The parton showering, hadronisation and underlying event are added by interfacing to ei-ther Pythia [31], with underlying event tune AMBT1 [32], or to Herwig/Jimmy, with underlying event tune AUET1.
Alpgen provides leading order (LO) matrix ele-ments for t¯t production with up to three additional partons in the final state. The Alpgen events are gen-erated using the CTEQ6L1 PDF [29] and interfaced to Herwig/Jimmy for parton showering, hadronisation and underlying event (tune AUET1). The MLM match-ing procedure [33] is used to remove double countmatch-ing between partons produced by the matrix element and parton shower. Sherpa is also used to generate t¯t events with up to three additional partons in the final state. This provides an independent LO matrix-element calcu-lation with a different matching scheme (CKKW [34]) between the matrix element and the parton shower. The
events are generated with the default underlying event tune and the CTEQ6L1 PDF.
AcerMC consists of a LO matrix element for t¯t production and is interfaced to Pythia to provide the hadronic final state, using the MRST2007LO∗PDF [35] and underlying event tune AMBT1. Three samples are produced with nominal, increased and decreased initial state radiation (ISR)2. These samples have been previ-ously used to assess ISR-based modelling uncertainties in ATLAS top quark measurements [1–3, 5, 6].
4 Simulation Samples
In order to simulate the events observed in the detector, several MC samples are passed through the GEANT4 [36] simulation of the ATLAS detector [37] and are pro-cessed with the same reconstruction chain as used for the data. The MC@NLO and Powheg samples de-scribed in Section 3 are used to simulate the t¯t events. The background contribution from single top, Z+jets and diboson production is estimated using MC@NLO [38], Alpgen and Herwig, respectively. The hadronic final state for each of these backgrounds is generated us-ing Herwig/Jimmy with underlyus-ing event tune AUET1. The MC samples are overlaid with additional minimum bias events generated with Pythia to simulate the ef-fect of additional proton-proton interactions. The simu-lated events are re-weighted such that the average num-ber of interactions per proton-proton bunch crossing, hµi, is the same in data and MC simulation. This aver-age varies between data-taking periods and is typically in the range 4 < hµi < 8.
Corrections are applied to the simulation to reflect the observed performance in the data. The electron re-construction efficiency, energy scale and energy resolu-tion are corrected to match the observed distriburesolu-tions in W → eν and Z → ee events [39]. The muon recon-struction efficiency, momentum scale and momentum resolution are corrected to match the observation in Z → µµ events. The jet energy resolution is found to be larger in the data than predicted by the simulation and additional smearing is applied to the simulated jets to ensure the resolution matches that in the data. The efficiency and rejection rate of the algorithm used to identify jets that have originated from b-quarks is mea-sured in the data and the simulation is corrected on a per-jet basis to match the observed performance. All these corrections have associated systematic
uncertain-2The default ISR parameters in AMBT1 are PARP(67)=4.0 and PARP(64)=1.0. To decrease ISR, the parameters are set to 0.5 and 4.0, respectively. To increase ISR, they are set to 6.0 and 0.25, respectively.
ties and the effect of these on the measurement of the gap fraction is discussed in Section 7.
5 Event Selection
The selection of t¯t events closely follows the selection used in the recent measurement of the t¯t production cross section [3]. Electrons are required to have trans-verse energy ET > 25 GeV and |η| < 2.47, whereas muons are required to have pT> 20 GeV and |η| < 2.5. Electrons in the transition region between the barrel and endcap calorimeters (1.37 < |η| < 1.52) are ex-cluded.
Jets are reconstructed using the anti-kt algorithm [40, 41], with a radius parameter R = 0.4, using clusters of adjacent calorimeter cells calibrated at the electro-magnetic (EM) energy scale. These jets are corrected for the calorimeter response and other detector effects using energy and pseudorapidity dependent calibration factors derived from simulation and validated using data [42]. The calibrated jets, j, used in the analysis are re-quired to have pT> 25 GeV, |y| < 2.4 and are required to be well separated from the selected leptons ℓ (elec-trons or muons) by
∆R(j, ℓ) = q
(∆φ(j, ℓ))2+ (∆η(j, ℓ))2> 0.4. (4) Jets originating from b-quarks (b-jets) are identified us-ing the IP3D+SV1 algorithm [43] and are referred to as b-tagged jets. This algorithm, based on impact pa-rameter and secondary vertex information, has an aver-age per-jet efficiency of 70% for jets originating from b-quarks in simulated t¯t events and rejects approximately 99% of jets originating from light quarks and gluons.
The scalar sum of visible transverse momentum, HT, is calculated using the transverse momenta of all the reconstructed jets and leptons that satisfy the selec-tion criteria defined above. The missing transverse mo-mentum, Emiss
T , is reconstructed from EM-scale clusters corrected according to the energy scale of associated jets/electrons and the measured muon momenta.
To create a highly enriched t¯t sample, events are re-quired to have two opposite sign high-pTleptons and at least two b-tagged jets. The analysis is then divided into the three dilepton decay channels, ee, eµ and µµ, and additional channel-dependent selection criteria are ap-plied to reduce backgrounds further. The background in the ee and µµ channels arising from Z → ee/µµ events is suppressed by requiring Emiss
T > 40 GeV and that the dilepton mass, mℓℓ, is not in the range of the Z-boson mass, i.e. |mℓℓ− 91 GeV| > 10 GeV. In addition, events are required to have mℓℓ > 15 GeV in order to reject backgrounds from vector-meson decays. The
backgrounds in the eµ channel from Z → ττ and dibo-son events are suppressed by requiring HTto be greater than 130 GeV. A summary of the event selection crite-ria is presented in Table 1.
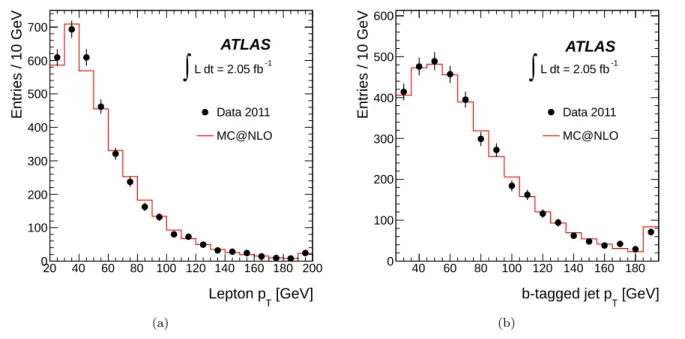
The number of selected events in the three channels is 242 (ee), 436 (µµ) and 1095 (eµ). The dominant back-ground contributions after the selection requirements are single top (W t) production and events in which at least one lepton originates from heavy flavour decay or jet misidentification. The latter contribution consists of mainly W +jets and multijet events and is estimated from the data using a method described in reference [3]. The W t background is estimated using the MC sample discussed in Section 4. The total background contami-nation is estimated to be less than 6%, which is smaller than the uncertainty on the theoretical calculation of the t¯t cross section [44–46]. The expected background contributions are not subtracted from the data, but are considered as a source of systematic uncertainty on the measurement. Figure 1 shows the distribution of the lepton and b-tagged jet pTfor the selected data events compared with the prediction from the MC@NLO t¯t simulation. Good agreement is seen in all such distri-butions.
The gap fraction in each rapidity interval is com-puted using the additional jets in the event. To suppress jets from overlapping proton-proton collisions, the ad-ditional jets are required to be fully contained within the inner detector acceptance (|y| < 2.1) and the jet vertex fraction (JVF) algorithm is used to identify jets from the primary interaction. After associating tracks to jets (∆R(jet, track) < 0.4), the JVF is defined as the scalar summed transverse momentum of associated tracks from the primary vertex divided by the summed transverse momentum of associated tracks from all ver-tices. Each additional jet is required to satisfy JVF > 0.75. The transverse momentum and rapidity distri-butions for the highest-pT additional jet in the region |y| < 2.1 is shown in Figure 2. Reasonable agreement is seen between the data and the MC@NLO t¯t simula-tion.
6 Correction for Detector Effects
The data are corrected for detector effects to produce results at the particle level. The particle level t¯t events are defined in each channel using the same event selec-tion criteria applied to the reconstructed data, as pre-sented in Table 1. Final state stable particles are defined as those that have a mean lifetime cτ > 10 mm. Elec-trons are required to have ET> 25 GeV and |η| < 2.47, whereas muons are required to have pT> 20 GeV and
|η| < 2.53. Jets are reconstructed using the anti-k t al-gorithm with R = 0.4, using all stable particles ex-cept muons and neutrinos, and are required to have pT > 25 GeV and |y| < 2.4. Jets originating from b-quarks are defined as any jet that is within ∆R < 0.3 of a B-hadron, where the B-hadrons are required to have pT> 5 GeV. HT is defined as the scalar sum of jet and lepton transverse momenta and Emiss
T is defined using all final state neutrinos.
The correction factor, C, for the gap fraction at a specific value of x = Q0or Qsum, is defined as
C(x) = f truth(x)
freco(x), (5)
where freco(x) is the reconstructed gap fraction and ftruth(x) is the particle level gap fraction. The use of simple correction factors is justified because the pu-rity of the selected events is greater than 70% for each value of Q0 or Qsum. The purity of the selected events is defined as the number of events that pass the event selection at both the reconstructed and particle level, divided by the number of events that pass the event selection at reconstructed level, using the MC@NLO simulation of t¯t events.
The MC@NLO simulation is also used to derive the baseline correction factors used in this measurement. These correction factors depend on the rapidity interval used to veto jet activity, with corrections of 2% − 5% for Q0 = 25 GeV that decrease with increasing Q0. The systematic uncertainties on these correction factors due to physics and detector modelling are discussed in Section 7.
7 Systematic Uncertainties
Uncertainties related to the inclusive t¯t event selection were found to cancel in the gap fraction and are ne-glected in the final systematic uncertainty. These in-clude the uncertainties on the lepton momentum scale, momentum resolution and reconstruction efficiency, the b-jet energy scale, the trigger efficiency for each anal-ysis channel and the integrated luminosity. The dom-inant sources of systematic uncertainty are those that directly affect the additional jets. These non-negligible sources of uncertainty are discussed in this section and a summary is presented in Figure 3.
The experimental aspects that affect the additional jets are the jet energy scale (JES), the jet energy reso-lution (JER), the jet reconstruction efficiency and the
3Changing the muon selection criteria to match the electron fiducial region (pT > 25 GeV and |η| < 2.47) was observed to have a negligible impact on the gap fraction.
[GeV] T Lepton p 20 40 60 80 100 120 140 160 180 200 Entries / 10 GeV 0 100 200 300 400 500 600 700 Data 2011 MC@NLO -1 L dt = 2.05 fb
∫
ATLAS (a) [GeV] T b-tagged jet p 40 60 80 100 120 140 160 180 Entries / 10 GeV 0 100 200 300 400 500 600 Data 2011 MC@NLO -1 L dt = 2.05 fb∫
ATLAS (b)Fig. 1 The distribution of (a) lepton pTand (b) b-tagged jet pTfor the selected events compared to the MC@NLO simulation of t¯t events. The data is shown as closed (black) circles with the statistical uncertainty. The MC@NLO prediction is normalised to the data and is shown as a solid (red) line. The overflow events at high pTare added into the final bin of each histogram.
[GeV]
T
Leading additional jet p
50 100 150 200 250 300 Events / 20 GeV 0 50 100 150 200 250 300 350 Data 2011 MC@NLO -1 L dt = 2.05 fb
∫
ATLAS (a)Leading additional jet |y|
0 0.2 0.4 0.6 0.8 1 1.2 1.4 1.6 1.8 2 dN / d|y| 0 100 200 300 400 500 600 Data 2011 MC@NLO -1 L dt = 2.05 fb
∫
ATLAS (b)Fig. 2 Distribution of (a) leading additional jet pTand (b) leading additional jet rapidity in the selected events compared to the MC@NLO simulation of t¯t events. The data is shown as closed (black) circles with the statistical uncertainty. The MC@NLOprediction is normalised to the data and is shown as a solid (red) line. In the pTdistribution, the overflow events at high pTare added into the final bin of the histogram. In the rapidity distribution, variable bin sizes are used such that the bin edges match the rapidity intervals used to construct the gap fractions.
Table 1 Selection requirements applied to the three analysis channels. Channel
Selection ee µµ eµ
Electrons 2 with ET|η| < 2.47> 25 GeV, − 1 with ET|η| < 2.47> 25 GeV, Muons − 2 with pT> 20 GeV, 1 with pT> 20 GeV,
|η| < 2.5 |η| < 2.5 Emiss
T > 40 GeV > 40 GeV −
HT − − > 130 GeV
mℓℓ > 15 GeV > 15 GeV −
|mℓℓ− 91 GeV| > 10 GeV |mℓℓ− 91 GeV| > 10 GeV
b-tagged jets At least 2 with pT> 25 GeV, |y| < 2.4, ∆R(j, ℓ) > 0.4
[GeV] 0 Q 20 40 60 80 100 120 140 160 180 200 Fractional uncertainty -0.04 -0.02 0 0.02 0.04 Stat. uncert. Total systematic JES / JER Unfolding Pileup/ JVF b-Tagging Backgrounds
veto region: |y| < 0.8
-1 L dt = 2.05 fb
∫
ATLAS
(a) [GeV] 0 Q 20 40 60 80 100 120 140 160 180 200 Fractional uncertainty -0.05 0 0.05 Stat. uncert. Total systematic JES / JER Unfolding Pileup/ JVF b-Tagging Backgroundsveto region: |y| < 2.1
-1
L dt = 2.05 fb
∫
ATLAS
(b)
Fig. 3 Breakdown of the systematic uncertainties on the gap fraction as a function of Q0for (a) |y| < 0.8 and (b) |y| < 2.1. The step size in Q0was chosen to be commensurate with the jet energy resolution. The individual systematic uncertainties are shown as labelled lines of different styles and the total systematic uncertainty is shown as the outer solid line. The statistical uncertainty on the data is shown as the shaded area. The breakdown of the systematic uncertainties above Q0 = 200 GeV is consistent with the results at Q0 = 200 GeV. ‘Pileup’ refers to the effect of jets produced in a different proton-proton interaction. ‘Unfolding’ refers to the procedure used to correct the measured gap fraction to particle level.
JVF selection requirement. The uncertainty on the gap fraction due to the JES is estimated by rescaling the jet energies in the simulation by the known uncertainty [42]. The uncertainty on the JES includes the impact of soft energy added to jets from multiple proton-proton interactions. The uncertainty on the gap fraction due to jet reconstruction efficiency [42] and the jet energy resolution is estimated by varying each of these in the simulation within the allowed uncertainties determined from data. The relative uncertainty on the gap fraction due to the JES and JER uncertainties is 3.5% or less if jets are vetoed in the full rapidity interval (|y| < 2.1), and 1.5% or less if jets are vetoed in the smaller
sub-intervals (e.g. |y| < 0.8). The uncertainty from the jet reconstruction efficiency is found to be negligible com-pared to the JES and JER uncertainties for all four rapidity intervals.
The bias due to the JVF selection efficiency is es-timated by performing the full analysis (selection plus correction for detector effects) with a relaxed require-ment of JVF > 0.1. The relative difference between the results obtained with the standard and relaxed require-ment is found to be up to 2% at Q0 = 25 GeV and is negligible above Q0 of approximately 100 GeV. This difference is taken as the systematic uncertainty due to the JVF selection efficiency.
Jets produced by additional proton-proton interac-tions are suppressed by the JVF requirement. However, those jets that pass this requirement represent a po-tential bias in the measurement. The size of this bias is evaluated by removing those jets in the MC@NLO sample that are not matched to a particle level jet from the pp interaction that produces the t¯t event. The matching criterion is ∆R < 0.3 and the particle jet transverse momentum is allowed to be as low as 7 GeV, to avoid resolution effects in the matching procedure. The gap fraction is recalculated using this truth-matched sample and the difference to the nominal gap fraction is taken as the systematic uncertainty due to jets from additional proton-proton interactions. The relative un-certainty on the gap fraction is less than 1% in each of the rapidity regions.
Background contamination is treated as a system-atic uncertainty. For each background source, the ex-pected events are subtracted from the data and the gap fraction is re-calculated. The relative difference with respect to the nominal result is taken as the system-atic uncertainty due to background contamination; the largest effect is observed to be 0.5% for Q0= 25 GeV.
The uncertainty on the efficiency and rejection capa-bility of the b-tagging algorithm impacts upon the mea-surement if the additional jet is identified as a b-tagged jet instead of one of the b-jets originating from the top-quark decay. The systematic uncertainty due to this effect is estimated by changing the baseline efficiency and rejection corrections, which are applied to the sim-ulation, according to the b-tagging uncertainty (derived in calibration studies using inclusive lepton and multi-jet final states). The relative uncertainty on the gap fraction is less than 0.8%.
The uncertainty on the procedure used to correct the data to particle level due to physics modelling is es-timated by deriving alternative correction factors using the Powheg samples. The systematic uncertainty in the correction procedure is taken to be the largest dif-ference between the correction factor obtained using the MC@NLO sample and the correction factor obtained using the two Powheg samples. In the case where this difference is smaller than the statistical uncertainty in the MC samples, the statistical uncertainty is taken as the estimate of the systematic uncertainty. The relative uncertainty on the correction factors is less than 2% at Q0 = 25 GeV for the region |y| < 2.1, decreasing to approximately 0.3% at Q0= 150 GeV. The sensitivity of the corrections to the physics modelling is further assessed by reweighting the additional jet pTspectrum in the MC@NLO sample such that the pTdistribution has the maximal change in shape that is consistent with the JES uncertainty bands. The difference in the
correc-tion factors was observed to be much smaller than the differences obtained by using different MC generators and is neglected in the final results.
Figure 3 shows the breakdown of the systematic un-certainties on the gap fraction as a function of Q0, for the veto regions |y| < 0.8 and |y| < 2.1. This Figure also shows the total systematic uncertainty, which is calculated by adding in quadrature all the individual systematic uncertainties. The total systematic uncer-tainty is largest at low Q0and is dominated by the jet related uncertainties (JES, JER and JVF) and the un-certainty on the correction factors. The measurement is most precise in the central region, where the jet energy scale uncertainty is smallest. The breakdown of uncer-tainties for the gap fraction as a function of Qsum is similar, but the uncertainties are slightly larger and fall more slowly as a function of Qsum. This is due to low transverse momentum jets, which have the largest sys-tematic uncertainties and therefore affect all values of Qsum.
8 Results and Discussion
The gap fraction is measured for multiple values of Q0 and Qsum in the four rapidity intervals defined in Sec-tion 1. The step size in Q0 and Qsum was chosen to be commensurate with the jet energy resolution. The re-sults are corrected to the particle level as described in Section 6.
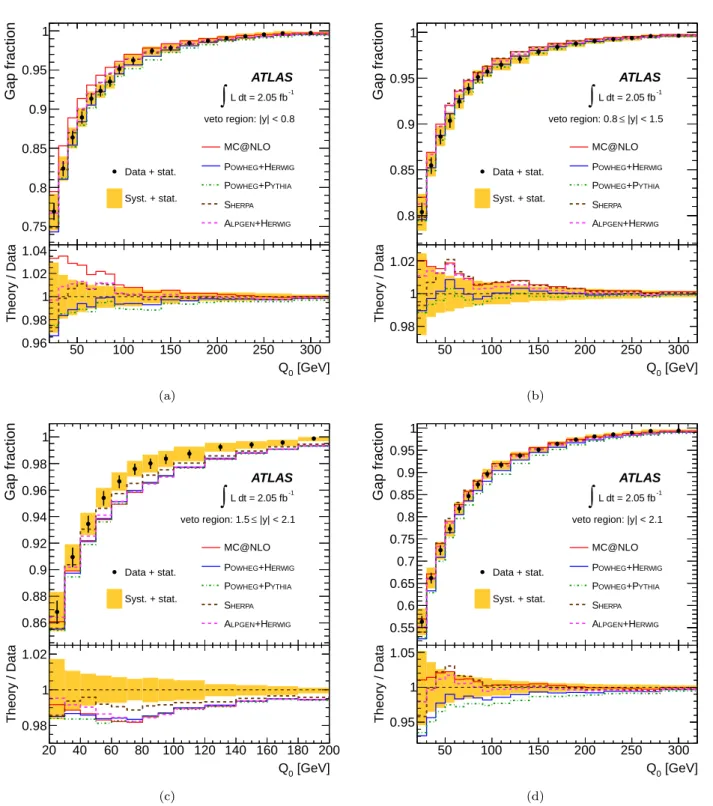
The measured gap fraction as a function of Q0 is compared with the predictions from the multi-leg LO and NLO generators in Figure 4. In general, all these generators are found to give a reasonable description of the data if the veto is applied to jets in the full rapidity interval, |y| < 2.1 (Figure 4(d)). The difference between the MC@NLO and Powheg predictions is similar to the precision achieved in the measurement and as such the measurement is probing the different approaches to NLO plus parton-shower event generation.
In the most central rapidity interval, |y| < 0.8, the gap fraction predicted by MC@NLO is too large (Fig-ure 4(a)). The tendency of MC@NLO to produce fewer jets than Alpgen at central rapidity has been discussed in the literature [33] and the measurement presented here is sensitive to this difference. In the most forward rapidity interval, none of the predictions agrees with the data for all values of Q0 (Figure 4(c)). In par-ticular, although MC@NLO, Powheg, Alpgen and Sherpa produce similar predictions, the gap fraction is too small, implying that too much jet activity is pro-duced by these event generators in the forward rapidity region.
[GeV] 0 Q 50 100 150 200 250 300 Theory / Data 0.96 0.98 1 1.02 1.04 50 100 150 200 250 300 Gap fraction 0.75 0.8 0.85 0.9 0.95 1 Data + stat. Syst. + stat. MC@NLO ERWIG +H OWHEG P YTHIA +P OWHEG P HERPA S ERWIG +H LPGEN A
veto region: |y| < 0.8
-1 L dt = 2.05 fb
∫
ATLAS (a) [GeV] 0 Q 50 100 150 200 250 300 Theory / Data 0.98 1 1.02 50 100 150 200 250 300 Gap fraction 0.8 0.85 0.9 0.95 1 Data + stat. Syst. + stat. MC@NLO ERWIG +H OWHEG P YTHIA +P OWHEG P HERPA S ERWIG +H LPGEN A |y| < 1.5 ≤ veto region: 0.8 -1 L dt = 2.05 fb∫
ATLAS (b) [GeV] 0 Q 20 40 60 80 100 120 140 160 180 200 Theory / Data 0.98 1 1.0220 40 60 80 100 120 140 160 180 200 Gap fraction 0.86 0.88 0.9 0.92 0.94 0.96 0.98 1 Data + stat. Syst. + stat. MC@NLO ERWIG +H OWHEG P YTHIA +P OWHEG P HERPA S ERWIG +H LPGEN A |y| < 2.1 ≤ veto region: 1.5 -1 L dt = 2.05 fb∫
ATLAS (c) [GeV] 0 Q 50 100 150 200 250 300 Theory / Data 0.95 1 1.05 50 100 150 200 250 300 Gap fraction 0.55 0.6 0.65 0.7 0.75 0.8 0.85 0.9 0.95 1 Data + stat. Syst. + stat. MC@NLO ERWIG +H OWHEG P YTHIA +P OWHEG P HERPA S ERWIG +H LPGEN Aveto region: |y| < 2.1
-1
L dt = 2.05 fb
∫
ATLAS(d)
Fig. 4 The measured gap fraction as a function of Q0is compared with the prediction from the NLO and multi-leg LO MC generators in the three rapidity regions, (a) |y| < 0.8, (b) 0.8 ≤ |y| < 1.5 and (c) 1.5 ≤ |y| < 2.1. Also shown, (d), is the gap fraction for the full rapidity range |y| < 2.1. The data is represented as closed (black) circles with statistical uncertainties. The yellow band is the total experimental uncertainty on the data (statistical and systematic). The theoretical predictions are shown as solid and dashed coloured lines. The gap fraction is shown until Q0= 300 GeV or until the gap fraction reaches one if that occurs before Q0= 300 GeV.
[GeV] 0 Q 50 100 150 200 250 300 Theory / Data 0.9 0.95 1 1.05 50 100 150 200 250 300 Gap fraction 0.7 0.75 0.8 0.85 0.9 0.95 1 Data + stat. Syst. + stat. MC nominal CER A Increased ISR Decreased ISR veto region: |y| < 0.8
-1 L dt = 2.05 fb
∫
ATLAS (a) [GeV] 0 Q 50 100 150 200 250 300 Theory / Data 0.8 0.9 1 1.1 50 100 150 200 250 300 Gap fraction 0.5 0.6 0.7 0.8 0.9 1 Data + stat. Syst. + stat. MC nominal CER A Increased ISR Decreased ISR veto region: |y| < 2.1-1
L dt = 2.05 fb
∫
ATLAS(b)
Fig. 5 The measured gap fraction as a function of Q0 for (a) |y| < 0.8 and (b) |y| < 2.1 is compared with the prediction from the AcerMC generator, where different settings of the Pythia parton shower parameters are used to produce samples with nominal, increased and decreased initial state radiation (ISR). The data and theory predictions are represented in the same way as in Figure 4.
The predictions from the AcerMC generator with the variations of the Pythia parton shower parameters are compared to the data in Figure 5 and are found to be in poor agreement with the data. The spread of the predicted gap fraction due to the parameter variations is found to be much larger than the experimental un-certainty, indicating that the variations can be signif-icantly reduced in light of the measurement presented in this article.
The measured gap fraction as a function of Qsumis compared with the multi-leg LO and NLO generators in Figure 6. The gap fraction is lower than for the case of the Q0 variable, demonstrating that the measurement is probing quark and gluon radiation beyond the first emission. As expected, the largest change in the gap fraction occurs when jets are vetoed in the full rapid-ity interval, |y| < 2.1. However, the difference between the data and each theoretical prediction is found to be similar to the Q0 case. This implies that, for this vari-able, the parton shower approximations used for the subsequent emissions in MC@NLO and Powheg are performing as well as the LO approximations used in
Alpgenand Sherpa.
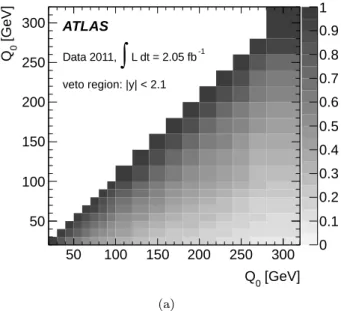
The gap fraction is a ratio of cross sections and all the events are used to evaluate this ratio at each value of Q0or Qsum. This means that there is a statistical
corre-lation between the measured gap fraction values in each rapidity interval. The correlation matrix is shown in Figure 7 for the gap fraction at different values of Q0for the |y| < 2.1 rapidity region. Neighbouring Q0 points have a significant correlation, whereas well separated Q0points are less correlated.
The measured values of the gap fraction at Q0 = 25, 75 and 150 GeV are presented in Table 2 for the dif-ferent rapidity intervals used to veto jet activity. The statistical correlations between these measurements and the predictions from the multi-leg LO and NLO gener-ators are also given. The measured values of the gap fraction at Qsum= 55, 150 and 300 GeV are presented in Table 3 for the different rapidity intervals used to veto jet activity. The complete set of measurements pre-sented in Figures 4-7 have been compiled in tables that can be obtained from HEPDATA.
The precision of the data, coupled with the large spread of theory predictions, implies that higher-order theory predictions may be needed to describe the data in all regions of phase space. For example, the NLO plus parton shower predictions provided by MC@NLO and Powheghave LO accuracy in the first parton emission and leading logarithmic (LL) accuracy for subsequent emissions. Similarly, the ME plus parton shower pre-dictions provided by Sherpa and Alpgen are accurate
[GeV] sum Q 50 100 150 200 250 300 350 400 Theory / Data 0.98 1 1.02 1.0450 100 150 200 250 300 350 400 Gap fraction 0.75 0.8 0.85 0.9 0.95 1 Data + stat. Syst. + stat. MC@NLO YTHIA +P OWHEG P ERWIG +H OWHEG P HERPA S ERWIG +H LPGEN A
veto region: |y| < 0.8
-1 L dt = 2.05 fb
∫
ATLAS (a) [GeV] sum Q 50 100 150 200 250 300 350 400 Theory / Data 0.98 1 1.02 50 100 150 200 250 300 350 400 Gap fraction 0.8 0.85 0.9 0.95 1 Data + stat. Syst. + stat. MC@NLO YTHIA +P OWHEG P ERWIG +H OWHEG P HERPA S ERWIG +H LPGEN A |y| < 1.5 ≤ veto region: 0.8 -1 L dt = 2.05 fb∫
ATLAS (b) [GeV] sum Q 60 80 100 120 140 160 180 200 220 240 Theory / Data 0.97 0.98 0.99 1 1.01 60 80 100 120 140 160 180 200 220 240 Gap fraction 0.91 0.92 0.93 0.94 0.95 0.96 0.97 0.98 0.99 1 Data + stat. Syst. + stat. MC@NLO YTHIA +P OWHEG P ERWIG +H OWHEG P HERPA S ERWIG +H LPGEN A |y| < 2.1 ≤ veto region: 1.5 -1 L dt = 2.05 fb∫
ATLAS (c) [GeV] sum Q 50 100 150 200 250 300 350 400 Theory / Data 0.95 1 1.0550 100 150 200 250 300 350 400 Gap fraction 0.6 0.7 0.8 0.9 1 Data + stat. Syst. + stat. MC@NLO YTHIA +P OWHEG P ERWIG +H OWHEG P HERPA S ERWIG +H LPGEN Aveto region: |y| < 2.1
-1
L dt = 2.05 fb
∫
ATLAS(d)
Fig. 6 The measured gap fraction as a function of Qsumis compared with the prediction from the NLO and multi-leg LO MC generators in the three rapidity regions, (a) |y| < 0.8, (b) 0.8 ≤ |y| < 1.5 and (c) 1.5 ≤ |y| < 2.1. Also shown, (d), is the gap fraction for the full rapidity range |y| < 2.1. The data and theory predictions are represented in the same way as in Figure 4. The gap fraction is shown until Qsum= 420 GeV or until the gap fraction reaches one if that occurs before Qsum= 420 GeV.
Table 2 The measured values of f (Q0) for Q0 = 25, 75 and 150 GeV for the different rapidity intervals used to veto jet activity are presented. The predictions from the NLO and multi-leg LO generators are also presented; the statistical uncertainty due to limited sample size is shown if this uncertainty is larger than 0.1%. In each rapidity interval, the statistical correlations (ρi
j) between measurements at Q0= i and Q0= j are given.
f (Q0) (%)
Q0[GeV] Data ± (stat.) ± (syst.) MC@NLO Powheg Powheg Sherpa Alpgen ρi j +Pythia +Herwig +Herwig
veto region: |y| < 0.8
25 76.9 ± 1.1+ 2.0 − 2.1 79.5 ± 0.1 75.0 ± 0.3 74.3 ± 0.3 74.9 ± 0.3 76.7 ± 0.3 ρ 25 75 = 0.52 75 92.3 ± 0.7 ± 0.5 94.3 91.8 ± 0.2 92.2 ± 0.2 93.4 ± 0.2 93.4 ± 0.2 ρ75 150 = 0.51 150 97.8+ 0.3 − 0.4± 0.4 98.4 97.2 ± 0.1 97.6 ± 0.1 97.8 ± 0.1 98.0 ± 0.1 ρ 150 25 = 0.27 veto region: 0.8 ≤ |y| < 1.5
25 80.4 ± 1.0 ± 1.7 82.0 ± 0.1 79.5 ± 0.2 79.5 ± 0.3 79.8 ± 0.3 81.3 ± 0.3 ρ25 75 = 0.49 75 93.9 ± 0.6+ 0.5 − 0.4 94.7 93.5 ± 0.2 93.8 ± 0.2 94.8 ± 0.1 94.7 ± 0.2 ρ 75 150 = 0.55 150 97.9+ 0.3 − 0.4± 0.2 98.4 97.7 ± 0.1 98.0 ± 0.1 98.4 ± 0.1 98.2 ± 0.1 ρ 150 25 = 0.29 veto region: 1.5 ≤ |y| < 2.1
25 86.8+ 0.8 − 0.9 + 1.2 − 1.1 86.1 ± 0.1 85.4 ± 0.2 85.5 ± 0.2 85.6 ± 0.2 86.4 ± 0.2 ρ2575 = 0.42 75 97.6 ± 0.4 ± 0.4 95.8 95.9 ± 0.1 96.0 ± 0.1 96.5 ± 0.1 95.9 ± 0.1 ρ75 150 = 0.48 150 99.4+ 0.2 − 0.3± 0.2 98.8 98.7 ± 0.1 98.8 ± 0.1 98.9 ± 0.1 98.8 ± 0.1 ρ 150 25 = 0.20 veto region: |y| < 2.1
25 56.4 ± 1.3+ 2.6 − 2.8 57.0 ± 0.1 52.7 ± 0.3 52.5 ± 0.3 54.0 ± 0.3 55.2 ± 0.3 ρ 25 75 = 0.48 75 84.7 ± 0.9 ± 1.0 85.7 ± 0.1 82.7 ± 0.2 83.6 ± 0.2 86.0 ± 0.2 85.1 ± 0.2 ρ75 150 = 0.50 150 95.2+ 0.5 − 0.6± 0.4 95.6 93.9 ± 0.1 94.5 ± 0.1 95.3 ± 0.1 95.1 ± 0.1 ρ 150 25 = 0.24
Table 3 The measured values of f (Qsum) for Qsum= 55, 150 and 300 GeV for the different rapidity intervals used to veto jet activity are presented, excluding any measurements of f (Qsum) = 1.0. The predictions from the Monte Carlo event generators and the statistical correlations (ρi
j) between measurements are presented in the same way as in Table 2.
f (Qsum) (%)
Qsum[GeV] Data ± (stat.) ± (syst.) MC@NLO Powheg Powheg Sherpa Alpgen ρi j +Pythia +Herwig +Herwig
veto region: |y| < 0.8 55 88.1+ 0.8 − 0.9 + 1.3 − 1.4 91.4 ± 0.1 88.0 ± 0.2 88.4 ± 0.2 89.9 ± 0.2 90.1 ± 0.2 ρ 55 150= 0.45 150 97.4+ 0.4 − 0.5 + 0.8 − 0.9 98.4 97.2 ± 0.1 97.6 ± 0.1 97.8 ± 0.1 98.0 ± 0.1 ρ 150 300= 0.46 300 99.4+ 0.2 − 0.3± 0.3 99.7 99.4 99.6 99.6 99.6 ρ 300 55 = 0.20 veto region: 0.8 ≤ |y| < 1.5
55 89.3 ± 0.8 ± 0.9 92.0 90.6 ± 0.2 91.1 ± 0.2 92.2 ± 0.2 92.0 ± 0.2 ρ55 150= 0.48 150 97.3 ± 0.4 ± 0.3 98.4 97.7 ± 0.1 98.0 ± 0.1 98.4 ± 0.1 98.2 ± 0.1 ρ150 300= 0.34 300 99.6+ 0.1 − 0.2± 0.1 99.8 99.6 99.6 99.7 99.6 ρ 300 55 = 0.15 veto region: 1.5 ≤ |y| < 2.1
55 95.2+ 0.5− 0.6± 0.6 93.8 93.6 ± 0.2 93.9 ± 0.2 94.6 ± 0.2 94.1 ± 0.2 ρ55150= 0.40 150 99.3+ 0.2− 0.3± 0.2 98.8 98.7 ± 0.1 98.8 ± 0.1 98.9 ± 0.1 98.8 ± 0.1 − veto region: |y| < 2.1
55 72.7 ± 1.1+ 2.3 − 2.5 79.0 ± 0.1 75.3 ± 0.3 76.5 ± 0.3 79.6 ± 0.3 78.6 ± 0.3 ρ 55 150= 0.47 150 92.1 ± 0.7 ± 0.8 95.6 93.9 ± 0.1 94.5 ± 0.1 95.3 ± 0.1 95.1 ± 0.1 ρ150 300= 0.46 300 98.1+ 0.3 − 0.4 + 0.2 − 0.3 99.4 98.8 ± 0.1 99.1 ± 0.1 99.2 ± 0.1 99.1 ± 0.1 ρ 300 55 = 0.21
to LO for the first three emissions and LL thereafter. Possible improvements on this accuracy include NLO calculations that account for the decay products of the top quarks [47, 48] and calculations of t¯t + j(j) at NLO [49–54]. [GeV] 0 Q 50 100 150 200 250 300 [GeV] 0 Q 50 100 150 200 250 300 0 0.1 0.2 0.3 0.4 0.5 0.6 0.7 0.8 0.9 1
veto region: |y| < 2.1
ATLAS -1 L dt = 2.05 fb
∫
Data 2011, (a)Fig. 7 The correlation matrix (statistical) for the gap frac-tion measurement at different values of Q0for |y| < 2.1.
9 Conclusions
Precision measurements of the jet activity in t¯t events were performed using proton-proton collisions recorded by the ATLAS detector at the LHC. The t¯t events were selected in the dilepton decay channel with two iden-tified b-jets. Events were subsequently vetoed if they contained an additional jet with transverse momentum above a threshold, Q0, in a central rapidity interval. The fraction of t¯t events that survive the jet veto was presented as a function of Q0 for four different central rapidity interval definitions. An alternate measurement was also performed, in which the t¯t events were vetoed if the scalar transverse momentum sum of the addi-tional jets in each rapidity interval was above a defined threshold, Qsum.
The data were fully corrected for detector effects and compared to the predictions from state-of-the-art MC event generators. MC@NLO, Powheg, Alpgen and Sherpa are observed to give a reasonable descrip-tion of the data, when the addidescrip-tional jets are vetoed in the rapidity interval |y| < 2.1. However, all four gen-erators predict too much jet activity in the most
for-ward rapidity interval, 1.5 ≤ |y| < 2.1. Furthermore, MC@NLO produces too little activity in the central region |y| < 0.8.
The data were compared to the predictions obtained after increasing (or decreasing) the amount of initial state radiation produced by the Pythia parton shower when applied to AcerMC events. These initial state parton shower variations have been used to determine modelling uncertainties in previous ATLAS top quark measurements. Although the data are within the band of these predictions, the size of the band is a factor of two or more larger than the experimental precision. The results presented here can be used to constrain model-dependent uncertainties in future measurements.
10 Acknowledgements
We thank CERN for the very successful operation of the LHC, as well as the support staff from our institutions without whom ATLAS could not be operated efficiently. We acknowledge the support of ANPCyT, Argentina; YerPhI, Armenia; ARC, Australia; BMWF, Austria; ANAS, Azerbaijan; SSTC, Belarus; CNPq and FAPESP, Brazil; NSERC, NRC and CFI, Canada; CERN; CON-ICYT, Chile; CAS, MOST and NSFC, China; COL-CIENCIAS, Colombia; MSMT CR, MPO CR and VSC CR, Czech Republic; DNRF, DNSRC and Lundbeck Foundation, Denmark; EPLANET and ERC, European Union; IN2P3-CNRS, CEA-DSM/IRFU, France; GNAS, Georgia; BMBF, DFG, HGF, MPG and AvH Founda-tion, Germany; GSRT, Greece; ISF, MINERVA, GIF, DIP and Benoziyo Center, Israel; INFN, Italy; MEXT and JSPS, Japan; CNRST, Morocco; FOM and NWO, Netherlands; RCN, Norway; MNiSW, Poland; GRICES and FCT, Portugal; MERYS (MECTS), Romania; MES of Russia and ROSATOM, Russian Federation; JINR; MSTD, Serbia; MSSR, Slovakia; ARRS and MVZT, Slovenia; DST/NRF, South Africa; MICINN, Spain; SRC and Wallenberg Foundation, Sweden; SER, SNSF and Cantons of Bern and Geneva, Switzerland; NSC, Taiwan; TAEK, Turkey; STFC, the Royal Society and Leverhulme Trust, United Kingdom; DOE and NSF, United States of America.
The crucial computing support from all WLCG part-ners is acknowledged gratefully, in particular from CERN and the ATLAS Tier-1 facilities at TRIUMF (Canada), NDGF (Denmark, Norway, Sweden), CC-IN2P3 (France), KIT/GridKA (Germany), INFN-CNAF (Italy), NL-T1 (Netherlands), PIC (Spain), ASGC (Taiwan), RAL (UK) and BNL (USA) and in the Tier-2 facilities worldwide.
References
1. ATLAS Collaboration, Phys. Lett. B707, 459 (2012). arXiv:1108.3699
2. ATLAS Collaboration, Phys. Lett. B711, 244 (2012). arXiv:1201.1889
3. ATLAS Collaboration, JHEP 1205, 059 (2012). arXiv:1202.4892
4. CMS Collaboration, JHEP 1107, 049 (2011). arXiv:1105.5661
5. ATLAS Collaboration, Phys. Rev. Lett. 108, 212001 (2012). arXiv:1203.4081
6. ATLAS Collaboration, Accepted by Eur. Phys. J. C (2012). arXiv:1203.4211
7. CMS Collaboration, Phys. Lett. B709, 28 (2012). arXiv:1112.5100
8. S. Frixione, B.R. Webber, JHEP 06, 029 (2002). arXiv:hep-ph/0204244
9. S. Frixione, P. Nason, B.R. Webber, JHEP 08, 007 (2003). arXiv:hep-ph/0305252
10. D0 Collaboration, V. M. Abazov et al., Phys. Rev. D84, 112005 (2011). arXiv:1107.4995
11. ATLAS Collaboration, JHEP 1109, 053 (2011). arXiv:1107.1641
12. V. D Barger et al., Phys. Rev. D42, 3052 (1990). DOI 10.1103/PhysRevD.42.3052
13. V. D. Barger et al., Phys. Rev. D44, 2701
(1991). Erratum-ibid. D48 (1993) 5444. DOI
10.1103/PhysRevD.44.2701,
10.1103/Phys-RevD.48.5444
14. V. D. Barger et al., Phys. Lett. B346, 106 (1995). arXiv:hep-ph/9412276
15. B.E. Cox, J.R. Forshaw, A.D. Pilkington, Phys. Lett. B696, 87 (2011). arXiv:1006.0986
16. I. Sung, Phys. Rev. D80, 094020 (2009).
arXiv:0908.3688
17. S. Ask et al., JHEP 1201, 018 (2012).
arXiv:1108.2396
18. ATLAS Collaboration, JINST 3, S08003 (2008) 19. ATLAS Collaboration, Eur. Phys. J. C 71, 1630
(2011). arXiv:1101.2185
20. ATLAS Collaboration, ATLAS-CONF-2011-116. https://cdsweb.cern.ch/record/1376384
21. P. Nason, JHEP 11, 040 (2004).
arXiv:hep-ph/0409146
22. S. Frixione, P. Nason, C. Oleari, JHEP 0711, 070 (2007). arXiv:0709.2092
23. M.L. Mangano et al., JHEP 07, 001 (2003). arXiv:hep-ph/0206293
24. T. Gleisberg et al., JHEP 0902, 007 (2009). Version 1.3.1 is used. arXiv:0811.4622
25. B. Kersevan, E. Richter-W¸as,
arXiv:hep-ph/0405247
26. T. Stelzer, W.F. Long, Comput. Phys. Commun. 81, 357 (1994). arXiv:hep-ph/9401258
27. G. Corcella et al., JHEP 0101, 010 (2001). arXiv:hep-ph/0011363
28. J. M. Butterworth et al., Z. Phys. C 72, 637 (1996). arXiv:hep-ph/9601371
29. J. Pumplin et al., JHEP 07, 012 (2002). arXiv:hep-ph/0201195
30. ATLAS Collaboration, ATL-PHYS-PUB-2010-014. https://cdsweb.cern.ch/record/1303025 31. T. Sj¨ostrand et al., JHEP 05, 026 (2006).
arXiv:hep-ph/0603175
32. ATLAS Collaboration,
ATLAS-CONF-2010-031. https://cdsweb.cern.ch/record/1277665 33. M. L. Mangano et al., JHEP 0701, 013 (2007).
arXiv:hep-ph/0611129
34. S. Catani et al., JHEP 0111, 063 (2001)
35. A. Sherstnev, R.S. Thorne, Eur. Phys. J. C 55, 553 (2008). arXiv:0711.2473
36. S. Agostinelli et al., Nucl. Instrum. Meth. A506, 250 (2003)
37. ATLAS Collaboration, Eur. Phys. J. C 70, 823 (2010). arXiv:1005.4568
38. S. Frixione et al., JHEP 07, 029 (2008).
arXiv:0805.3067
39. ATLAS Collaboration, Eur. Phys. J. C 72, 1909 (2012). arXiv:1110.3174
40. M. Cacciari, G.P. Salam, G. Soyez, JHEP 04, 063 (2008). arXiv:0802.1189
41. M. Cacciari, G.P. Salam, Phys. Lett. B641(1), 57 (2006). arXiv:hep-ph/0512210
42. ATLAS Collaboration, Submitted to Eur. Phys. J. C (2011). arXiv:1112.6426
43. ATLAS Collaboration,
ATLAS-CONF-2011-102. https://cdsweb.cern.ch/record/1369219 44. S. Moch, P. Uwer, Phys. Rev. D78, 034003 (2008).
arXiv:0804.1476
45. U. Langenfeld, S. Moch, P. Uwer,
arXiv:0907.2527
46. M. Beneke et al., Phys. Lett. B690, 483 (2010). arXiv:0911.5166
47. A. Denner et al., Phys. Rev. Lett. 106, 052001 (2011). arXiv:1012.3975
48. G. Bevilacqua et al., JHEP 1102, 083 (2011). arXiv:1012.4230
49. S. Dittmaier, P. Uwer, S. Weinzierl, Phys. Rev. Lett. 98, 262002 (2007). arXiv:hep-ph/0703120 50. S. Dittmaier, P. Uwer, S. Weinzierl, Eur. Phys. J.
C 59, 625 (2009). arXiv:0810.0452
51. K. Melnikov, M. Schulze, Nucl. Phys. B 840, 129 (2010). arXiv:1004.3284
52. G. Bevilacqua et al., Phys. Rev. Lett. 104, 162002 (2010). arXiv:1002.4009
53. G. Bevilacqua et al., Phys. Rev. D84, 114017 (2011). arXiv:1108.2851
54. K. Melnikov, A. Scharf, M. Schulze, Phys. Rev. D85, 054002 (2012). DOI 10.1103/PhysRevD.85. 054002. arXiv:1111.4991
The ATLAS Collaboration
G. Aad48, B. Abbott112, J. Abdallah11, S. Abdel Khalek116, A.A. Abdelalim49, A. Abdesselam119, O. Abdinov10, B. Abi113, M. Abolins89, O.S. AbouZeid159, H. Abramowicz154, H. Abreu137, E. Acerbi90a,90b,
B.S. Acharya165a,165b, L. Adamczyk37, D.L. Adams24, T.N. Addy56, J. Adelman177, M. Aderholz100, S. Adomeit99, P. Adragna76, T. Adye130, S. Aefsky22, J.A. Aguilar-Saavedra125b,a, M. Aharrouche82, S.P. Ahlen21, F. Ahles48, A. Ahmad149, M. Ahsan40, G. Aielli134a,134b, T. Akdogan18a, T.P.A. ˚Akesson80, G. Akimoto156, A.V. Akimov95, A. Akiyama67, M.S. Alam1, M.A. Alam77, J. Albert170, S. Albrand55, M. Aleksa29, I.N. Aleksandrov65, F. Alessandria90a, C. Alexa25a, G. Alexander154, G. Alexandre49,
T. Alexopoulos9, M. Alhroob165a,165c, M. Aliev15, G. Alimonti90a, J. Alison121, M. Aliyev10, B.M.M. Allbrooke17, P.P. Allport74, S.E. Allwood-Spiers53, J. Almond83, A. Aloisio103a,103b, R. Alon173, A. Alonso80,
B. Alvarez Gonzalez89, M.G. Alviggi103a,103b, K. Amako66, P. Amaral29, C. Amelung22, V.V. Ammosov129, A. Amorim125a,b, G. Amor´os168, N. Amram154, C. Anastopoulos29, L.S. Ancu16, N. Andari116, T. Andeen34, C.F. Anders20, G. Anders58a, K.J. Anderson30, A. Andreazza90a,90b, V. Andrei58a, M-L. Andrieux55,
X.S. Anduaga71, A. Angerami34, F. Anghinolfi29, A. Anisenkov108, N. Anjos125a, A. Annovi47, A. Antonaki8, M. Antonelli47, A. Antonov97, J. Antos145b, F. Anulli133a, S. Aoun84, L. Aperio Bella4, R. Apolle119,c,
G. Arabidze89, I. Aracena144, Y. Arai66, A.T.H. Arce44, S. Arfaoui149, J-F. Arguin14, E. Arik18a,∗, M. Arik18a, A.J. Armbruster88, O. Arnaez82, V. Arnal81, C. Arnault116, A. Artamonov96, G. Artoni133a,133b, D. Arutinov20, S. Asai156, R. Asfandiyarov174, S. Ask27, B. ˚Asman147a,147b, L. Asquith5, K. Assamagan24, A. Astbury170, B. Aubert4, E. Auge116, K. Augsten128, M. Aurousseau146a, G. Avolio164, R. Avramidou9, D. Axen169, C. Ay54, G. Azuelos94,d, Y. Azuma156, M.A. Baak29, G. Baccaglioni90a, C. Bacci135a,135b, A.M. Bach14, H. Bachacou137, K. Bachas29, M. Backes49, M. Backhaus20, E. Badescu25a, P. Bagnaia133a,133b, S. Bahinipati2, Y. Bai32a, D.C. Bailey159, T. Bain159, J.T. Baines130, O.K. Baker177, M.D. Baker24, S. Baker78, E. Banas38, P. Banerjee94, Sw. Banerjee174, D. Banfi29, A. Bangert151, V. Bansal170, H.S. Bansil17, L. Barak173, S.P. Baranov95,
A. Barashkou65, A. Barbaro Galtieri14, T. Barber48, E.L. Barberio87, D. Barberis50a,50b, M. Barbero20, D.Y. Bardin65, T. Barillari100, M. Barisonzi176, T. Barklow144, N. Barlow27, B.M. Barnett130, R.M. Barnett14, A. Baroncelli135a, G. Barone49, A.J. Barr119, F. Barreiro81, J. Barreiro Guimar˜aes da Costa57, P. Barrillon116, R. Bartoldus144, A.E. Barton72, V. Bartsch150, R.L. Bates53, L. Batkova145a, J.R. Batley27, A. Battaglia16, M. Battistin29, F. Bauer137, H.S. Bawa144,e, S. Beale99, T. Beau79, P.H. Beauchemin162, R. Beccherle50a, P. Bechtle20, H.P. Beck16, S. Becker99, M. Beckingham139, K.H. Becks176, A.J. Beddall18c, A. Beddall18c, S. Bedikian177, V.A. Bednyakov65, C.P. Bee84, M. Begel24, S. Behar Harpaz153, P.K. Behera63, M. Beimforde100, C. Belanger-Champagne86, P.J. Bell49, W.H. Bell49, G. Bella154, L. Bellagamba19a, F. Bellina29, M. Bellomo29, A. Belloni57, O. Beloborodova108,f, K. Belotskiy97, O. Beltramello29, O. Benary154, D. Benchekroun136a, M. Bendel82, K. Bendtz147a,147b, N. Benekos166, Y. Benhammou154, E. Benhar Noccioli49,
J.A. Benitez Garcia160b, D.P. Benjamin44, M. Benoit116, J.R. Bensinger22, K. Benslama131, S. Bentvelsen106, D. Berge29, E. Bergeaas Kuutmann41, N. Berger4, F. Berghaus170, E. Berglund106, J. Beringer14, P. Bernat78, R. Bernhard48, C. Bernius24, T. Berry77, C. Bertella84, A. Bertin19a,19b, F. Bertinelli29, F. Bertolucci123a,123b, M.I. Besana90a,90b, N. Besson137, S. Bethke100, W. Bhimji45, R.M. Bianchi29, M. Bianco73a,73b, O. Biebel99, S.P. Bieniek78, K. Bierwagen54, J. Biesiada14, M. Biglietti135a, H. Bilokon47, M. Bindi19a,19b, S. Binet116, A. Bingul18c, C. Bini133a,133b, C. Biscarat179, U. Bitenc48, K.M. Black21, R.E. Blair5, J.-B. Blanchard137, G. Blanchot29, T. Blazek145a, C. Blocker22, J. Blocki38, A. Blondel49, W. Blum82, U. Blumenschein54,
G.J. Bobbink106, V.B. Bobrovnikov108, S.S. Bocchetta80, A. Bocci44, C.R. Boddy119, M. Boehler41, J. Boek176, N. Boelaert35, J.A. Bogaerts29, A. Bogdanchikov108, A. Bogouch91,∗, C. Bohm147a, J. Bohm126, V. Boisvert77, T. Bold37, V. Boldea25a, N.M. Bolnet137, M. Bomben79, M. Bona76, V.G. Bondarenko97, M. Bondioli164, M. Boonekamp137, C.N. Booth140, S. Bordoni79, C. Borer16, A. Borisov129, G. Borissov72, I. Borjanovic12a, M. Borri83, S. Borroni88, V. Bortolotto135a,135b, K. Bos106, D. Boscherini19a, M. Bosman11, H. Boterenbrood106, D. Botterill130, J. Bouchami94, J. Boudreau124, E.V. Bouhova-Thacker72, D. Boumediene33, C. Bourdarios116, N. Bousson84, A. Boveia30, J. Boyd29, I.R. Boyko65, N.I. Bozhko129, I. Bozovic-Jelisavcic12b, J. Bracinik17, A. Braem29, P. Branchini135a, G.W. Brandenburg57, A. Brandt7, G. Brandt119, O. Brandt54, U. Bratzler157, B. Brau85, J.E. Brau115, H.M. Braun176, B. Brelier159, J. Bremer29, K. Brendlinger121, R. Brenner167,
S. Bressler173, D. Britton53, F.M. Brochu27, I. Brock20, R. Brock89, T.J. Brodbeck72, E. Brodet154, F. Broggi90a, C. Bromberg89, J. Bronner100, G. Brooijmans34, W.K. Brooks31b, G. Brown83, H. Brown7,
M. Bruschi19a, T. Buanes13, Q. Buat55, F. Bucci49, J. Buchanan119, N.J. Buchanan2, P. Buchholz142,
R.M. Buckingham119, A.G. Buckley45, S.I. Buda25a, I.A. Budagov65, B. Budick109, V. B¨uscher82, L. Bugge118, O. Bulekov97, A.C. Bundock74, M. Bunse42, T. Buran118, H. Burckhart29, S. Burdin74, T. Burgess13,
S. Burke130, E. Busato33, P. Bussey53, C.P. Buszello167, F. Butin29, B. Butler144, J.M. Butler21, C.M. Buttar53, J.M. Butterworth78, W. Buttinger27, S. Cabrera Urb´an168, D. Caforio19a,19b, O. Cakir3a, P. Calafiura14,
G. Calderini79, P. Calfayan99, R. Calkins107, L.P. Caloba23a, R. Caloi133a,133b, D. Calvet33, S. Calvet33, R. Camacho Toro33, P. Camarri134a,134b, M. Cambiaghi120a,120b, D. Cameron118, L.M. Caminada14, S. Campana29, M. Campanelli78, V. Canale103a,103b, F. Canelli30,g, A. Canepa160a, J. Cantero81,
L. Capasso103a,103b, M.D.M. Capeans Garrido29, I. Caprini25a, M. Caprini25a, D. Capriotti100, M. Capua36a,36b, R. Caputo82, R. Cardarelli134a, T. Carli29, G. Carlino103a, L. Carminati90a,90b, B. Caron86, S. Caron105, E. Carquin31b, G.D. Carrillo Montoya174, A.A. Carter76, J.R. Carter27, J. Carvalho125a,h, D. Casadei109, M.P. Casado11, M. Cascella123a,123b, C. Caso50a,50b,∗, A.M. Castaneda Hernandez174, E. Castaneda-Miranda174, V. Castillo Gimenez168, N.F. Castro125a, G. Cataldi73a, P. Catastini57, A. Catinaccio29, J.R. Catmore29, A. Cattai29, G. Cattani134a,134b, S. Caughron89, D. Cauz165a,165c, P. Cavalleri79, D. Cavalli90a,
M. Cavalli-Sforza11, V. Cavasinni123a,123b, F. Ceradini135a,135b, A.S. Cerqueira23b, A. Cerri29, L. Cerrito76, F. Cerutti47, S.A. Cetin18b, F. Cevenini103a,103b, A. Chafaq136a, D. Chakraborty107, I. Chalupkova127, K. Chan2, B. Chapleau86, J.D. Chapman27, J.W. Chapman88, E. Chareyre79, D.G. Charlton17, V. Chavda83,
C.A. Chavez Barajas29, S. Cheatham86, S. Chekanov5, S.V. Chekulaev160a, G.A. Chelkov65,
M.A. Chelstowska105, C. Chen64, H. Chen24, S. Chen32c, T. Chen32c, X. Chen174, S. Cheng32a, A. Cheplakov65, V.F. Chepurnov65, R. Cherkaoui El Moursli136e, V. Chernyatin24, E. Cheu6, S.L. Cheung159, L. Chevalier137, G. Chiefari103a,103b, L. Chikovani51a, J.T. Childers29, A. Chilingarov72, G. Chiodini73a, A.S. Chisholm17, R.T. Chislett78, M.V. Chizhov65, G. Choudalakis30, S. Chouridou138, I.A. Christidi78, A. Christov48, D. Chromek-Burckhart29, M.L. Chu152, J. Chudoba126, G. Ciapetti133a,133b, A.K. Ciftci3a, R. Ciftci3a, D. Cinca33, V. Cindro75, C. Ciocca19a, A. Ciocio14, M. Cirilli88, M. Citterio90a, M. Ciubancan25a, A. Clark49, P.J. Clark45, W. Cleland124, J.C. Clemens84, B. Clement55, C. Clement147a,147b, R.W. Clifft130, Y. Coadou84, M. Cobal165a,165c, A. Coccaro139, J. Cochran64, P. Coe119, J.G. Cogan144, J. Coggeshall166, E. Cogneras179, J. Colas4, A.P. Colijn106, N.J. Collins17, C. Collins-Tooth53, J. Collot55, G. Colon85, P. Conde Mui˜no125a, E. Coniavitis119, M.C. Conidi11, M. Consonni105, S.M. Consonni90a,90b, V. Consorti48, S. Constantinescu25a, C. Conta120a,120b, G. Conti57, F. Conventi103a,i, J. Cook29, M. Cooke14, B.D. Cooper78, A.M. Cooper-Sarkar119, K. Copic14, T. Cornelissen176, M. Corradi19a, F. Corriveau86,j, A. Cortes-Gonzalez166, G. Cortiana100,
G. Costa90a, M.J. Costa168, D. Costanzo140, T. Costin30, D. Cˆot´e29, L. Courneyea170, G. Cowan77, C. Cowden27, B.E. Cox83, K. Cranmer109, F. Crescioli123a,123b, M. Cristinziani20, G. Crosetti36a,36b, R. Crupi73a,73b,
S. Cr´ep´e-Renaudin55, C.-M. Cuciuc25a, C. Cuenca Almenar177, T. Cuhadar Donszelmann140, M. Curatolo47, C.J. Curtis17, C. Cuthbert151, P. Cwetanski61, H. Czirr142, P. Czodrowski43, Z. Czyczula177, S. D’Auria53, M. D’Onofrio74, A. D’Orazio133a,133b, P.V.M. Da Silva23a, C. Da Via83, W. Dabrowski37, A. Dafinca119,
T. Dai88, C. Dallapiccola85, M. Dam35, M. Dameri50a,50b, D.S. Damiani138, H.O. Danielsson29, D. Dannheim100, V. Dao49, G. Darbo50a, G.L. Darlea25b, W. Davey20, T. Davidek127, N. Davidson87, R. Davidson72,
E. Davies119,c, M. Davies94, A.R. Davison78, Y. Davygora58a, E. Dawe143, I. Dawson140, J.W. Dawson5,∗, R.K. Daya-Ishmukhametova22, K. De7, R. de Asmundis103a, S. De Castro19a,19b, P.E. De Castro Faria Salgado24, S. De Cecco79, J. de Graat99, N. De Groot105, P. de Jong106, C. De La Taille116, H. De la Torre81,
B. De Lotto165a,165c, L. de Mora72, L. De Nooij106, D. De Pedis133a, A. De Salvo133a, U. De Sanctis165a,165c, A. De Santo150, J.B. De Vivie De Regie116, G. De Zorzi133a,133b, S. Dean78, W.J. Dearnaley72, R. Debbe24, C. Debenedetti45, B. Dechenaux55, D.V. Dedovich65, J. Degenhardt121, C. Del Papa165a,165c, J. Del Peso81, T. Del Prete123a,123b, T. Delemontex55, M. Deliyergiyev75, A. Dell’Acqua29, L. Dell’Asta21, M. Della Pietra103a,i, D. della Volpe103a,103b, M. Delmastro4, N. Delruelle29, P.A. Delsart55, C. Deluca149, S. Demers177,
M. Demichev65, B. Demirkoz11,k, J. Deng164, S.P. Denisov129, D. Derendarz38, J.E. Derkaoui136d, F. Derue79, P. Dervan74, K. Desch20, E. Devetak149, P.O. Deviveiros106, A. Dewhurst130, B. DeWilde149, S. Dhaliwal159, R. Dhullipudi24,l, A. Di Ciaccio134a,134b, L. Di Ciaccio4, A. Di Girolamo29, B. Di Girolamo29,
S. Di Luise135a,135b, A. Di Mattia174, B. Di Micco29, R. Di Nardo47, A. Di Simone134a,134b, R. Di Sipio19a,19b, M.A. Diaz31a, F. Diblen18c, E.B. Diehl88, J. Dietrich41, T.A. Dietzsch58a, S. Diglio87, K. Dindar Yagci39, J. Dingfelder20, C. Dionisi133a,133b, P. Dita25a, S. Dita25a, F. Dittus29, F. Djama84, T. Djobava51b, M.A.B. do Vale23c, A. Do Valle Wemans125a, T.K.O. Doan4, M. Dobbs86, R. Dobinson29,∗, D. Dobos29, E. Dobson29,m, J. Dodd34, C. Doglioni49, T. Doherty53, Y. Doi66,∗, J. Dolejsi127, I. Dolenc75, Z. Dolezal127,