HAL Id: cirad-00664053
http://hal.cirad.fr/cirad-00664053
Submitted on 30 Jan 2012HAL is a multi-disciplinary open access archive for the deposit and dissemination of sci-entific research documents, whether they are pub-lished or not. The documents may come from teaching and research institutions in France or abroad, or from public or private research centers.
L’archive ouverte pluridisciplinaire HAL, est destinée au dépôt et à la diffusion de documents scientifiques de niveau recherche, publiés ou non, émanant des établissements d’enseignement et de recherche français ou étrangers, des laboratoires publics ou privés.
Improving harvest and planting monitoring for
smallholders with geospatial technology: the Reunion
Island experience
Valentine Lebourgeois, Agnes Begue, Pascal Degenne, Eric Bappel
To cite this version:
Valentine Lebourgeois, Agnes Begue, Pascal Degenne, Eric Bappel. Improving harvest and planting monitoring for smallholders with geospatial technology: the Reunion Island experience. International Sugar Journal, 2010, 109 (1298), pp.109-119. �cirad-00664053�
Improving harvest and planting monitoring for smallholders with
geospatial technology: the Reunion Island experience
By Valentine Lebourgeois1, Agnès Begue2, Pascal Degenne2and Eric Bappel2
1CIRAD, UPR Systèmes Canniers, Station de La Bretagne, BP 20, 97 408 St Denis, La Réunion, France
Phone : +33 2 62 52 80 26 Fax : +33 262 52 80 21 Email : valentine.lebourgeois@cirad.fr
2CIRAD, UMR TETIS, Maison de la Télédétection, 500 rue JF Breton, 34 093 Montpellier, France Phone : +33 4 67 54 87 54 Fax : +33 4 67 54 87 00
Email : agnes.begue@cirad.fr, pascal.degenne@cirad.fr, eric.bappel@teledetection.fr
ABSTRACT
With the recent development of geospatial technologies, remote sensing data are more and more integrated in the information systems of crop industries. The satellite’s ability to collect “snapshots” over large cropped areas at once makes it a unique tool able to acquire localized and objective data in real-time.
In this paper, we present how this technology can provide reliable information for sugarcane planting and harvest monitoring by updating information on field/blocks boundaries and cane status using time series of satellite images. Through the experience conducted on Reunion Island (Indian Ocean) where the sugar industry has difficulty collecting updated localized information on smallholders fields, we show how SPOT satellite images can be interpreted and processed in order to produce thematic maps and statistics. These maps can then be integrated in a Geographic Information System (GIS) designed for decision makers. This on-the-shelf GIS permits one to visualize maps and edit monthly statistics of the management practices in each production area.
Introduction
Sugarcane on Reunion Island
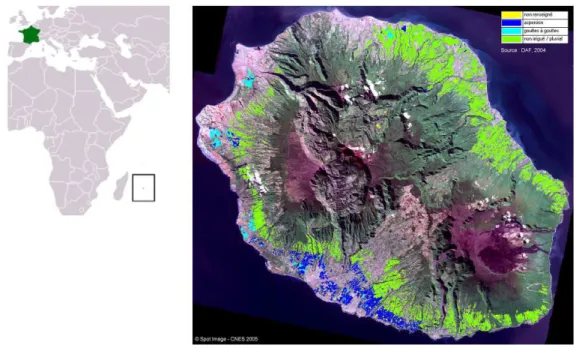
Reunion Island is an overseas department of France situated in the Southern Indian Ocean, about 700 km east of Madagascar. The island is mostly rugged and mountainous, with fertile lowlands along the coast cultivated mainly with sugarcane (60% of the cropped area). Sugarcane covers 26,000 hectares (Figure 1; Source: DDAF 2005), cultivated by 4,200 smallholder growers supplying two mills: Bois Rouge (Sucreries de Bois Rouge) and Le Gol (Sucrière de La Réunion). The harvest season is from July to December.
Figure 1 : a) Situation map of Reunion Island in the Indian Ocean (Source: Wikipedia); b) Sugarcane cropped area over Reunion Island: rainfed (green), irrigated (blue) (Source: DDAF 2004).
Needs of the sugarcane industry considering cane fields status
As for other regions in the world, where sugarcane is cultivated by smallholder growers, data on the extension of the cropped area and crop status are not always recorded and centralized, and the sugar industry has difficulty obtaining updated localized information on the cane fields/blocks boundaries and status. In Reunion, the yield and sugar content are measured when the cane is delivered to the mill and the name of the farmer is consigned. However, no information is given on the field provenance of the cane, making it impossible during harvest season to keep track of progress in terms of area harvested.
A collection of updated and extensive information on the cane fields/blocks over the whole area serviced by the mill may help to optimize the activities of the sugar industry. In addition to yield forecast, the principal need expressed by the industry is information on the harvest progress
throughout the harvesting season. This information could be used to improve efficiency in both factory and field, in particular through:
• a better estimation of the effective yield (via the ratio between the cumulative cane biomass delivered to the mill and the cumulative harvested cane area over the same period);
• a better assessment of the standing cane area still to be harvested, in order to optimize cutters deployment and transport operations (harvest rate of the different areas serviced by the mill);
• support to update information on the field boundaries and status in the mill/institution databases.
Another need expressed by the industry is information on the planted area. Maps of the planted fields, and the planting rate associated, can be a new source of information in a region where the planting rate is only based on farmer declarations for planting subsidies. This information could be used for:
• better knowledge of sugarcane management practices (plant rate, geographic disparities, …);
• estimating production of the coming harvest season (according to cropped area) and to plan corresponding transport operations.
Geospatial technology as a tool for real-time monitoring
With the recent development of geospatial technologies, many researchers have studied the potential of satellite images to capture information about large areas of cane at once. First used for crop area mapping (e.g. Narciso and Schmidt, 1999; Hadsarang and Sukmuang, 2000), the applications became more and more diversified and specialized due to continuous research efforts in the agricultural domain, but also to a larger technological offering in satellite services (Bégué et al., 2006). The use of remote sensing for cutting surveys is recent (Mc Donald and Routley, 2001; Gers and Schmidt, 2001; Bégué et al., 2004) and linked to the evolution of satellite solutions which are now able to provide a large number of high resolution image acquisitions during several consecutive months.
This paper presents the experience acquired on Reunion Island on geospatial technology applied to planting and harvest survey. The products and tools (methodology) presented here have been developped during the SUCRETTE1 research project (Ribbes et al., 2002), conducted by CIRAD (Centre de coopération Internationale en Recherche Agronomique pour le Développement) and Spot Image. This project explored the potentials of remote sensing and GIS technologies to provide geospatial products and tools for decision support in the sugarcane industry. The structure of an operational service derived from these developments is currently in discussion with the industry.
What information about vegetation status can remote sensing provide?
The optical properties of a sugarcane field
Most of the Earth observation satellites measure solar radiation reflected by the Earth’s surface. This radiation is measured separately in visible (generally blue, green and red), for normal colour photographs, and infrared IR (near and middle) spectral bands.
When radiation is intercepted by a vegetation canopy, different processes occur depending on the wavelength (mainly biochemistry of the leaves in the visible, structure of the canopy in the near infrared, and water content in the middle infrared). These specific interactions between vegetation and spectral radiation are the basis of remote sensing applied to vegetation monitoring as they permit to retrieve surface characteristics from the measurement of the reflectance in the different spectral bands. Figure 2 shows how the spectral reflectance of a cane field varies according to the crop status and conditions; for example, in the visible bands (red and green), because of radiation absorption by the leaf pigments, the reflectance of a vegetation canopy is lower than that of bare soil; in the near infrared, vegetation and bare soil have very different reflectances, while they are close in the middle infrared. At the opposite, the middle infrared band is important to separate residues from the other status.
Figure 2 : Mean and standard deviation of the spectral response of cane fields with different status: green standing cane (full vegetation cover), residues (harvested field) and bare soil (planted field). Given for SPOT satellite bands (IR stands for InfraRed).
The main current satellite sensors
Satellite imaging systems are mainly characterized by the spatial resolution (size of the pixels), the number and position of the spectral bands, the satellite revisit time, and the size of the image (foot print). The list of the main commercial satellite systems and their characteristics are given in Table 1. Product catalogue, image browser and prices can be found on the Companies’ web sites. Tasked
products delivered in a nominal map geometry are generally priced between 0.9 USD (20 m resolution) and 28 USD (0.65 m resolution) per km² for a minimum scene acquisition of 3,600 km² and 64 km² respectively, while archived products are priced between 0.01 USD (30 m resolution) and 17 USD (0.65 m resolution) per km² for a minimum order size of 32,400 km² and 25 km² respectively. High spatial resolution images (decametric resolution) can be used to monitor crop growth (seasonal monitoring), while very high spatial resolution images (metric resolution), which are more expensive and acquired on a smaller region, are suitable to map infrastructures or field boundaries (scales of 1:25,000 to 1:5,000).
Table 1: List and characteristics of the main current commercial Earth Observation satellites.
Production of thematic maps
This section presents the image processing techniques that permit transformation of a sequence of satellite images into harvest or plantation progress maps. In the SUCRETTE project, we used a time series of SPOT images (Table 1) at 20 m (SPOT4) and 10 m (SPOT5) spatial resolution; these images were geometrically (orthorectified) and radiometrically (reflectance values) corrected.
According to the scale at which the method is carried out (“block parcel” or “cane field”), two methodologies are proposed. In both cases, these methods result in maps of harvested and planted cane area, and evaluate harvest progress or planting rates.
http://edc.usgs.gov/products/sat ellite/landsat7.html http://glovis.usgs.gov/ 15 m SPOT http://www.spotimage.fr/ 20 m 10 m 5 m 2.5 m Formosat http://www.spotimage.fr/ 8 m 2 m Ikonos http://www.geoeye.com/ 4 m 1 m Quickbird http://www.digitalglobe.com/ 2.6 m 0.65 m Orbview http://www.geoeye.com/ 4 m
Blue, Green, Red, Near IR
Blue, Green, Red, Near IR
Blue, Green, Red, Near IR
Company Web Site (products, catalog browser, and image order)
Spatial resolution
Landsat7 30 m
12 bands between Blue and Near IR Spectral bands Blue, Green, Red, Near IR, Middle IR1, Middel IR2 Green,Red, Near IR, Middle IR
Cane status mapping at the block parcel scale
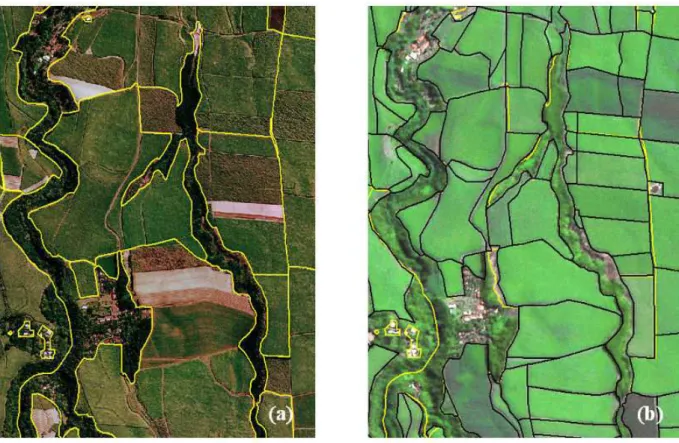
1. Mapping block parcel boundaries: In Reunion, since 2002, and in conformity with the Common Agricultural Policy (CAP) of the European Union, data concerning the extension and localization of sugarcane fields are recorded and updated each year by the Departmental Agriculture and Forestry Office (DDAF). Based on farmers’ declaration, block parcel boundaries are digitized on 0.5 m resolution aerial orthophotos (ORTHO® DB, IGN) that must be less than five years old (Figure 3a). For each block, such information as “grower’s number”, “irrigation mode” or “delivery zone” is given.
Figure 3 : Example of digitized cane cropped area based on very high resolution images: (a) 1997 aerial photo (ORTHO® DB) and block parcel boundaries (Source: DDAF, 2002); (b) SPOT5 image acquired on July 6, 2002 at 2.5 m resolution (Source: SUCRETTE /BD ISLE-Reunion) and field boundaries.
2. Block parcels classification (per pixel): We first use the cane block boundaries (step 1) to create a mask of the cane cropped area on the multispectral image (Figure 4a). We then perform unsupervised classifications of the multispectral image (green, red, near and middle infrared bands) using the ISODATA algorithm (ERDAS Imagine™ software). Through an iterative process, each pixel of the masked image is assigned, using minimum distance techniques, to one of the clusters initially determined by the algorithm. The number of clusters
to be discriminated is initiated by the user and set to 10. After the classification process, the ten clusters are grouped by photo-interpretation into more general classes, and are labelled (green standing cane, crop residues, bare soil and unclassified pixels) thanks to good knowledge of the crop cycle and spectral properties (Figure 2). Finally, these crop status classes are converted into farming operation classes - not harvested cane, harvested cane,
planted cane and unprocessed (Figure 4b).
3. Statistics: The harvest progress rate is calculated by aggregating the harvested and planted cane classes. This rate can be given at different scales (basin, delivery zone, block parcel) insofar as their digital geographic limits are available.
Figure 4: Example of harvest and planting mapping on a SPOT image acquired on August 19, 2004 with 10 m resolution (Source: SUCRETTE ISLE-Reunion):
a) False colour composition of a subset (Near IR/Red/Green), on which photosynthetic vegetation appears in red, cane residues in light blue and bare soil in dark blue.
b) Classified image of the cane cropped area, inside the block parcel limits in black (Source: DDAF). c) Classified cane fields in a GIS layer.
As far as the harvest season goes, difficulties in separating cane regrowth (harvested or planted cane) from green standing cane can occur. It is then recommended to classify a first image acquired at most three months after the mill opening date, and to use the resulting classification to mask the harvested and planted cane pixels before classifying the next image in the sequence (step 2). For smaller delays in image acquisition, the crop background, cane residues or bare soil is still dominant in the crop spectral response and there is no difficulty to accurately classify the cane status.
By grouping all the areas identified in the bare soil class during the planting period (from September to April), a map of ploughed areas can also be produced. If we make the hypothesis that all ploughed areas will be replanted with sugarcane during the next months, this map can be considered as that of replanted cane, from which a replanting rate can be calculated.
However, concerning planting map production, the use of a block parcel map is limited by the presence of tracks surrounding most of the fields. In fact, those tracks have the same spectral response as the bare soil resulting in errors on the planting rate. Therefore, to produce the planting map, a digitized field map is more appropriate.
Cane status mapping at the cane field scale
We saw previously the limitations of using a block parcel map to obtain reliable area statistics on the cane status. Furthermore, cane status is not homogeneous within the block parcels (different farming operation dates) resulting in difficulties to calculate field indicators to support crop management decisions. To overcome these limitations, we created a classification based on a cane field mask derived from very high spatial resolution images (metric our sub-metric resolution).
1. Mapping the cane field boundaries: We used a SPOT5 image at 2.5 m resolution to draw the individual field boundaries by visual interpretation (Figure 3b). This technical solution is less accurate than the use of aerial photo at the field scale (respectively ± 2.8% and ± 0.5%, calculated on an hypothetical square field having an area equal to the Reunion mean cane field area), but it guarantees an annual update, compared to the five years update resulting from aerial photo survey on Reunion Island. A yearly update is necessary for a crop with a high rotation rate like sugarcane, in particular in a region with high land use dynamic.
2. Classification per field: In this case, we used the cane field boundaries to create a mask before the multispectral classification. In order to eliminate mixed border pixels, a 10 m or 20 m buffer (for SPOT5 and SPOT4 respectively) was created around each field polygon. The buffers were subtracted from the original edge of the field polygon to create the mask.
Then, as previously, we proceeded with the classification of the pixels inside the mask. On the classified image, the number of pixels belonging to each class (green standing cane, crop
residues, bare soil and unclassified pixels) is counted for each field (polygon) resulting in a
harvest or planting rate at the field scale. According to rate thresholds, each field can be finally classified into four farming operation classes: not harvested, harvested, harvest in progress,
planted cane and unprocessed (Figure 4c).
This more flexible method has the advantage of allowing the creation of new classes and can be adapted more easily to the needs expressed by the end user. Furthermore, the results can be provided in vector format and directly integrated in any GIS.
3. Statistics: Harvest maps and statistics can be generated about one week after image acquisition. If one considers that fields in which cutting has begun are generally completely harvested during the following week, those fields can be counted as harvested, and the statistical results are closer to the reality of the harvest progress one week after the image acquisition.
At the end of the planting period, by grouping together all the planted fields monthly identified, a planting map can also be produced. However, a field-based approach (vector map) is not the most appropriate to represent planted areas as a planting operation is often an opportunity for the farmer to reorganise the distribution of the fields in his own land. In that case, a raster (image) map of planted cane seems to be more appropriate (Figure 4b).
Validation and limits
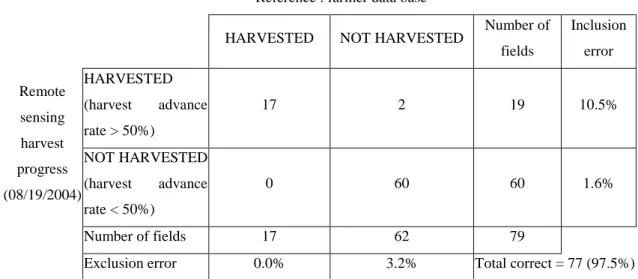
Regarding harvest monitoring, results obtained from the classification of three SPOT images acquired during the harvest season have been compared to a database of a sugar farm composed of 81 fields situated in the North-East of the Island. In this database, harvest dates correspond approximately to the middle of field cutting period. Therefore, in our classification, fields with a harvest progress rate higher than 50% were classified in the harvested class, and the other fields in the not harvested class. According to the error matrix (Table 2), the overall accuracy of the classification reaches 96.5 % of well classified fields on the image acquired 2 months after the harvest start (August 19, 2004). This percentage is quite constant throughout the harvest season, with 93.8% and 95.1% of well classified fields calculated from September 11 and October 26 images, respectively. In most cases, the errors correspond to the fields that were classified as harvest in progress.
When applied to the entire cane cropped area, it may happen that the unclassified class is not negligible due to a high presence of clouds. In that case, the harvest and planting rates will be
calculated on a sample area (Figure 5). Another classification limit occurred when the delay between two cloud-free images is too large, resulting in errors when distinguishing standing crop from cane regrowth of fields harvested previously in the season. This delay can be estimated at 3 months during the winter when cane growth is slow (at the beginning of the harvest season), and at 2 months during the summer when cane growth is rapid (at the end of the harvest season). In some cloudy regions, we recommend a frequency of the image acquisition higher than these delays in order to reduce the delay between cloud-free data acquisition over the cane-cropped area.
In order to improve classification results and in order to be able to map real planted cane (and not ploughed field), current research at CIRAD is focusing on the development of a classification driven by expert systems and crop growth modelling.
Reference : farmer data base
HARVESTED NOT HARVESTED Number of
fields Inclusion error HARVESTED (harvest advance rate > 50%) 17 2 19 10.5% Remote sensing harvest progress (08/19/2004) NOT HARVESTED (harvest advance rate < 50%) 0 60 60 1.6% Number of fields 17 62 79
Exclusion error 0.0% 3.2% Total correct = 77 (97.5%)
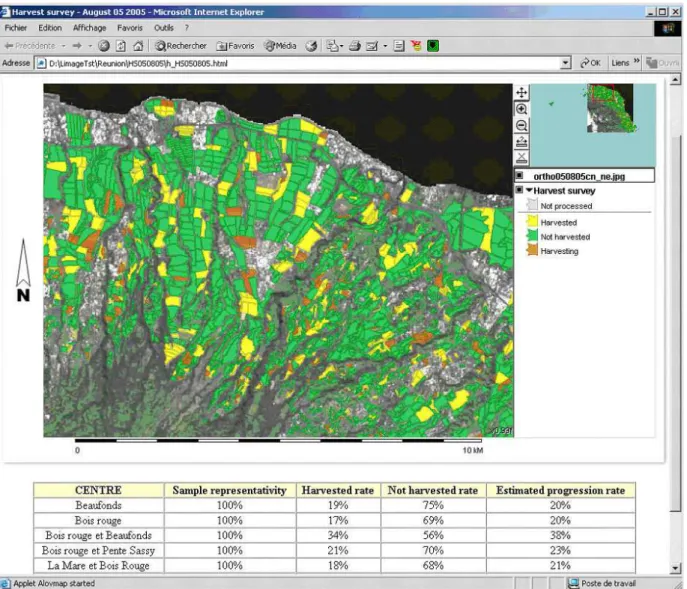
Figure 5 : Example of a printed crop situation bulletin. Note that when the proportion of sample area is low, the harvest statistics are not provided because they are not reliable enough (Source : SUCRETTE/CIRAD).
Distributing Cartographic Results to the Sugar Cane Industry
One objective of the SUCRETTE project was to study appropriate methods for distributing the thematic maps and statistical results to the members of the sugar cane industry. The analysis of needs and requirements of the industry in that domain revealed a wide diversity of situations and technical backgrounds. We have tried to imagine solutions taking advantage of recent developments in web mapping techniques, that can adapt to that diversity of situations and constraints, and that can be used and understood with as little training as possible.
Printed bulletin
One convenient way to distribute cartographic maps is on printed-paper. It has the advantage of simplicity and in some cases there is no alternative. Successful trials resulted in distributing a crop situation report. This report included a cartographic map and the associated statistics on a single sheet of paper (Figure 5).
Light interactive maps on a web page
Installing a geographic information system (GIS) on a user’s desktop offers flexibility and interactivity to the user. Such a system enables one to manipulate and compare several thematic layers on a map, thus improving the capacity for interpretation. However the cost of the software and training are often too high to be considered acceptable by industry members. Therefore, we explored an intermediate solution (between printed paper and full GIS software). This proposition takes advantage of recent important advances in cartographic mapping technologies developed for the World Wide Web. This application is both easy to install and easy to use while still offering an excellent level of interactivity. Furthermore the same publishing technique can be used when a connection to the internet is available, and when is it not.
The results of remote sensing analysis are presented in a single web page (Figure 6) that contains an interactive map and, when necessary, a table displaying different statistical variables and results associated with the sugar cane parcels (or groups of parcels). It can be viewed by any web browser software (such as Internet Explorer, Netscape, Firefox, Opera, ..) without the need for installing GIS software.
The light mapping program that we chose to embed in the web page is a Java applet named AlovMap (Johnson, 2006). It offers very good interactive features, such as turning on and off different layers, zoom, pan, and object selection by query. It can be highly customized and controlled using Javascript commands, which is a real asset for adapting map layout, content, and behaviour to the different needs among members of the sugar cane industry.
Figure 6 : Interactive map in a web page (Source: SUCRETTE/CIRAD).
Generating the “light maps”
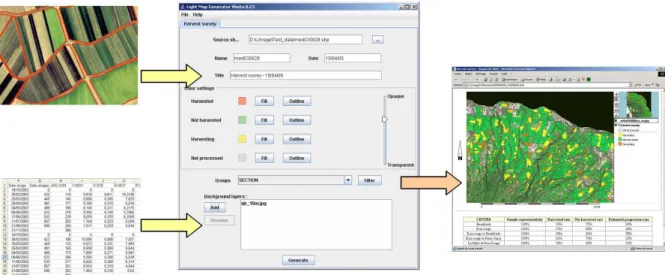
To help a GIS technician of the sugar industry produce such kinds of “light maps”, we developed a prototype software named “Limage” (for LIght MAp GEnerator) that takes the statistical results of remote sensing analysis for input and generates a web page with an interactive mapping applet embedded (Figure 7). Thanks to that tool, it is possible to produce the mapping web pages without being an expert of all the underlying techniques involved in the process.
Limage was designed in such a way that all the files required for viewing a map in a web page are generated inside a unique destination directory. It means that the result is a standalone set of files that can be copied (using a USB key for example) and used locally on a desktop computer, or that can be uploaded on a web server and viewed by numerous final users through the internet.
Figure 7 : The “Light Map Generator” helps a GIS technician producing interactive maps embedded in a web page (Source: SUCRETTE/CIRAD).
Conclusions
For small-scale farming systems, information at the field or farm scales is difficult to get because data collection is often a long and non-exhaustive process based on heterogeneous declarative data. Remote sensing can therefore be an exhaustive and objective source of information in near real-time.
In Reunion, we made the demonstration of the technical feasibility and relevance of the use of satellite images and tailored GIS tools to update yearly the sugarcane field boundaries, and to monitor the harvest progress and planting. The operational use of satellite image in the sugar industry is currently being discussed with the agriculture administration and the technical services and sugar factories of the island.
Acknowledgments
o The results presented here are issued from the SUCRETTE project, funded by the French Ministry of Research through the Earth and Space Program (RTE), and from other research activities supported by the Region REUNION;
o Special thanks for the CNES (Centre National d’Etudes Spatiales), in particular to Hélène De Boissezon, for the access to the ISLE-REUNION data base which is a satellite images reference database developed by CNES for scientific studies.
References
Bappel, E., Bégué, A., Degenne, P., Lebourgeois, V.,Siegmund, B., 2005. Real time sugarcane harvest monitoring using SPOT4&5 satellite data. Proc. International Society of Sugar Cane Technologists (ISSCT), GUATEMALA, 30 Jan. - 4 Feb., 25, 383-386.
Bégué, A., Degenne, P., Pellegrino, A., Todoroff, P.,Baillarin, F., 2004. Application of remote sensing technology to monitor sugar cane cutting and planting in Guadeloupe (French West Indies). Proc. GEOMATICA, La Habana (CUBA), 10-14th May, 11 p.
Bégué, A., Bappel, E., Degenne, P., Lebourgeois, V., Todoroff, P.,Pellegrino, A., 2006. Review of the current and potential remote sensing applications for the sugarcane industry. Field Crop Res
(submitted).
Gers, C.,Schmidt, E., 2001. Using SPOT4 satellite imagery to monitor area harvested by small scale sugarcane farmers at Umfolozi. Proc. 75th South African Sugar Technologists' Association (SASTA), 31 Jul. - 3 Aug., 28-33.
Hadsarang, W.,Sukmuang, S., 2000. Utilization of Landsat-5 (TM) imagery for sugarcane area survey and mapping in Thailand. Proc. Asian Conference on Remote Sensing (ACRS), Taipei (Taiwan), 4-8 Dec.
Johnson I., 2006. AlovMap. Archaeological Computing Laboratory, University of Sydney NSW, Australia (http://www.alov.org).
Mc Donald, L.,Routley, S., 2001. Landsat TM imagery and GIS can be used to detect harvested and fallow cane blocks in the Herbert. In: Keating, B.A.,Lawes, R.A. (Eds.). Application of productivity data within the Australian sugar industry. CRC Sugar, Townsville (Australia), 12-19.
Narciso, G.,Schmidt, E.J., 1999. Identification and classification of sugarcane based on satellite remote sensing. Proc. 73rd South African Sugar Technologists' Association (SASTA), 189-194. Ribbes, F., Bégué, A., Siegmund, B., Todoroff, P.,Autrey, L.J.C., 2002. Potentialités de la télédétection satellitaire pour la filière canne à sucre (Projet SUCRETTE). Proc. Perspectives de développement de la canne à sucre en milieu insulaire : approches technico-économiques, sociales et culturelles, St Leu, La Réunion (FR), 2-5 Octobre, 10 p.