HAL Id: hal-00301137
https://hal.archives-ouvertes.fr/hal-00301137
Submitted on 3 Jul 2003HAL is a multi-disciplinary open access
archive for the deposit and dissemination of sci-entific research documents, whether they are pub-lished or not. The documents may come from teaching and research institutions in France or abroad, or from public or private research centers.
L’archive ouverte pluridisciplinaire HAL, est destinée au dépôt et à la diffusion de documents scientifiques de niveau recherche, publiés ou non, émanant des établissements d’enseignement et de recherche français ou étrangers, des laboratoires publics ou privés.
Weekly cycle of NO2 by GOME measurements: A
signature of anthropogenic sources
S. Beirle, U. Platt, M. Wenig, T. Wagner
To cite this version:
S. Beirle, U. Platt, M. Wenig, T. Wagner. Weekly cycle of NO2 by GOME measurements: A signature of anthropogenic sources. Atmospheric Chemistry and Physics Discussions, European Geosciences Union, 2003, 3 (4), pp.3451-3467. �hal-00301137�
ACPD
3, 3451–3467, 2003 Weekly cycle of NO2 by GOME measurements S. Beirle et al. Title Page Abstract Introduction Conclusions References Tables Figures J I J I Back CloseFull Screen / Esc
Print Version Interactive Discussion
© EGU 2003 Atmos. Chem. Phys. Discuss., 3, 3451–3467, 2003
www.atmos-chem-phys.org/acpd/3/3451/ © European Geosciences Union 2003
Atmospheric Chemistry and Physics Discussions
Weekly cycle of NO
2
by GOME
measurements: A signature of
anthropogenic sources
S. Beirle1, U. Platt1, M. Wenig2, and T. Wagner1 1
Institut f ¨ur Umweltphysik, Universit ¨at Heidelberg, Germany
2
NASA Goddard Space Flight Center, Greenbelt, MD 20771, USA
Received: 23 May 2003 – Accepted: 26 June 2003 – Published: 3 July 2003 Correspondence to: S. Beirle (beirle@iup.uni-heidelberg.de)
ACPD
3, 3451–3467, 2003 Weekly cycle of NO2 by GOME measurements S. Beirle et al. Title Page Abstract Introduction Conclusions References Tables Figures J I J I Back CloseFull Screen / Esc
Print Version Interactive Discussion
© EGU 2003
Abstract
Nitrogen oxides (NO+NO2=NOx) are important trace gases in the troposphere with impact on human health, atmospheric chemistry and climate. Besides natural sources (lightning, soil emissions) and biomass burning, fossil fuel combustion is estimated to be responsible for about 50% of the total production of NOx. Since human activity in 5
industrialized countries largely follows an artificial seven-day cycle, fossil fuel combus-tion is expected to be reduced during weekends. This ”weekend effect” is well known from local, ground based measurements, but has never been analysed on a global scale before.
The Global Ozone Monitoring Experiment (GOME) on board the ESA-satellite ERS-10
2 allows measurements of NO2 column densities. Applying sophisticated algorithms, vertical column densities (VCD) of tropospheric NO2can be determined. We demon-strate the statistical analysis of weekly cycles of tropospheric NO2 VCDs for different regions of the world. In the cycles of the industrialized regions and cities in the US, Europe and Japan a clear Sunday minimum of tropospheric NO2 VCD can be seen. 15
Sunday NO2VCDs are about 25–50% lower than working day levels. Metropolitan ar-eas with other religious and cultural backgrounds (Jerusalem, Mecca) show different weekly patterns corresponding to different days of rest. In China, no weekly pattern can be found.
The presence of a weekly cycle in the measured tropospheric NO2 VCD allows the 20
identification of anthropogenic sources. In addition, the fraction of emissions subjected to a weekly cycle (mainly transport, power generation) with respect to a constant back-ground (all kind of natural sources, biomass burning, heavy industry) can be estimated. Furthermore, we estimated the lifetime of tropospheric NO2 by analysing the mean weekly cycle over Germany in detail, obtaining a value of about 12 h.
ACPD
3, 3451–3467, 2003 Weekly cycle of NO2 by GOME measurements S. Beirle et al. Title Page Abstract Introduction Conclusions References Tables Figures J I J I Back CloseFull Screen / Esc
Print Version Interactive Discussion
© EGU 2003
1. Introduction
Over the last 150 years, the atmospheric composition has changed dramatically due to the industrial revolution. Among the various emitted pollutants nitrogen oxides (NO+NO2=NOx) play an important role. In the troposphere they have a large im-pact on human health, climate and atmospheric chemistry, e.g. due to the role they 5
play in ozone production (Atkinson, 2000) and their influence on the OH concentration (“oxidizing power”, Jacob, 2003). The estimation of the strengths of the different NOx sources (industry, biomass burning, aircraft, soil emissions, lightning) still has high un-certainties (Lee et al., 1997). Nevertheless, NOxby fossil fuel combustion is estimated to account for more than 50% of the overall production.
10
Industrial activity and traffic in western countries are reduced during weekends lead-ing to lower levels of emitted pollutants (“Weekend effect”; Cleveland et al., 1974; Elkus and Wilson, 1977; Cerveny and Coakley, 2002). Compared to working day levels the weekend emissions of NOx, e.g. in Germany, are reduced by approximately 35% (Wick-ert, 2001). The degree of reduction of industrial activity and traffic may differ from coun-15
try to country and even from region to region, but a Sunday minimum of NOxemissions is expected at least for countries with a Christian tradition, celebrating Sunday as the day of rest.
Satellite measurements allow a new and independent approach to the determination of trace gas emissions. The entire globe is monitored with a single instrument under 20
the same conditions and over long periods of time. The Global Ozone Monitoring Ex-periment GOME on board the ESA satellite ERS-2 provides data to determine vertical column densities (VCDs) of NO2(Wagner, 1999; Leue et al., 2001). By subtracting the estimated stratospheric fraction, tropospheric VCDs of NO2are retrieved (Leue et al., 2001; Velders et al., 2001; Wenig et al., 2001). Since the lifetime of tropospheric NO2 25
is of the order of one day (Leue et al., 2001), enhanced VCDs directly indicate nearby sources of NOx.
ACPD
3, 3451–3467, 2003 Weekly cycle of NO2 by GOME measurements S. Beirle et al. Title Page Abstract Introduction Conclusions References Tables Figures J I J I Back CloseFull Screen / Esc
Print Version Interactive Discussion
© EGU 2003 al., 2001). Furthermore, the spatial resolution of one GOME ground pixel (320×40 km2)
is rather coarse compared to the extent of individual cities. In spite of these uncertain-ties of individual VCD measurements, the statistical analysis of long time series of GOME data provides reliable information, for instance on the mean tropospheric NO2 distribution and features of its weekly cycle.
5
2. Retrieval of tropospheric NO2vertical column densities from GOME
In April 1995, the ERS-2 satellite was launched by the European Space Agency, carry-ing (in addition to other instruments) the Global Ozone Monitorcarry-ing Experiment (GOME) (Burrows et al., 1999). The satellite operates at an altitude of about 780 km. It flies along a sun- synchronous polar orbit and crosses the equator at 10:30 (local time). 10
GOME consists of four spectrometers measuring the radiation reflected by the earth in the UV/vis spectral range with a resolution of about 0.2–0.4 nm. Global coverage is achieved every three days. The primary objective of GOME is the retrieval of Ozone column densities, but beyond this the column densities of several trace gases can be determined by applying Differential Optical Absorption Spectroscopy (DOAS) (Platt, 15
1994). The retrieval of vertical column densities (VCDs) of NO2 is described in detail by Wagner (1999), Leue et al. (2001) and Wenig (2001).
Since the global distribution of stratospheric NO2 is much more homogeneous and less time dependent than it is in the troposphere, it is possible to estimate the strato-spheric fraction of the total column (Leue et al., 2001; Velders et al., 2001; Wenig, 20
2001). For this study, the stratospheric column was determined in a reference sector over the remote Pacific (Richter and Burrows, 2002). The difference between the total and the stratospheric column represents the tropospheric fraction. For a quantitative analysis the tropospheric vertical column density has to be corrected for effects of radi-ation transport in the troposphere. The absolute value of the correction factor depends 25
on surface albedo, trace gas profile and especially the cloud cover (Richter and Bur-rows, 2002; Martin et al., 2002). In this study, we apply a uniform correction factor of
ACPD
3, 3451–3467, 2003 Weekly cycle of NO2 by GOME measurements S. Beirle et al. Title Page Abstract Introduction Conclusions References Tables Figures J I J I Back CloseFull Screen / Esc
Print Version Interactive Discussion
© EGU 2003 4 (Velders et al., 2001) to keep the analysis as simple as possible. We focus on the
relations of mean VCDs of different days of the week, i.e. normalized weekly cycles, which should be independent of the correction factor.
The coverage of one GOME pixel is about 40 km north-south by 320 km east-west. This complicates the monitoring of individual cities: the total area of pixels containing 5
a specific location is 80 × 640 km2(since the city center may be situated in the upper right corner of the GOME pixel as well as in the lower left corner), implying possible interferences with other sources.
The flight track of the ERS-2 satellite has a periodicity of 35 days. That means, that every 35 days the GOME ground pixel coordinates are identical. This circumstance 10
may influence the analysis of weekly cycles, since 35 is a multiple of 7. Hence each day of the week is scanned with a different spatial sampling. This implies that, by monitoring a certain location, the influence of neighbouring regions differs from day to day. This effect is in general of minor importance, but may cause artefacts in the weekly cycle of tropospheric NO2VCD in a few cases (see below).
15
The retrieval of tropospheric information from satellite data can be strongly affected by clouds: an enhanced cloud cover might “shield” the troposphere and lead to a re-duced observed VCD. In principle, there could even be a systematic weekly cycle of cloud cover. In fact, Cerveny and Balling Jr (1998) report a weekly cycle of precipita-tion. To check a possible weekly cycle of cloud cover we use the Heidelberg Iterative 20
Cloud Retrieval Utilities (HICRU), recently presented by Grzegorski (2003). HICRU contains an improved algorithm that retrieves cloud covers using the GOME Polar-ization Monitoring Devices (PMD), which are broad band spectrometers with a better spatial resolution. Therefore, cloud cover information at the same time and place as for the NO2retrieval is obtained.
25
By analysing the weekly cycle of the HICRU cloud cover data we found no indication for a weekly pattern of enhanced cloud cover on Sundays. In the case of Germany, for instance, the cloud cover ranges from 43% (Tuesday) to 48% (Friday) with a Sunday value of 46% (mean of 1996–2001).
ACPD
3, 3451–3467, 2003 Weekly cycle of NO2 by GOME measurements S. Beirle et al. Title Page Abstract Introduction Conclusions References Tables Figures J I J I Back CloseFull Screen / Esc
Print Version Interactive Discussion
© EGU 2003 The GOME measurements currently span more than 7 years, providing a large
amount of data for statistical evaluation. Figure 1 shows the mean global distribu-tion of tropospheric NO2 VCDs for 1996–2001. Regions with high industrial activity and even individual metropolises, e.g. Mexico City, can clearly be seen. In this study, we focus on four regions of the world with enhanced NO2VCD values: 1. the eastern 5
USA, 2. western Central Europe, 3. East Asia and 4. the Middle East, as well as 5. some individual cities, as marked in Fig. 1.
3. Weekly cycle of tropospheric NO2VCD
The weekly cycle of tropospheric NO2VCD is visualized in two ways. Figure 2 shows maps of the tropospheric NO2VCD for the regions under consideration for the different 10
days of the week (mean over 1996–2001). This provides information about the absolute source strength in the different regions. The effect of the 35 day periodicity of GOME is reflected by the stripe-like structures parallel to the ERS-2 flight direction.
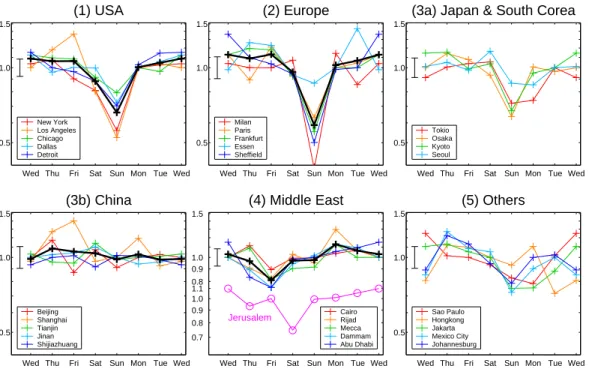
In addition, Fig. 3 shows plots of weekly cycles for some selected cities. The values are normalized to the median weekly value for better comparison. The focus of this 15
plot is the relative reduction of the tropospheric NO2VCD during the day of rest. Both figures show the same general features: the level of NO2 VCD is similar for the different working days, but there is a significant reduction of tropospheric NO2VCD during the weekend, especially on Sunday, for the US (1), Europe (2), and Japan (3a). In all cities considered in these regions, there is a minimum on Sunday. The NO2VCD 20
is reduced by about 25–50% and even 60% (Milan (2)). A Sunday minimum can also be seen in Johannesburg and Mexico City (5).
In China (3b), no indications for a weekly cycle can be found in Figs. 2 or 3. China has a different economic, cultural, and religious background. Nevertheless, there also is a seven day week and a work free weekend. The absence of a weekend effect in 25
our data probably indicates that the Chinese NOx emissions are dominated by power plants and heavy industry, operating throughout the week. On the other hand, in the
ACPD
3, 3451–3467, 2003 Weekly cycle of NO2 by GOME measurements S. Beirle et al. Title Page Abstract Introduction Conclusions References Tables Figures J I J I Back CloseFull Screen / Esc
Print Version Interactive Discussion
© EGU 2003 US and in Europe individual transport appears to contribute significantly to the NOx
sources.
The cities in the Middle East (4) show a shifted weekly cycle due to different religious traditions, i.e. other days of rest. In Israel, Saturday (Sabbath) is the day of lowest NO2 VCD. In Islamic cities, there is a slight weekly effect with lowest emissions on Friday. 5
Besides the noticeable minimum on Sunday, there are two more days of interest in the weekly cycles of the western cities: a) Saturday, since it is also a working free day for most professions in western countries (reduced industrial activity), but a pre-ferred day for shopping or short trips (possible increase of individual transport), and b) Monday, since it starts with relatively clean air, whereas for the other working days 10
the measured air masses might be influenced by the pollution of the day before, as the lifetime of NO2in the troposphere is about one day.
a) Saturday NO2values are slightly reduced in most western cities. But in some places they are quite high, reaching normal working day levels (e.g. Milan, Dallas, Tokyo). b) Monday values in the US and Europe are almost on working day level, whereas 15
there are uncommonly low levels in Tokyo and Seoul (3a) as well as in Sao Paulo and Jakarta (5).
To understand these features in the weekly cycle in detail, further information about local emissions, wind force and direction, and lifetime of NO2 is necessary. Another aspect is the daily cycle of emissions, especially the starting time of work in the morning 20
which differs from region to region, whereas the local observation time of GOME is the same.
The 35 day periodicity of the ERS-2 satellite flight track should be, in general, of minor influence. However, it is thought to be the most probable reason for some un-usually high values, e.g. the Tuesday values in Essen or the high Wednesday val-25
ues in Sheffield (Fig. 3(2)). For instance, in the Tuesday scans, the polluted regions of West Germany (Ruhr area) and the Netherlands are largely covered by a single track of GOME pixels, whereas there are two neighbouring tracks on Wednesdays (see Fig. 2(2)). This leads to a higher observed NO2VCD on Tuesdays compared to
ACPD
3, 3451–3467, 2003 Weekly cycle of NO2 by GOME measurements S. Beirle et al. Title Page Abstract Introduction Conclusions References Tables Figures J I J I Back CloseFull Screen / Esc
Print Version Interactive Discussion
© EGU 2003 Wednesdays.
The presence of a weekly cycle underlines the significance of estimates of tropo-spheric NO2 VCD. The existence of a weekly cycle can serve as an indicator (but not necessarily, see China) for anthropogenic sources.
4. Lifetime estimation
5
Since the tropospheric lifetime of NO2is of the order of one day, the low Sunday emis-sions should have an influence on the VCD measured on Monday in the area downwind from the source regions. This is analysed in detail for Germany, i.e. the area 7◦–14◦E and 48◦–54◦N (Fig. 4). Since the main source regions are located in the western part of Germany and the mean wind direction is eastwards, the emitted pollutants remain 10
within the area for at least one day. (A mean wind velocity of approx. 5 m/s corresponds to a daily transport of 432 km, whereas the east-west extension of Germany is about 700 km.)
Therefore the lifetime of NO2in the troposphere can be roughly estimated. We have based our analysis on some simple assumptions:
15
1. There is a constant NOxemission during daytime (12 h), while there are no emis-sions at night. Saturday emisemis-sions are 66%, Sunday emisemis-sions 60% of working day level (adopted from Wickert, 2001), see Fig. 5a.
2. The loss of NO2due to photochemical processes is assumed to be an exponential drop with a constant lifetime τ.
20
3. There is no loss due to wind transport of NO2out of the considered area. Therefore, the change of the NO2VCD can be described as
d(VCDNO
ACPD
3, 3451–3467, 2003 Weekly cycle of NO2 by GOME measurements S. Beirle et al. Title Page Abstract Introduction Conclusions References Tables Figures J I J I Back CloseFull Screen / Esc
Print Version Interactive Discussion
© EGU 2003 E(t): Emissions (in units of molecules cm−2s−1).
This differential equation was solved numerically. Figure 5b shows the retrieved mean German NO2VCD at the ERS-2 overpass time for different lifetimes τ. This is compared to the actual measurements of GOME in Fig. 5c.
5
The Sunday reduction is underestimated in the modelled weekly cycle. This might indicate that the reduction of weekend emissions is actually more extensive than as-sumed. In any case, the detailed temporal pattern of the weekly cycle of the modelled VCD crucially depends on the assumed lifetime. A lifetime of 6 h and shorter leads to a weekly cycle similar to that of the emissions, i.e. the Saturday values are almost as 10
low as Sunday values and Monday values are similar to those of the other workdays. On the other hand, a lifetime of 18 h leads to Monday values much lower than Saturday values, which could not be observed (see Fig. 5).
For this study, a lifetime of tropospheric NO2 of about 12 h fits best. This may be different for other regions and has different effects on the weekly cycle, i.e. the Saturday 15
and Monday values.
5. Conclusions
The existence of a weekly cycle is an obvious signature of anthropogenic sources. In most western industrialised areas a clear weekly cycle with a noticeable Sunday minimum can be found in tropospheric NO2 VCD from GOME, underlining the power 20
of tropospheric trace gas measurements from space. Regions with a different religious background show a shifted weekly cycle with minimum NO2VCD on Saturday (Israel) or Friday (Islamic cities). In China, no weekly cycle of tropospheric NO2could be found. The low level of the Sunday minimum in the western cities provides information about the fraction of periodic anthropogenic sources of NOx. This helps to discriminate man-25
made from natural sources (lightning, biomass burning, soil emissions) and assess the contribution of local traffic to the NOxsources.
ACPD
3, 3451–3467, 2003 Weekly cycle of NO2 by GOME measurements S. Beirle et al. Title Page Abstract Introduction Conclusions References Tables Figures J I J I Back CloseFull Screen / Esc
Print Version Interactive Discussion
© EGU 2003 Furthermore, the characteristics of the weekly cycle, i.e. the ratio of the Monday
values and Sunday minima, allow to deduce the lifetime of tropospheric NO2.
The usability of these methods requires background information about the consid-ered regions. Weekly patterns of emissions, the predominant source of NOx (traffic, heavy industry or heating) and the lifetime of tropospheric NO2differ for different levels 5
of industrialisation, religious and cultural customs and meteorological conditions. Fur-ther information can be gaFur-thered by analysing the weekly cycle of summer and winter data separately, since the role of traffic compared to heating should be different for both cases.
The statistical errors of the data points in Fig. 3 are quite small due to the large 10
amount of data. Systematical errors due to the large spatial extent of the GOME pix-els, as described in Sect. 2, have to be borne in mind. A better spatial resolution (nominal 30 × 60 km2) will be provided by the SCanning Imaging Absorption Spec-troMeter for Atmospheric CHartographY (SCIAMACHY) onboard the ENVISAT, which is presently in its validation phase. Furthermore, due to the additional limb viewing 15
geometry a direct estimation of the stratospheric column is possible. Time series of SCIAMACHY data as well as ongoing GOME measurements will allow the improved analysis of weekly cycles of tropospheric NO2and will afford quantitative estimates of different types of anthropogenic emissions as well as the lifetime of tropospheric NO2 for different regions of the world.
20
Acknowledgements. We like to thank the European Space Agency (ESA) operation center
in Frascati (Italy) and the “Deutsches Zentrum f ¨ur Luft- und Raumfahrt” DLR (Germany) for providing the ERS-2 satellite data.
References
Atkinson, R.: Atmospheric chemistry of VOCs and NOx, Atmos. Environ., 34, 2063–2101, 2000. 25
Burrows, J., Weber, M., Buchwitz, M., Rozanov, V., Ladstetter-Weienmayer, A., Richter, A., De Beek, R., Hoogen, R., Bramstedt, K., Eichmann, K. U. , Eisinger, M., and Perner, D.: The
ACPD
3, 3451–3467, 2003 Weekly cycle of NO2 by GOME measurements S. Beirle et al. Title Page Abstract Introduction Conclusions References Tables Figures J I J I Back CloseFull Screen / Esc
Print Version Interactive Discussion
© EGU 2003 Global Ozone Monitoring Experiment (GOME): Mission concept and first scientific results, J.
Atmos. Sci., 56, 151–175, 1999.
Cerveny, R. S. and Balling, R. C. Jr.: Weekly cycles of air pollutants, precipitation and tropical cyclones in the coastal NW Atlantic region, Nature, 394, 561–563, 1998.
Cerveny, R. S. and Coakley, K. J.: A weekly cycle in atmospheric carbon dioxide, Geophys. 5
Res. Lett., 29, 2, 10.1029/20001GL013952, 2002.
Cleveland, W. S., Graedel, T. E., Kleiner, B., and Warner, J. L.: Sunday and workday variations in photochemical air pollutants in New Jersey and New York, Science, 186, 1037–1038, 1974.
Elkus, B. and Wilson, K. R.: Photochemical air pollution: weekend-weekday differences, Atmos. 10
Environ., 11, 509–515, 1977.
Grzegorsky, M.: Determination of cloud parameters for the Global Ozone Monitoring Experi-ment with broad band spectrometers and from absorption bands of oxygen dimer, Diploma thesis, University of Heidelberg, Germany, 2003.
Jacob, D. J.: The oxidizing power of the atmosphere, Handbook of Weather, Climate and Water, 15
ed. by T. D. Potter and B. Colman, Wiley, 2003.
Lee, D. S., K ¨ohler, I., Grobler, E., Rohrer, F., Sausen, R., Gallardo-Klenner, L., Olivier, J. G. J., Dentener, F. J., and Bouwman, A. F.: Estimations of global NOx emissions and their
uncertainties, Atmos. Environ., 31, 1735–1749, 1997.
Leue, C., Wenig, M., Wagner, T., Klimm, O., Platt, U., and J ¨ahne, B.: Quantitative analysis of 20
NO2emissions from GOME satellite image sequences, J. Geophys. Res., 106, 5493–5505, 2001.
Martin, R. V., Chance, K., Jacob, D. J., Kurosu, T. P., Spurr, R. J. D., Bucsela, E., Gleason, J. F., Palmer, P. I., Bey, I., Fiore, A. M., Li, Q., Yantosca, R. M., and Koelemeijer, R. B. A.: An improved retrieval of tropospheric nitrogen dioxide from GOME, J. Geophys. Res., 107, D20, 25
4437, 10.1029/2001JD001027, 2002.
Platt, U.: Differential optical absorption spectroscopy (DOAS), in Air Monitoring by Spectromet-ric Techniques, edited by M. Sigrist, Chemical Analysis Series, 127, 27–84, John Wilsy, New York, 1994.
Richter A. and Burrows, J.: Retrieval of Tropospheric NO2 from GOME Measurements, Adv. 30
Space Res., 29, 11, 1673–1683, 2002.
Velders, G. J. M., Granier, C., Portmann, R. W., Pfeilsticker, K., Wenig, M., Wagner, T., Platt, U., Richter, A., and Burrows, J.: Global tropospheric NO2column distributions: Comparing
ACPD
3, 3451–3467, 2003 Weekly cycle of NO2 by GOME measurements S. Beirle et al. Title Page Abstract Introduction Conclusions References Tables Figures J I J I Back CloseFull Screen / Esc
Print Version Interactive Discussion
© EGU 2003 3-D model calculations with GOME measurements, J. Geophys. Res., 106, 12 643–12 660,
2001.
Wagner, T.: Satellite observations of atmospheric halogen oxides, Ph.D. thesis, University of Heidelberg, Germany, 1999.
Wenig, M.: Satellite Measurements of Long-Term Global Tropospheric Trace Gas Distributions 5
and Source Strengths, Ph.D. thesis, University of Heidelberg, Germany,http://mark-wenig.
de/diss mwenig.pdf, 2001.
Wickert, B.: Berechnung anthropogener Emissionen in Deutschland f ¨ur Ozonsimulationen, Ph.D. thesis, University of Stuttgart, Germany, 2001.
ACPD
3, 3451–3467, 2003 Weekly cycle of NO2 by GOME measurements S. Beirle et al. Title Page Abstract Introduction Conclusions References Tables Figures J I J I Back CloseFull Screen / Esc
Print Version Interactive Discussion © EGU 2003 0 4 8 1. USA 2. Europe 3. East Asia 4. Middle East South Africa Sao Paulo Hongkong Jakarta Mexico City
Fig. 1. Six years mean (1996–2001) of global tropospheric NO2 Vertical Column Density in 1015 molecules/cm2. The weekly cycle of the framed areas 1. US East Coast, 2. Europe, 3. East Asia and 4. Middle East, as well as 5. the marked individual metropolises are considered in detail in this study.
ACPD
3, 3451–3467, 2003 Weekly cycle of NO2 by GOME measurements S. Beirle et al. Title Page Abstract Introduction Conclusions References Tables Figures J I J I Back CloseFull Screen / Esc
Print Version Interactive Discussion
© EGU 2003
Wed Thu Fri Sat Sun Mon Tue
2. Europe
Wed Thu Fri Sat Sun Mon Tue
1. USA Eastcoas
t
Wed Thu Fri Sat Sun Mon Tue
4. Middle East
Wed Thu Fri Sat Sun Mon Tue
3. East Asia
Fig. 2. Mean tropospheric NO2 VCD (1996–2001) for the regions of interest, as marked in Fig. 1, for the different days of the week separately. Colour scale and unit are the same as in Fig. 1.
ACPD
3, 3451–3467, 2003 Weekly cycle of NO2 by GOME measurements S. Beirle et al. Title Page Abstract Introduction Conclusions References Tables Figures J I J I Back CloseFull Screen / Esc
Print Version Interactive Discussion
© EGU 2003 Wed Thu Fri Sat Sun Mon Tue Wed
0.5 1.0 1.5 (1) USA New York Los Angeles Chicago Dallas Detroit
Wed Thu Fri Sat Sun Mon Tue Wed 0.5 1.0 1.5 (2) Europe Milan Paris Frankfurt Essen Sheffield
Wed Thu Fri Sat Sun Mon Tue Wed 0.5 1.0 1.5
(3a) Japan & South Corea
Tokio Osaka Kyoto Seoul
Wed Thu Fri Sat Sun Mon Tue Wed 0.5 1.0 1.5 (3b) China Beijing Shanghai Tianjin Jinan Shijiazhuang
Wed Thu Fri Sat Sun Mon Tue Wed 0.7 0.8 0.9 1.0 1.1 0.8 0.9 1.0 1.5 (4) Middle East
Jerusalem CairoRijad Mecca Dammam Abu Dhabi
Wed Thu Fri Sat Sun Mon Tue Wed 0.5 1.0 1.5 (5) Others Sao Paulo Hongkong Jakarta Mexico City Johannesburg
Fig. 3. Weekly cycle of tropospheric NO2 VCD for the considered locations (as marked in Fig. 1). The values are normalized with respect to the median weekly value (relative units). Black lines are averaged curves. The error bar to the left of every plot indicates the maximum error (standard error of the mean) of all data points.
ACPD
3, 3451–3467, 2003 Weekly cycle of NO2 by GOME measurements S. Beirle et al. Title Page Abstract Introduction Conclusions References Tables Figures J I J I Back CloseFull Screen / Esc
Print Version Interactive Discussion
© EGU 2003
Europe
Germany
Fig. 4. Zoom of Fig. 1 on West Europe. For the lifetime estimation of tropospheric NO2 in Germany, the considered area is marked (7◦–14◦E and 48◦–54◦N).
ACPD
3, 3451–3467, 2003 Weekly cycle of NO2 by GOME measurements S. Beirle et al. Title Page Abstract Introduction Conclusions References Tables Figures J I J I Back CloseFull Screen / Esc
Print Version Interactive Discussion
© EGU 2003 Wed Thu Fri Sat Sun Mon Tue Wed
0.5 1.0 1.5 c) Measured trop. VCD
Wed Thu Fri Sat Sun Mon Tue Wed 0.5 1.0 1.5 a) Assumed emissions
Wed Thu Fri Sat Sun Mon Tue Wed 0.5 1.0 1.5 b) Modelled trop. VCD 6 h 12 h 18 h
Fig. 5. Weekly cycle of NO2(modelled and measured) for Germany (as shown in Fig. 4). All plots are normalized with respect to the median weekly value (relative units). (a) Assumed weekly cycle of NOxemissions (Adopted from Wickert, 2001). (b) Modelled tropospheric VCD
at ERS-2 overflight time for different lifetimes of NO2. (c) Mean tropospheric VCD of NO2 measured with GOME.