Time-Resolved in Situ ATR Spectroscopy of 2-Propanol Oxidation over Pd/Al2O3: Evidence
for 2-Propoxide Intermediate
Thomas Bu1rgi* and Marco Bieri
Institut de Chimie, Faculte´ des Sciences, UniVersite´ de Neuchaˆtel, Rue Emilie-Argand 11, 2007-Neuchaˆtel, Switzerland
In situ attenuated total reflection infrared spectroscopy in a flow-through cell combined with online UV-vis spectroscopy was used to investigate the oxidation of 2-propanol over Pd/Al2O3catalyst. The state of the catalyst was driven fast between reduced and oxidized by admitting alternately dissolved hydrogen and oxygen, and the response of the catalytic solid-liquid interface was followed in time. Besides the oxidation product acetone and the water that forms, when hydrogen and oxygen are simultaneously adsorbed on the catalyst surface, an additional species was observed with a characteristic band at ∼1065 cm-1. On the basis of the transient character of the adsorbate and density functional theory calculations, we assign this species to adsorbed 2-propoxide. Its observation indicates that the second dehydrogenation step is rate limiting in an oxidative dehydrogenation mechanism. The results furthermore show that adsorbed hydrogen and oxygen limit the dissociative adsorption of 2-propanol and that 2-propoxide can be hydrogenated back to the reactant in the presence of adsorbed hydrogen.
Introduction
The investigation of heterogeneous catalytic reactions by in situ or operando spectroscopy is a promising strategy to obtain molecular level information on the transformation of reactants into products and on the state of the catalyst under working conditions. The driving force for such research is, besides pure curiosity, the hope that a rigorous understanding of the reaction mechanism helps the rational design of better catalyst materials and processes. Development of spectroscopic techniques that can be applied in situ is currently making progress.1,2
A big challenge for in situ spectroscopy in heterogeneous catalysis is related to the complexity of the relevant interfaces. Pure observation of a species at a working catalytic interface does not a priori reveal its importance in the reaction mechanism. To determine whether a species is an intermediate or a spectator requires more effort. On the other hand, identification of the nature of reaction intermediates is perhaps the most direct way to uncover the reaction mechanism. Unfortunately, such inter-mediates are not easily observable due to their usually short lifetime and low abundance. One way to “catch” intermediates is the sudden change of a reaction parameter. For example, an intermediate in the hydrogenation of ethylene over Pt/Al2O3was observed at the solid-gas interface after a short pulse of the reactant.3This intermediate, which was assigned to ethyl, had a lifetime of around 100 ms.
We have recently applied attenuated total reflection (ATR) infrared spectroscopy4to study catalytic solid-liquid interfaces, which proved to be a sensitive tool for the investigation of model5-7 and real powder catalysts.8,9 The combination with modulation excitation spectroscopy,10 that is, the periodic stimulation of the catalyst sample and phase-sensitive detection of the response, further increases sensitivity and helps to
disen-tangle complex spectra of the catalytic solid-liquid interface.8 Applying relatively fast concentration stimulation at a solid-liquid interface in order to “catch” intermediates is limited by convection and diffusion processes in the fluid. Still, relatively fast stimulation is possible when using a carefully designed low volume flow-through cell.11
In this paper we use ATR to investigate the oxidation of 2-propanol to acetone by oxygen over a Pd/Al2O3catalyst. By admitting dissolved hydrogen and oxygen, the Pd catalyst is switched fast between two states and the response of the catalytic interface is followed in time with the goal of catching intermediates. The evolution of the reaction product is traced by both ATR infrared and online UV spectroscopies.
Selective oxidation of alcohols over noble metal catalysts proceeds under mild conditions and is an attractive synthetic route for fine chemical production.12-14 The reaction was proposed to proceed via a dehydrogenation mechanism:12,15The alcohol adsorbs on the metal catalyst and is dehydrogenated in two subsequent steps. The resulting adsorbed aldehyde or ketone is then desorbing. The role of the oxygen is the oxidation of adsorbed hydrogen. Support for this view stems from the observation that during reaction the catalyst surface is covered by hydrogen, even in the presence of oxygen.16-19Furthermore, an isotope effect was found for R-deuterated and nondeuterated 2-propanol.16 Another proposed pathway involves a direct reaction between the adsorbed substrate and adsorbed oxygen.20 Although direct spectroscopic information on the catalyst solid-liquid interface during alcohol oxidation has been reported recently,21,22reaction intermediates on the catalyst surface have not been identified up to now.
Experimental Section
Catalyst and Chemicals. A 5% Pd/Al2O3catalyst (Johnson Matthey, Type 324) was used. Before measurements the catalyst * Corresponding author. Telephone: ++41 32 718 24 12. Fax: ++41
32 718 25 11. E-mail: [email protected].
Time-resolved IR and UV-vis spectra were also demodulated using a digital phase-sensitive detection according to eq 1:
Hereν˜ is the wavenumber, ω is the stimulation frequency, T is the modulation period, and φkPSDis the demodulation phase
angle. With one set of time-resolved spectra eq 1 can be evaluated for different phase angles φkPSD, resulting in a series
of phase-resolved absorbance spectra. The quantity k determines the frequency at which the time-dependent signals A(ν˜,t) (IR or UV-vis) are demodulated, i.e., the fundamental of the stimulation frequency (k ) 1), first harmonic (k ) 2), and so on. A more detailed description of the modulation technique applied here can be found elsewhere.8,23
Typically experiments were performed as follows: 2-Propanol in the two glass bubble tanks was saturated with nitrogen before one tank was saturated with hydrogen and one with oxygen. Hydrogen-saturated 2-propanol was then flowed first over the sample for 10 min. Afterward the flow was changed between hydrogen- and oxygen-saturated 2-propanol five times (each flow for about 1 min). After that treatment modulation experi-ments were started. Several consecutive modulation experiexperi-ments were performed with the same catalyst layer. The catalyst layer was however freshly prepared every day.
Results
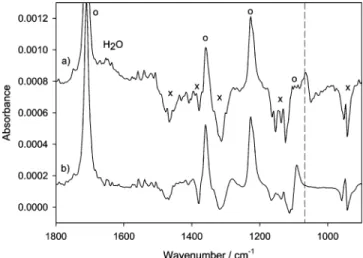
Figure 2 shows different ATR spectra (not demodulated). Spectrum a was recorded during a modulation experiment when switching from hydrogen- to oxygen-saturated 2-propanol. Spectra b and c were recorded while flowing acetone in 2-propanol (saturated with nitrogen) over the bare IRE and over the IRE coated with catalyst, respectively. Spectrum d is an ATR spectrum of 2-propanol. Comparing spectrum a with spectra b and c allows identification of the oxidation product acetone in the spectra recorded in situ (Figure 2a). Specifically, strong bands in the ATR-IR spectra marked with open circles Figure 1. Schematic setup of the in situ attenuated total reflection (ATR) experiment with online fiber optics UV-vis analysis of reaction products. AkφkPSD(ν˜) )2 T
∫
0 T A(ν˜,t) sin(kωt + φk PSD ) dt (1) k ) 1, 2, ...was reduced in situ by hydrogen. 2-Propanol (Merck p.a.) was used as supplied. Nitrogen (99.995%), hydrogen (99.995%), and oxygen (99.998%) gases (CarbaGas) were used to saturate the solvents.
Thin Film Preparation. A slurry of the catalyst powder was
prepared from about 20 mg of catalyst and 5 mL of 2-propanol. Films of the catalyst powder were prepared by dropping the slurry onto a ZnSe internal reflection element (IRE; 52 × 20 × 2 mm, KOMLAS). The solvent was allowed to evaporate, and the procedure was repeated totally three times. After drying for several minutes at 50 °C in air, loose catalyst particles were removed by flowing 2-propanol over the IRE. After drying in air the film was ready for use. The amount of catalyst exposed to the solvent was between 1 and 1.5 mg.
In Situ Spectroscopy. ATR spectra were recorded using a
home-built stainless steel flow-through cell with a volume of 0.077 mL and a gap between IRE and polished steel surface of the cell of 250 µm.8The cell has two inlets, which allows the rapid change between two different fluids at the entrance of the flow compartment. The cell was mounted on an attachment for ATR measurements (Wilks Scientific) within the sample compartment of a Bruker EQUINOX-55 Fourier transform infrared (FT-IR) spectrometer equipped with a narrow band MCT detector. Spectra were recorded at 4 cm-1 resolution. The ATR cell can be cooled or heated; however, all measurements reported here were performed at room temperature. The ATR cell corresponds to the one described in more detail elsewhere.11 In addition to the previously reported setup, the ATR cell effluent was directly coupled into a home-built UV-vis flow-through cell. This cell consists of two stainless steel tees connected by a Teflon tube. The light from a deuterium halogen source (Avantes) is guided to one end of the cell via an optical fiber. The transmitted light is collected at the other end of the cell and coupled into a second optical fiber, which guides the light to an UV-vis spectrometer (Avantes) equipped with a 2024 pixel CCD detector array and a resolution of 2.4 nm. Typical integration time for one spectrum is 10 ms. The path length of the UV-vis transmission cell is 4 cm. The solvent was saturated with gases in two separate glass bubble tanks and was flowed through the cells and over the sample by means of a peristaltic pump (ISMATEC, Reglo 100) located after the UV-vis cell. The flow rate was varied between 0.85 and 2.7 mL/min. Two pneumatically actuated three-way Teflon valves (PARKER PV-1-2324) were used to control the solvent flow from the two tanks. Stainless steel tubing was used. A schematic setup of the experiment is given in Figure 1.
Modulation Excitation Spectroscopy and Data Acquisi-tion. The catalytic system was stimulated by periodically
admitting 2-propanol saturated with hydrogen and oxygen. During one modulation period (flow of hydrogen-saturated 2-propanol followed by an equally long flow of oxygen-saturated 2-propanol), 60 and 20 infrared spectra, respectively, were recorded at 80 kHz sampling rate using the rapid scan acquisition mode of the FT-IR spectrometer. For each spectrum several scans were averaged. Several modulation periods (5-30) were applied before data acquisition was started. Infrared spectra were then averaged over several periods (5-60). UV-vis spectra of the cell effluent were recorded simultaneously and synchronized with IR spectra acquisition. Before every scan of the IR spectrometer the UV-vis spectrometer was triggered to record one scan. As for the IR several scans were averaged such that for one modulation period a total of 60 and 20 spectra, respectively, were obtained. In contrast to the IR the UV-vis spectra were not directly averaged over the modulation periods.
are associated with dissolved acetone. The negative signals marked with crosses are due to 2-propanol. When acetone is formed (Figure 2a) or admitted to the cell (Figure 2b,c), the concentration of 2-propanol slightly decreases, leading to negative signals. Besides the oxidation product acetone and the negative signals due to 2-propanol, two other features are evident in spectrum a recorded in situ: a broad band associated with water at ∼1650 cm-1 and a feature at 1065 cm-1 (dashed vertical line), which are associated neither with acetone nor with 2-propanol. Water forms in the transient period when both hydrogen and oxygen are adsorbed. The nature of the species associated with the band at 1065 cm-1will be discussed below. In the UV-vis spectra shown in Figure 3 acetone gives rise to a band centered at 270 nm. Figure 3a is the UV spectrum of a solution of acetone in 2-propanol. Spectra b and c were recorded online, with spectrum b in the transient period while
changing from hydrogen- to oxygen-saturated 2-propanol and spectrum c while flowing oxygen-saturated solvent. The refer-ence for spectra b and c was hydrogen-saturated 2-propanol. The prominent signal below 260 nm arises due to dissolved oxygen.
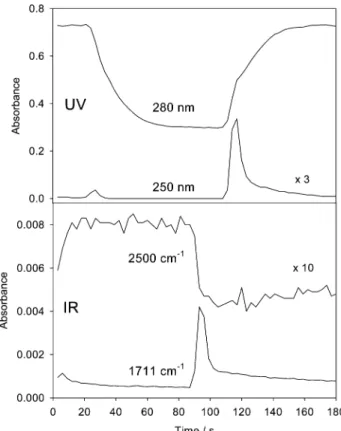
Figure 4 shows the time dependence of some signals in the IR and UV. The absorbance at 1711 cm-1is associated with the strongest signal of acetone in the infrared. The absorbance at 2500 cm-1, which is far from any strong molecular absorption, reflects the change in the catalyst state. It has been shown recently that the Pd catalyst itself responds to the oxidative and reductive conditions. This results in a broad absorption in the ATR spectra over the whole mid-infrared region due to the changes in the optical constants of the strongly absorbing Pd when the latter changes its state.22Also shown is the absorbance in the UV at 280 (acetone) and 250 nm (oxygen). The maximum absorbance in the UV-vis corresponds to an acetone concentra-tion of 0.0024 mol/L, as determined by comparison with solutions of known concentration. The corresponding value for the ATR is 0.0104 mol/L. The discrepancy is due to the fact that the acetone is formed within the catalyst layer, which is selectively probed by the ATR. Note that at a volumetric flow rate of 0.85 mL/min, as applied in the experiment shown in Figure 4, the mean residence time in the ATR cell is only 5.4 s. Figure 4 reveals that acetone is predominantly formed when changing from hydrogen- to oxygen-saturated 2-propanol. Considerably less acetone is formed when changing from oxygen to hydrogen.
Figure 2. (a) ATR spectrum recorded during a modulation experiment
(modulation period T ) 180 s, flow rate 0.85 mL/min). The spectrum was recorded in the transient period while changing from hydrogen-to oxygen-saturated 2-propanol. The reference was recorded while flowing hydrogen-saturated 2-propanol. Spectra b and c were recorded while flowing acetone dissolved in 2-propanol over the clean IRE and the IRE covered with catalyst, respectively. The reference for spectra b and c was recorded while flowing 2-propanol over the clean IRE and the IRE covered with catalyst, respectively. Spectrum d shows an ATR spectrum of 2-propanol (background empty ATR cell). Open circles (O) indicate the most prominent bands associated with dissolved acetone. Crosses (×) mark regions of strong 2-propanol absorption. The dashed vertical line indicates a band that belongs neither to 2-propanol nor to acetone.
Figure 3. (a) UV spectrum of acetone in 2-propanol recorded with
the online UV-vis spectrometer schematically shown in Figure 1. (b) UV spectrum recorded online during the transient period while changing from hydrogen- to oxygen-saturated 2-propanol (for conditions see Figure 2). (c) UV spectrum recorded online while flowing oxygen-saturated 2-propanol. The reference for spectra b and c was recorded while flowing hydrogen-saturated 2-propanol.
Figure 4. Selected ATR and UV signals as a function of time for a
modulation experiment with a modulation period of 180 s and flow rate of 0.85 mL/min (60 spectra/period). At t ) 0 the flow at the entrance of the ATR cell was switched from oxygen- to hydrogen-saturated 2-propanol. At t ) 90 s (T/2) the flow was switched back to oxygen-saturated 2-propanol. The ATR signals were averaged over five modulation periods, whereas the UV signal was not averaged and represents only one out of the five cycles. Note that the signals in the UV are retarded with respect to the ones observed in the ATR-IR, since the UV spectra are recorded at the outlet of the ATR cell (see Figure 1).
Figure 5a shows a demodulated ATR spectrum for a fast modulation experiment (hydrogen-oxygen-hydrogen..., T ) 12 s). For comparison a (time-resolved) spectrum, recorded while flowing acetone dissolved in 2-propanol over the catalyst, is shown in Figure 5b. Careful inspection of the two spectra reveals a band at 1065 cm-1for spectrum a, which is missing in spectrum b. Figure 6 reveals that the species associated with the band at 1065 cm-1 has a time dependence similar to the one of the reaction product acetone. Figure 2 shows that this band is not associated with dissolved or adsorbed acetone. Also, 2-propanol (Figure 2) does not have absorption bands at this frequency, which could lead to signals due to incomplete compensation. Besides the band at 1065 cm-1, the ones associated with acetone and water, and the features associated with 2-propanol, no other signals with a similar time dependence could be observed.
A possible intermediate in the oxidation reaction is adsorbed 2-propoxide. Indeed, alkoxide species on metal surfaces exhibit strong C-O stretching vibrations in the frequency range between 1000 and 1100 cm-1.24-28For 2-propoxide on Ni(100) a band at ∼1090 cm-1, which was assigned to the C-O stretching vibration, is the most prominent feature in the frequency range between 1000 and 1600 cm-1.28To corroborate the assignment of the band observed in our spectra at 1065 cm-1 to a 2-propoxide intermediate, we have performed density functional theory (DFT) calculations for both 2-propanol and 2-propoxide on Pd. The calculations were performed with Gaussian03.29The b3pw91 hybrid functional30was used with a 6-31G(d,p)31basis set for C, O, and H and LANL2DZ32for Pd. The Pd surface was replaced by three Pd atoms in order to simulate adsorption on 3-fold sites. This simple approach is expected to yield qualitative information concerning adsorbate vibrations, since the latter are relatively insensitive to cluster size, in contrast to other properties such as adsorption energies.33Figure 7 shows an ATR spectrum of liquid 2-propanol together with the calculated spectra for 2-propanol and 2-propoxide on Pd. A comparison between experimental and calculated spectra for 2-propanol reveals general good agreement with the exception
of the two modes calculated at 1219 and 1040 cm-1that contain C-O-H bending character. These modes are strongly affected by intermolecular interactions in the liquid state. This result is Figure 5. (a) Demodulated ATR spectrum of a modulation experiment.
Modulation period T ) 12 s; flow rate 2.7 mL /min. At t ) 0 the flow at the entrance of the ATR cell was switched from oxygen- to hydrogen-saturated 2-propanol. At t ) 6 s (T/2) the flow was switched back to oxygen-saturated 2-propanol. The signal was averaged over 20 periods with 20 spectra/period. The time-resolved spectra were then demodu-lated according to eq 1. For comparison a (time-resolved) spectrum is shown (trace b) that was recorded while flowing acetone dissolved in 2-propanol over the IRE covered with catalyst. Open circles (O) indicate the most prominent bands associated with dissolved acetone. Crosses (×) mark regions of strong 2-propanol absorption. The dashed vertical line indicates a band that belongs neither to 2-propanol nor to acetone.
Figure 6. ATR signals as a function of time of (a) acetone (1711 cm-1
band) and (b) the species associated with the band at 1065 cm-1for different modulation experiments (, oxygen-, hydrogen-saturated 2-propanol). (1) T ) 12 s, flow rate 2.7 mL/min, averaged over 60 periods, 20 spectra/period. (2) T ) 58 s, flow rate 0.85 mL/ min, averaged over five periods, 20 spectra/period. (3) T ) 180 s, flow rate 0.85 mL/min, averaged over five periods, 60 spectra/period.
Figure 7. ATR spectrum of 2-propanol, together with calculated
infrared spectra for 2-propanol and 2-propoxide on Pd. The b3pw91 method was used with a 6-31G(d,p) basis set for C, O, and H and LANL2DZ for Pd. The calculated infrared intensities were convoluted with a Lorentzian line shape. Calculated frequencies were scaled by a factor of 0.95 in order to account for the overestimation of the fundamental vibrational frequencies due to the neglect of anharmonicity, electron correlation, and basis set effect.37Open circles (O) indicate
bands containing C-O-H bending character. Crosses (×) indicate bands with C-O stretching character (see text for more details).
in agreement with a previous report.34The three modes at 932, 1114, and 1136 cm-1 all contain significant C-O stretching character. The 2-propoxide species has a different spectrum. Besides the disappearance of the C-O-H bending modes, the modes containing C-O stretching character are affected. Most of the C-O stretching intensity is now condensed in a mode with a frequency calculated slightly below 1090 cm-1, which becomes by far the strongest band in this frequency region. This mode is red-shifted compared to the corresponding modes in 2-propanol. Based on the calculated spectra of 2-propanol and 2-propoxide, we would expect a strong signal of 2-propoxide due to a C-O vibration red-shifted by 25-45 cm-1with respect to the corresponding bands in 2-propanol. In the experimental spectrum of liquid 2-propanol the corresponding bands are found slightly above 1100 cm-1. Therefore, the observed band at 1065 cm-1 in the ATR spectra recorded during reaction is consistent with a 2-propoxide adsorbed on Pd. Figure 7 reveals that a 2-propoxide species should also exhibit signals due to C-H modes. However, these signals are difficult to observe, since the corresponding frequency range is crowded by vibrations due to 2-propanol and acetone.
Discussion
In situ ATR spectroscopy of the catalytic solid-liquid interface combined with online UV-vis analysis of the reaction products, as schematically shown in Figure 1, proved to be a powerful tool for time-resolved investigations. Figure 4 shows that the signal of the reaction product acetone in the UV is delayed by 21 s with respect to the corresponding ATR-IR signal. This delay is caused by the flow of the fluid from the ATR to the UV cell. The full width at half-maximum of the two signals is 8.5 s in the ATR and 10 s in the UV, respectively, reflecting a fast response of the combined system.
Besides the reaction product acetone that is observed in the infrared and the UV spectra and some water that is formed from hydrogen and oxygen on the Pd surface, another band at 1065 cm-1 is observed that has the same time dependence as the reaction product. Based on control experiments, which show that this band is associated with neither adsorbed acetone nor 2-propanol, DFT calculations, and comparison with previously reported spectra of 2-propoxide, we assign the band to 2-pro-poxide adsorbed on Pd. Figure 6 furthermore shows that the 1065 cm-1 band is associated with a transient species. We should also note that this band was not observed for similar experiments in the absence of 2-propanol.
Our experiments strongly indicate that 2-propoxide is an intermediate in the oxidation of 2-propanol to acetone. Hence the initial step in the oxidation of the alcohol is its dissociative adsorption, which leads to adsorbed alkoxide and hydrogen. This step requires free surface sites. Not surprisingly the rate of product formation is coupled to the abundance of the intermedi-ate on the catalyst surface. When the abundance of the intermediate on the surface is high, the product can be observed. In the presence of dissolved hydrogen the catalyst surface is covered with hydrogen, thus preventing dissociative adsorption of the alcohol. In the presence of oxygen under our conditions the Pd surface is covered by oxygen. This state is referred to as “over-oxidized” and also prevents dissociative adsorption of the alcohol.35,36In our experiments the 2-propoxide abundance had a maximum between the two extreme states of the catalyst surface. The change between the two states of the catalyst is sharp in our experiments and can be followed via the broad absorption over the whole mid-infrared region (Figure 4, signal at 2500 cm-1) due to the slight alteration of the optical constants
of the strongly absorbing metal particles.22 In this transient period, stimulated by changing the dissolved gas, adsorbed hydrogen and oxygen react to water, which is also observed in our experiment (band at ∼1650 cm-1, Figures 2 and 5). This opens up free sites on the catalyst surface, onto which the alcohol can dissociatively adsorb. Note that the reaction between oxygen and hydrogen on the catalyst surface also takes place under conditions where the hydrogen is not supplied externally, since the dissociative adsorption of the alcohol also leads to adsorbed hydrogen.
The results presented above strongly indicate that the key to high activity of the catalyst is its ability to dissociatively adsorb the alcohol reactant. This is in agreement with experimental observations that identify the concentration of oxygen as critical reaction parameter.12,19A delicate balance between dissociative adsorption of the reactant and the adsorption of oxygen is crucial for high activity. If the concentration of oxygen on the surface gets too high, the rate of dissociative adsorption of the alcohol decreases, due to fewer available sites. As a consequence, less hydrogen is available on the surface, which can react with adsorbed oxygen, and fewer sites are freed for the further adsorption of the reactant. The catalyst runs into an “over-oxidized” state.
Both acetone and 2-propoxide are detected when changing between oxygen and hydrogen and vice versa. However, Figure 6 reveals that the relative amount of the two species is different in the two cases. When changing from oxygen to hydrogen only a little acetone is formed, whereas the signal assigned to the 2-propoxide intermediate is still relatively strong. This holds for different conditions (flow rates, modulation periods), as Figure 6 shows. This means that not all the adsorbed intermedi-ate is transformed to product and that the fraction that is transformed is higher when switching from hydrogen to oxygen. An explanation for this behavior is the back-reaction of 2-propoxide to 2-propanol in the presence of hydrogen on the surface. The importance of this reaction channel is different for the two transient periods (hydrogen f oxygen and oxygen f hydrogen). Support for this view comes from the fastest modulation experiment reported in Figure 6 (bottom), which indicates that the maximum of the 2-propoxide signal is sightly shifted toward the hydrogen-rich region of the transient periods with respect to the signal of the acetone product. Hence, too much hydrogen on the surface not only blocks adsorption sites for the dissociative adsorption of the alcohol but also promotes the reaction of the alkoxide intermediate back to the alcohol reactant.
The observation of an alkoxide species in the ATR spectra shows that this species is relatively abundant on the catalyst surface and therefore strongly indicates that the second dehy-drogenation step, which yields adsorbed acetone, is rate limiting. This is in agreement with the observed isotope effect for the oxidation rate of R-deuterated and nondeuterated 2-propanol.16
Conclusions
The combination of attenuated total reflection (ATR) infrared spectroscopy in a low volume flow-through cell with online UV-vis analysis of the reaction product is well suited to following fast changes taking place at a catalytic solid-liquid interface. Application of the technique to the oxidation of 2-propanol over a Pd/Al2O3catalyst allows the simultaneous observation of (1) dissolved reaction product acetone (by ATR and UV), (2) changes of the state of the Pd catalyst induced by adsorption of hydrogen and oxygen, respectively, and (3) adsorbed species at the catalytic interface. In transient experi-ments an adsorbed species can be observed in the ATR spectra
(1) Weckhuysen, B. M. J. Chem. Soc., Chem. Commun. 2002, 97. (2) Weckhuysen, B. M. In Situ Spectroscopy of Catalysts; American Scientific Publishers: San Diego, CA, 2004.
(3) Ko, M. K.; Frei, H. J. Phys. Chem. B 2004, 108, 1805. (4) Harrick, N. J. Internal reflection spectroscopy; Interscience Publish-ers: New York, 1967.
(5) Ferri, D.; Bu¨rgi, T.; Baiker, A. J. Phys. Chem. B 2001, 105, 3187. (6) Ferri, D.; Bu¨rgi, T. J. Am. Chem. Soc. 2001, 123, 12074. (7) Bonalumi, N.; Bu¨rgi, T.; Baiker, A. J. Am. Chem. Soc. 2003, 125, 13342.
(8) Bu¨rgi, T.; Baiker, A. J. Phys. Chem. B 2002, 106, 10649. (9) Gisler, A.; Bu¨rgi, T.; Baiker, A. Phys. Chem. Chem. Phys. 2003, 5, 3539.
(10) Baurecht, D.; Fringeli, U. P. ReV. Sci. Instrum. 2001, 72, 3782. (11) Urakawa, A.; Wirz, R.; Bu¨rgi, T.; Baiker, A. J. Phys. Chem. B
2003, 107, 13061.
(12) Besson, M.; Gallezot, P. Catal. Today 2000, 57, 127. (13) Mallat, T.; Baiker, A. Catal. Today 1994, 19, 247.
(14) Vinke, P.; deWit, D.; deGoede, A. T. J. W.; vanBekkum, H. In New DeVelopments in SelectiVe Oxidation by Heterogeneous Catalysis; Ruiz, P., Delmon, B., Eds.; Elsevier: Amsterdam, 1992; Vol. 72; p 1.
(15) Heyns, K.; Paulsen, H. Angew. Chem. 1957, 69, 600.
(16) Cosimo, R. D.; Whitesides, G. M. J. Phys. Chem. 1989, 93, 768. (17) Mu¨ller, E.; Schwabe, K. Z. Elektrochem. Angew. Phys. Chem. 1928, 34, 170.
(18) Mallat, T.; Bodnar, Z.; Baiker, A. In Catalytic SelectiVe Oxidation; Oyama, S. T., Hightower, J. W., Eds.; American Chemical Society: Washington, DC, 1993; Vol. 523, p 308.
(19) Mallat, T.; Baiker, A. Catal. Today 1995, 24, 143.
(20) Tillaart, J. A. A. v. d.; Kuster, B. F. M.; Marin, G. B. Appl. Catal. A: Gen. 1994, 120, 127.
(21) Keresszegi, C.; Bu¨rgi, T.; Mallat, T.; Baiker, A. J. Catal. 2002, 211, 244.
(22) Bu¨rgi, T.; Wirz, R.; Baiker, A. J. Phys. Chem. B 2003, 107, 6774. (23) Wirz, R.; Bu¨rgi, T.; Baiker, A. Langmuir 2003, 19, 785. (24) Yee, A.; Morrison, S. J.; Idriss, H. J. Catal. 1999, 186, 279. (25) Shorthouse, L. J.; Roberts, A. J.; Raval, R. Surf. Sci. 2001, 480, 37.
(26) Stacchiola, D.; Burkholder, L.; Tysoe, W. T. J. Mol. Catal A: Chem.
2004, 216, 215.
(27) Davis, J. L.; Barteau, M. A. Surf. Sci. 1990, 235, 235.
(28) Zaera, F.; Guevremont, J. M.; Gleason, N. R. J. Phys. Chem. B
2001, 105, 2257.
(29) Frisch, M. J.; Trucks, G. W.; Schlegel, H. B.; Scuseria, G. E.; Robb, M. A.; Cheeseman, J. R.; Montgomery, J. A.; Vreven, T.; Kudin, K. N.; Burant, J. C.; Millam, J. M.; Iyengar, S. S.; Tomasi, J.; Barone, V.; Mennucci, B.; Cossi, M.; Scalmani, G.; Rega, N.; Petersson, G. A.; Nakatsuji, H.; Hada, M.; Ehara, M.; Toyota, K.; Fukuda, R.; Hasegawa, J.; Ishida, M.; Nakajima, T.; Honda, Y.; Kitao, O.; Nakai, H.; Klene, M.; Li, X.; Knox, J. E.; Hratchian, H. P.; Cross, J. B.; Adamo, C.; Jaramillo, J.; Gomperts, R.; Stratmann, R. E.; Yazyev, O.; Austin, A. J.; Cammi, R.; Pomelli, C.; Ochterski, J. W.; Ayala, P. Y.; Morokuma, K.; Voth, G. A.; Salvador, P.; Dannenberg, J. J.; Zakrzewski, V. G.; Dapprich, S.; Daniels, A. D.; Strain, M. C.; Farkas, O.; Malick, D. K.; Rabuck, A. D.; Raghavachari, K.; Foresman, J. B.; Ortiz, J. V.; Cui, Q.; Baboul, A. G.; Clifford, S.; Cioslowski, J.; Stefanov, B. B.; Liu, G.; Liashenko, A.; Piskorz, P.; Komaromi, I.; Martin, R. L.; Fox, D. J.; Keith, T.; Al-Laham, M. A.; Peng, C. Y.; Nanayakkara, A.; Challacombe, M.; Gill, P. M. W.; Johnson, B.; Chen, W.; Wong, M. W.; Gonzalez, C.; Pople, J. A. Gaussian03, Rev. B.05 ed.; Gaussian, Inc.: Pittsburgh, PA, 2003.
(30) Becke, A. D. J. Chem. Phys. 1993, 98, 5648.
(31) Ditchfield, R.; Hehre, W. J.; Pople, J. A. J. Chem. Phys. 1971, 54, 724.
(32) Hay, P. J.; Wadt, W. R. J. Chem. Phys. 1985, 82, 270. (33) Neurock, M. Top. Catal. 1999, 9, 135.
(34) Uvdal, P.; MacKerell, A. D.; Wiegand, B. C.; Friend, C. M. Phys. ReV. B 1995, 51, 7844.
(35) vanDam, H. E.; Kieboom, A. P. G.; vanBekkum, H. Appl. Catal.
1987, 33, 361.
(36) Dijkgraaf, P. J. M.; Rijk, M. J. M.; Meuldijk, J.; Wiele, K. v. d. J. Catal. 1988, 112, 329.
(37) Scott, A. P.; Radom, L. J. Phys. Chem. 1996, 100, 16502. simultaneously with acetone formation. Based on the transient
character of the species and density functional theory calcula-tions, it is assigned to 2-propoxide intermediate. The intermedi-ate is observed when both hydrogen and oxygen are present on the catalyst, which leads to the formation of water and frees up sites for the dissociative adsorption of the 2-propanol. The ratio between 2-propoxide and acetone is different when changing the dissolved gas from hydrogen to oxygen or vice versa, which indicates that the intermediate can be hydrogenated back to the reactant favored by high hydrogen coverage. The concentration of oxygen is decisive for fast oxidation. At too high oxygen concentration no free sites are available for the dissociative adsorption of the alcohol (the catalyst is “over-oxidized”); at too low oxygen concentration the surface coverage of hydrogen is large and blocks adsorption sites and furthermore promotes the hydrogenation of the alkoxide intermediate. The observations support an oxidative dehydrogenation mechanism and indicate that the second dehydrogenation step is rate limiting. The results furthermore reveal the importance of transient methods for the investigation of reaction intermediates and that such experiments are feasible also at solid-liquid interfaces, where response is usually limited by diffusion.
Acknowledgment. Grants of computer time by the Swiss
National Supercomputer Centre in Manno and financial support by the Swiss National Science Foundation are kindly acknowl-edged.