Digital photogrammetry and laser
rangefinder techniques to measure
African elephants
A.M. Shrader†, S.M. Ferreira‡
& R.J. van Aarde*
Conservation Ecology Research Unit, Department of Zoology and Entomology, University of Pretoria, Pretoria, 0002 South Africa
Received 7 April 2005. Accepted 17 October 2005
Photogrammetry can be used to measure the body dimensions of a variety of mammals. We developed a digital photogrammetry technique and used an infrared laser rangefinder to measure the shoulder heights of African elephants (Loxodonta africana). Measures of the height of objects of known size using digital photogrammetry were between 0.7% shorter to 0.6% taller than the real values. The rangefinder recorded values that ranged from 0.8% to 3.6% larger than the real height. When we applied digital photogrammetry to tame elephants, measured shoulder heights were 1.6% to 3.4% shorter than those recorded using a cus-tom-made calliper. For these elephants, the rangefinder recorded shoulder heights that were 3.8 to 9.4% smaller than the real values. The digital photogrammetric technique described here is less time-consuming and as or more precise than other techniques used to measure African elephants.
Key words: African elephant, digital photogrammetry, laser rangefinder, Loxodonta africana,
shoulder height.
Von Bertalanffy (1938) was one of the first to model growth as a function of age. Laws (1966) and Hanks (1972) used this model to relate the age of culled African elephants to their shoulder heights. Scientists and managers can also use growth models to determine the ages of elephants. They can then estimate the age at first calving, calving intervals and age-specific survival rates (Jachmann 1986). Values for these may serve as input variables for models of population growth (Caswell 2001). The precise and efficient measuring of the body size of elephants may thus help elephant management efforts.
Earlier studies used age-related patterns of molar teeth eruption to assign ages to elephants (see Laws 1969). These ages, however, may be incorrect (Hanks 1979; Lindeque 1988; Whyte 2001) and thus invalidate some growth models and the population variables that were derived from them (e.g. Laws 1969; Hanks 1972; Lindeque & van Jaarsveld 1993; Whyte 2001). However, growth functions based on the shoulder heights of known-age elephants (Lee & Moss 1995) may
provide more precise age estimates.
Douglas-Hamilton (1972) developed the so-called ‘pole-method’ to measure the shoulder heights of elephants. His method entailed photographing an elephant when both its shoulder and foot were visi-ble. A measuring pole placed at that elephant’s earlier location, was photographed from the same place and angle once the elephant moved on. The photograph of the pole was then used to infer the shoulder height of the elephant. The method has been used often (Jachmann 1980; Jachmann 1986; Western et al. 1983), but is cumbersome and time-consuming. It generates errors (deviating within 0.14% to 5% of the actual value) when the position of the pole and the elephant differs (Jachmann 1980). Further error comes from using a single photograph to derive the shoulder heights of groups of elephants, such as those in breeding herds (Jachmann 1980).
Hall-Martin & Rüther (1979) used stereo-photo-grammetry to measure the shoulder heights and back lengths of elephants. They compared their values with the shoulder heights of six immobilized elephants, and found that these differed between 1 and 10 cm. This technique, however, required specialized equipment.
More recently, Lee & Moss (1995) used the Photoscale II to measure the shoulder heights of elephants. They used a digital calliper to infer South African Journal of Wildlife Research 36(1): 1–7 (April 2006)
*To whom correspondence should be addressed. E-mail: [email protected]
†Present address: Terrestrial Ecology Research Unit, Department of
Zoology, P.O. Box 77000, Nelson Mandela Metropolitan University, Port Elizabeth, 6031 South Africa.
E-mail: [email protected]
‡Present address: Department of Statistics, University of Auckland,
shoulder heights from changes in the focal extension of a 300 mm lens fitted to a 35 mm film camera. Their method dealt with some of the limitations of the pole-method and stereo-photogrammetry. However, the procedure took time, needed the development of film and led to errors of <3.5% deviation from the real values (Lee & Moss 1995).
Laser and digital technology may overcome some of the limitations of earlier methods. For instance, digital images are comprised of pixels of known size. These pixels can be counted and used to deduce size if the distance between the camera and an object (h) is known. The size of an object may be calculated from the number of pixels it comprises (hi), the focal length of the lens (f ) and
its distance from the camera (d ) (h dhi f
= ; Robin-son & Ruddock 1984). The size and density of pixels, as well as the focal length of the lens, influ-ence the measurements represented by pixels. The number of pixels recorded by the image sensor of the camera determines pixel density. As the number of pixels increases, their sizes decrease. Increasing pixel density, therefore, increases the number of pixels per unit measure-ment (e.g. pixels/cm).
Focal length affects the number of pixels per unit measurement by altering the magnification of the object within the image. As focal length decreases, the size of the object in the image also decreases. In addition, the number of pixels per unit measure-ment decreases as the distance between the object and camera increases.
We used a Canon EOS 10D single lens reflex digital camera fitted with a 70–200 mm f4 Canon auto focus lens. We mounted the camera and an Impulse laser rangefinder (Laser Technology Inc., Colorado, U.S.A.) on adjacent tripods. At each of ten separate distances away from the camera and rangefinder, we took 12 images (as JPEG files) of a metre stick. The images comprised the 12 different combinations of pixel density (i.e. 6.3 megapixels, 2.8 megapixels and 1.6 mega-pixels) and focal length settings (i.e. 200 mm, 135 mm, 100 mm and 70 mm).
We downloaded the images onto a personal computer and used Adobe Photoshop Elements 2.0 (Adobe Systems Inc., California, USA) to count the number of pixels covered by the length of the metre stick on each of the images. We used linear regression analyses to describe the relationship between cm/pixel and distance to the metre stick. The digital focal length multiplier of the Canon D10
makes the actual focal length used to take images 1.6 times larger than the focal length on the camera lens.
In addition to measuring distance, the custom settings on the laser rangefinder allowed us to estimate the height of an object. Using the range-finder we determined height through triangulation by measuring the horizontal distance to the object and the angles of inclination from the horizontal plane to the top and bottom of the object (e.g. for elephants: the estimated middle of the front leg, tip of the shoulder, and the point where the foot touches the ground; Fig. 1b).
We measured objects (i.e. PVC piping of different lengths, a fence post and one of us) of known heights at different distances using both the digital camera and the Impulse laser rangefinder. The
2 South African Journal of Wildlife Research Vol. 36, No. 1, April 2006
Fig. 1. Illustrations of the application of (a) the
custom-built calliper, and (b) laser rangefinder, and (c) digital photogrammetry used to measure the shoulder heights of elephants. Shoulder height (hi) of the individual tame
elephants was measured using the calliper. The laser rangefinder measured shoulder height ( $hi) through the triangulation of 1) the horizontal distance to the middle of the leg (di), and 2) the angles of inclination from this
hori-zontal plane to the top of the shoulder αi) and the
point where the foot touches the ground ( i). Shoulder
height ( $hi) was estimated using digital photogrammetry from digital images obtained with a digital camera and the horizontal distance (di) obtained with the laser
number of pixels in the length of the image of the metre stick decreased exponentially with distance (Fig. 2a). The number of cm/pixel increased linearly with decreases in pixel density and focal length (Fig. 2b; Table 1).
To assess the accuracy and precision of our method we used the relationship for the highest pixel density and longest focal length. This gave the greatest number of pixels at the different distances (Fig. 2a). The 95% confidence interval
Fig. 2. Changes in (a) number of pixels comprising the length of the metre stick photographed (i.e.pixels/m) and (b) cm/pixel with distance for the three pixel densities (6.3 megapixels, 2.8 megapixels and 1.6 megapixels) and four focal lengths (70 mm ◆, 100 mm ●, 135 mm ▲, and 200 mm ■). The number of pixels/m decreased exponentially with distance. Centimetres/pixel increased with distance and the rate of change in cm/pixel (i.e.slopes in the linear relationships) increased with decreasing pixel density and focal length.
(CI) of the slope of the regression between actual height (h) and height estimated with the rangefinder (hi) were >1 (CI: 1.008–1.036, hi =
1.022h–8.037, r2
= 0.999,F1,33= 22730,P < 0.001).
The rangefinder thus overestimated the heights of the objects by 0.8 to 3.6%. In contrast, the 95% confidence interval of the slope for the digital photogrammetry technique included 1 (CI: 0.993– 1.006,hi = 0.9997h + 0.474, r
2
= 0.999, F1,30 =
89880,P < 0.001). Digital photogrammetry of the different objects yielded values from 0.7% smaller to 0.6% larger than the real measures. For five repeated measures of the same object, we noted a coefficient of variation of 1.45% and 0.2% when using the rangefinder and digital photogrammetry techniques, respectively.
To assess the accuracies of the two methods for elephants, we measured five tame elephants at Letsatsing Game Reserve (Pilanesberg Elephant Back Safaris) and seven tame elephants at the Elephant Sanctuary near Brits, South Africa. The height of each elephant was measured with a large custom-built calliper that was placed next to the elephant with the cross arm resting on the elephant’s shoulder (Fig. 1a). Both techniques underestimated the shoulder heights (he) of the 12
tame elephants. Digital photogrammetry, however, was more accurate than the rangefinder underes-timating heights by 1.6 to 3.4% (CI: 0.966–0.984, he,i= 0.9752he+ 7.051,r
2
= 0.996,F1,180= 43480,
P < 0.001). The rangefinder underestimated the shoulder heights by 3.8 to 9.4% (CI: 0.906–0.962, he,i= 0.934he+ 15.94,r
2
= 0.961,F1,180= 4332,P <
0.01). In addition, digital photogrammetry was
more precise than the rangefinder – the coefficient of variation for each elephant varied between 0.10 and 2.06% using digital photogrammetry and 0.54 to 7.76% using the rangefinder (Table 2).
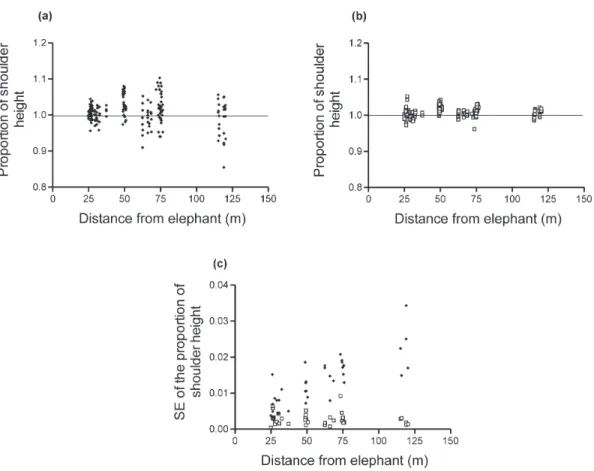
Distance to the elephant did not influence the differences between the estimated and actual shoulder heights using either the rangefinder technique (F1,179= 0.35,P = 0.55; Fig. 3a) or digital
photogrammetry (F1,179= 2.89,P = 0.10; Fig. 3b).
However, the variances in rangefinder estimates were considerably larger as distance increased (F1,35= 59.20,P < 0.01; Fig. 3c), but did not change
when using digital photogrammetry (F1,35= 0.78,
P = 0.38; Fig. 3c).
Both of our techniques require less time to measure elephants than the previous methods. Only the digital photogrammetric method, how-ever, yielded more accurate and precise measures than those recorded with other methods. The processing of film required when using the pole (Douglas-Hamilton, 1972), stereo-photogrammetric (Hall-Martin & Rüther 1979) or Photoscale II (Lee & Moss 1995) methods, also delays the analysis of data. Our methods are free of this limitation.
Digital photogrammetry can capture data rapidly, while computer software allows for the measuring of a large number of individuals. Digital images of elephant groups may give measures of individuals providing the distance to each individual is known. In some cases, the sampling of large herds is best when elephants move past a fixed position where distances and images can be recorded with ease. In these cases, a single distance measurement is often enough when elephants move in single file
4 South African Journal of Wildlife Research Vol. 36, No. 1, April 2006
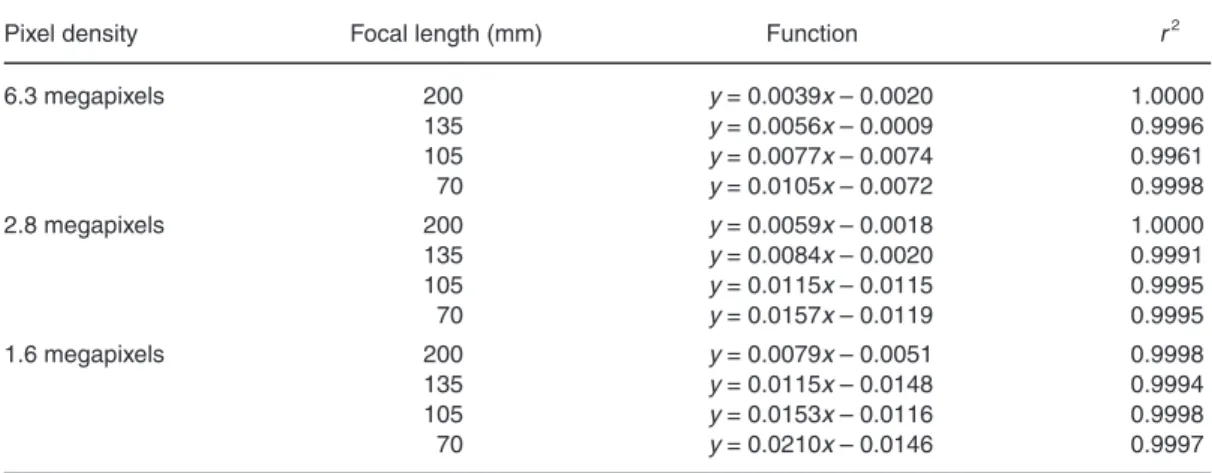
Table 1. Functions describing the linear relationships between the number of cm/pixel (y) and the distance to the subject in metres (x) for the different pixel densities at the various focal lengths. Nearly 100% of the variation in cm/pixel was accounted for by variations in distance and focal length. Note that these focal lengths are not corrected for the camera’s 1.6 times magnification.
Pixel density Focal length (mm) Function r2
6.3 megapixels 200 y= 0.0039x– 0.0020 1.0000 135 y= 0.0056x– 0.0009 0.9996 105 y= 0.0077x– 0.0074 0.9961 70 y= 0.0105x– 0.0072 0.9998 2.8 megapixels 200 y= 0.0059x– 0.0018 1.0000 135 y= 0.0084x– 0.0020 0.9991 105 y= 0.0115x– 0.0115 0.9995 70 y= 0.0157x– 0.0119 0.9995 1.6 megapixels 200 y= 0.0079x– 0.0051 0.9998 135 y= 0.0115x– 0.0148 0.9994 105 y= 0.0153x– 0.0116 0.9998 70 y= 0.0210x– 0.0146 0.9997
along game-paths to and from water.
The performance of our digital photogrammetric technique is similar to that of other non-invasive techniques (Douglas-Hamilton 1972; Hall-Martin & Rüther 1979; Jachmann 1980; Western et al. 1983; Lee & Moss 1995). For instance, Jachmann (1980) recorded additive errors of up to 6% within real values for the pole method. Lee & Moss (1995) reported <3.5% error for the Photoscale II. In both cases, however, the errors were analytical, as the methods were not applied to elephants with known shoulder heights. Note that our methods yielded estimates that were 1.6 to 3.4% smaller than the real values.
We reduced the variance of our measures by taking a single image of one or more elephants as well as accurate distances to each individual within this image. In addition, we manipulated the image quality to assist with measuring the objects within an image. Lee & Moss (1995) obtained error
in their estimates through poor image quality and/or the obstruction of objects (e.g. the shoulder or foot). We improved on this by sharpening the images. In this case, we adjusted the contrast between pixels and the edges of some objects (e.g. the shoulder) then became clearer. In addi-tion, by magnifying the image using a graphics package, we located objects that appear ob-scured. Note that the magnification of an image does not change either the pixel density or pixel size, and thus does not affect the measurements made.
Digital photogrammetry is an efficient way to get accurate measures of shoulder heights. The use of digital cameras allows for the easy and fast analyses of images. The technique also allows for the correction of poor images. Observers check images seconds after recording and correct low-quality ones immediately. This improves data quality and consistency.
Fig. 3. Estimated shoulder heights of tame elephants expressed as proportions of real height. Symbols <1 indicate
estimates that were smaller than real height, while symbols >1 represent estimates that were greater. Proportions did not change with distance using (a) the rangefinder technique or (b) digital photogrammetry. However, the standard error of proportions (c) increased with distance when using a rangefinder technique (◆), but not with digital photo-grammetry (p).
6 South African Journal of Wildlife Research Vol. 36, No. 1, April 2006
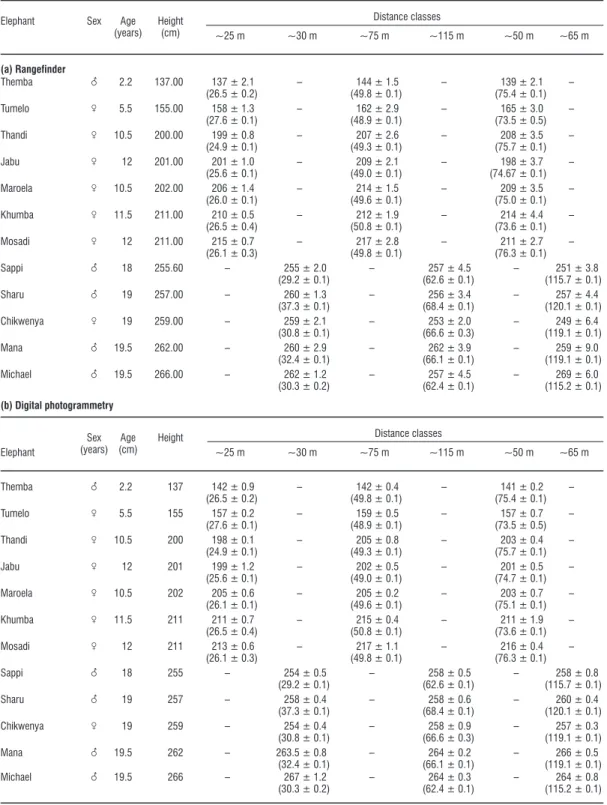
Table 2. Comparison of actual heights with estimates of shoulder height (mean ± SE,n= 5 measurements) derived for 12 elephants of different ages from various distances using (a) a laser rangefinder and (b) digital photogrammetry. Values in brackets represent the mean distance from an individual elephant during the five repeat measures within the distance class.
Distance classes
Elephant Sex Age Height
~25 m ~30 m ~75 m ~115 m ~50 m ~65 m (years) (cm) (a) Rangefinder Themba 8 2.2 137.00 137 ± 2.1 – 144 ± 1.5 – 139 ± 2.1 – (26.5 ± 0.2) (49.8 ± 0.1) (75.4 ± 0.1) Tumelo 9 5.5 155.00 158 ± 1.3 – 162 ± 2.9 – 165 ± 3.0 – (27.6 ± 0.1) (48.9 ± 0.1) (73.5 ± 0.5) Thandi 9 10.5 200.00 199 ± 0.8 – 207 ± 2.6 – 208 ± 3.5 – (24.9 ± 0.1) (49.3 ± 0.1) (75.7 ± 0.1) Jabu 9 12 201.00 201 ± 1.0 – 209 ± 2.1 – 198 ± 3.7 – (25.6 ± 0.1) (49.0 ± 0.1) (74.67 ± 0.1) Maroela 9 10.5 202.00 206 ± 1.4 – 214 ± 1.5 – 209 ± 3.5 – (26.0 ± 0.1) (49.6 ± 0.1) (75.0 ± 0.1) Khumba 9 11.5 211.00 210 ± 0.5 – 212 ± 1.9 – 214 ± 4.4 – (26.5 ± 0.4) (50.8 ± 0.1) (73.6 ± 0.1) Mosadi 9 12 211.00 215 ± 0.7 – 217 ± 2.8 – 211 ± 2.7 – (26.1 ± 0.3) (49.8 ± 0.1) (76.3 ± 0.1) Sappi 8 18 255.60 – 255 ± 2.0 – 257 ± 4.5 – 251 ± 3.8 (29.2 ± 0.1) (62.6 ± 0.1) (115.7 ± 0.1) Sharu 8 19 257.00 – 260 ± 1.3 – 256 ± 3.4 – 257 ± 4.4 (37.3 ± 0.1) (68.4 ± 0.1) (120.1 ± 0.1) Chikwenya 9 19 259.00 – 259 ± 2.1 – 253 ± 2.0 – 249 ± 6.4 (30.8 ± 0.1) (66.6 ± 0.3) (119.1 ± 0.1) Mana 8 19.5 262.00 – 260 ± 2.9 – 262 ± 3.9 – 259 ± 9.0 (32.4 ± 0.1) (66.1 ± 0.1) (119.1 ± 0.1) Michael 8 19.5 266.00 – 262 ± 1.2 – 257 ± 4.5 – 269 ± 6.0 (30.3 ± 0.2) (62.4 ± 0.1) (115.2 ± 0.1) (b) Digital photogrammetry Distance classes Elephant
Sex Age Height
∼25 m ~30 m ~75 m ∼115 m ∼50 m ∼65 m (years) (cm) Themba 8 2.2 137 142 ± 0.9 – 142 ± 0.4 – 141 ± 0.2 – (26.5 ± 0.2) (49.8 ± 0.1) (75.4 ± 0.1) Tumelo 9 5.5 155 157 ± 0.2 – 159 ± 0.5 – 157 ± 0.7 – (27.6 ± 0.1) (48.9 ± 0.1) (73.5 ± 0.5) Thandi 9 10.5 200 198 ± 0.1 – 205 ± 0.8 – 203 ± 0.4 – (24.9 ± 0.1) (49.3 ± 0.1) (75.7 ± 0.1) Jabu 9 12 201 199 ± 1.2 – 202 ± 0.5 – 201 ± 0.5 – (25.6 ± 0.1) (49.0 ± 0.1) (74.7 ± 0.1) Maroela 9 10.5 202 205 ± 0.6 – 205 ± 0.2 – 203 ± 0.7 – (26.1 ± 0.1) (49.6 ± 0.1) (75.1 ± 0.1) Khumba 9 11.5 211 211 ± 0.7 – 215 ± 0.4 – 211 ± 1.9 – (26.5 ± 0.4) (50.8 ± 0.1) (73.6 ± 0.1) Mosadi 9 12 211 213 ± 0.6 – 217 ± 1.1 – 216 ± 0.4 – (26.1 ± 0.3) (49.8 ± 0.1) (76.3 ± 0.1) Sappi 8 18 255 – 254 ± 0.5 – 258 ± 0.5 – 258 ± 0.8 (29.2 ± 0.1) (62.6 ± 0.1) (115.7 ± 0.1) Sharu 8 19 257 – 258 ± 0.4 – 258 ± 0.6 – 260 ± 0.4 (37.3 ± 0.1) (68.4 ± 0.1) (120.1 ± 0.1) Chikwenya 9 19 259 – 254 ± 0.4 – 258 ± 0.9 – 257 ± 0.3 (30.8 ± 0.1) (66.6 ± 0.3) (119.1 ± 0.1) Mana 8 19.5 262 – 263.5 ± 0.8 – 264 ± 0.2 – 266 ± 0.5 (32.4 ± 0.1) (66.1 ± 0.1) (119.1 ± 0.1) Michael 8 19.5 266 – 267 ± 1.2 – 264 ± 0.3 – 264 ± 0.8 (30.3 ± 0.2) (62.4 ± 0.1) (115.2 ± 0.1)
To date, we have used our methods to measure the shoulder heights and back lengths of nearly 10 000 elephants as part of surveys throughout southern Africa. One constraint of digital photo-grammetry is that the camera model and specifica-tions of the lenses used affect the measures made when using this method. Digital cameras change the magnification of images by a factor that varies between makes and models (i.e. Canon 1Ds = 1×, Nikon D1 and D100 = 1.5×, Canon 10D = 1.6×; Digital Photography Review 2004). The relation-ships between pixels/cm and distance that we found here will thus differ for other camera–lens combinations. These relationships should be calibrated for individual cameras using the approach described in the present study. ACKNOWLEDGEMENTS
We would like to thank the Namibian Ministry of Environment and Tourism for permission to work in the Etosha National Park. Brett Mitchell and Craig Saunders kindly assisted by allowing us to measure the tame elephants at Pilanesberg Elephant Back Safaris and The Elephant Sanctuary, respectively. All measurements of these animals were done in a humane and safe manner. The project was funded through grants to R.J.v.A. from the Peace Parks Foundation, the International Fund for Animal Welfare, the U.S. Fish & Wildlife Services and the University of Pretoria. Brian Reilly and an anonymous reviewer provided comments that improved our manuscript.
REFERENCES
CASWELL, H. 2001. Matrix population models: construc-tion, analysis, and interpretaconstruc-tion, 2nd edn. Sinauer Associates, Massachusetts.
DIGITAL PHOTOGRAPHY REVIEW 2004. Digital Cam-era specifications. www.dpreview/reviews/specs. asp. Askey.Net Consulting.
DOUGLAS-HAMILTON, I. 1972. On the ecology of the African elephant. Ph.D. thesis, University of Oxford, Oxford.
HALL-MARTIN, A.J. & RÜTHER, H. 1979. Applications of stereo photogrammetric techniques for measuring African elephants.Koedoe22: 187–198.
HANKS, J. 1972. Growth of the African elephant
(Loxodonta africana).E. Afr. Wildl. J.10: 251–272.
HANKS, J. 1979. A struggle for survival. The elephant problem. C. Struik Publishers, Cape Town.
JACHMANN, H. 1980. Population dynamics of the elephants in the Kasungu National Park, Malawi.
Neth. J. Zool.30: 622–634.
JACHMANN, H. 1986. Notes on the population dynamics of the Kasungu elephants.Afr. J. Ecol.24: 215–226. LAWS, R.M. 1966. Age criteria for the African elephant,
Loxodonta africana. E. Afr. Wildl. J.4: 1–37.
LAWS, R.M. 1969. The Tsavo research project.
J. Reprod. Fert. (Suppl.)6: 495–531.
LEE, P.C. & MOSS, C.J. 1995. Statural growth in known-age African elephants (Loxodonta africana).
J. Zool., Lond.236: 29–41.
LINDEQUE, M. 1988. Population dynamics of elephants in the Etosha National Park. Ph.D. thesis, University of Stellenbosch, Stellenbosch.
LINDEQUE, M., & VAN JAARSVELD, A.S. 1993. Post-natal growth of elephants Loxodonta africana in Etosha National Park, Namibia.J. Zool., Lond.229: 319–330.
ROBINSON, C. & RUDDOCK, L. 1984. Quantitative methods for surveyors. Construction Press, London. VON BERTALANFFY, L. (1938). A quantitative theory of
organic growth.Human Biol.10: 181–213.
WESTERN, D., MOSS, C.J. & GEORGIADIS, N. 1983. Age estimation and population age structure of elephants from footprint dimensions. J. Wildl.
Manage.47: 1192–1197.
WHYTE, I.J. 2001. Conservation management of the Kruger National Park elephant population. Ph.D. thesis, University of Pretoria, Pretoria.