HAL Id: hal-02116524
https://hal.archives-ouvertes.fr/hal-02116524
Submitted on 15 Nov 2020HAL is a multi-disciplinary open access archive for the deposit and dissemination of sci-entific research documents, whether they are pub-lished or not. The documents may come from teaching and research institutions in France or abroad, or from public or private research centers.
L’archive ouverte pluridisciplinaire HAL, est destinée au dépôt et à la diffusion de documents scientifiques de niveau recherche, publiés ou non, émanant des établissements d’enseignement et de recherche français ou étrangers, des laboratoires publics ou privés.
Lifetime Measurements Using RDDS Method in the
Vicinity of
78Ni
C. Delafosse, D. Verney, A. Gottardo, F. Ibrahim, S. Franchoo, I. Matea, L.
Olivier, C. Portail, E. Clément, A. Lemasson, et al.
To cite this version:
C. Delafosse, D. Verney, A. Gottardo, F. Ibrahim, S. Franchoo, et al.. Lifetime Measurements Using RDDS Method in the Vicinity of78Ni. Zakopane Conference on Nuclear Physics, Aug 2018, Zakopane,
LIFETIME MEASUREMENTS USING RDDS METHOD
IN THE VICINITY OF 78Ni∗
C. Delafosse, D. Verney, A. Gottardo, F. Ibrahim S. Franchoo, I. Matea, L. Olivier, C. Portail Institut de Physique Nucléaire, CNRS-IN2P3, Univ. Paris-Sud
Université Paris-Saclay, 91406 Orsay Cedex, France E. Clément, A. Lemasson, C. Michelagnoli
M. Babo, B. Jacquot
Grand Accélérateur National d’Ions Lourds (GANIL) CEA/DSM-CNRS/IN2P3, Caen, France
A. Goasduff, D.R. Napoli
Instituto Nazionale di Fisica Nucleare, Laboratori Nazionali di Legnaro 35020 Legnaro, Italy
J. Ljungvall, A. Korichi, G. Georgiev, T. Konstantinopoulos CSNSM, CNRS-IN2P3, Univ. Paris-Sud, Université Paris-Saclay, 91406 Orsay, France
S.M. Lenzi, A. Boso, D. Mengoni, F. Recchia Departamento di Fisica e Astronomia, Universita di Padova and
INFN, Sezione di Padova, 35131 Padova, Italy C. Andreoiu
Dept. of Chemistry, Simon Fraster University, Burnaby, BC, V5A S16, Canada F. Didierjean
Institut Pluridisciplinaire Hubert Curien, CNRS-IN2P3-Université de Strasbourg 67037 Strasbourg, France
J. Dudouet, G. Maquart, N. Redon, O. Stezowski
Univ. Lyon, Université Lyon 1, CNRS/IN2P3, IPN-Lyon, 69622, Villeurbanne, France A. Gadea, R.M. Pérez-Vidal
IFIC, CSIC-Univ. Valencia, Apartado Oficial 22085, 46071 Valencia, Spain M. Zielińska
CEA de Saclay, IRFU, 91191 Gif-sur-Yvette, France
(Received November 30, 2018)
∗
Presented at the Zakopane Conference on Nuclear Physics “Extremes of the Nuclear Landscape”, Zakopane, Poland, August 26–September 2, 2018.
634 C. Delafosse et al.
Reduced quadrupole transition probabilities for low-lying transitions
in neutron-rich N = 52 isotones88Kr and 86Se were investigated with a
recoil distance Doppler shift (RDDS) experiment. The experiment was performed at GANIL (Caen, France) using the Orsay Universal Plunger System (OUPS) for the RDDS technique and the AGATA array for the γ-ray detection coupled to the VAMOS++ magnetic spectrometer for an
event-by-event particle identification. In88Kr, the lifetimes of seven levels
were determined and in86Se, the lifetimes of five levels were determined.
The deduced B(E2; 2+1 → 0+1) are compared with mean-field and
shell-model calculations.
DOI:10.5506/APhysPolB.50.633
1. Introduction
The neutron-rich Zr, Sr, Kr, and Se isotopes with neutron numbers N = 50–60 continue to attract attention for their display of rapid changes in the evolution of collectivity and the mounting evidence for shape coex-istence towards Z = 28 [1]. Since the first indications from the trends in the first 2+ energies in Zr [2] and Sr [3] decades ago, studies of transition strengths and moments have most recently cemented a picture of a sud-den increase in collectivity and shape changes for Sr [4], and a quantum phase transition in the shape of the Zr isotopes [5] at N = 60. In the Kr isotopic chain, just four and two protons below Zr and Sr, respectively, a rather gradual onset of collectivity towards N = 60 was concluded from mass measurements [6], Coulomb excitation [7], and fast-timing measure-ments [8], placing the N = 60 isotone 96Kr at the low-Z boundary of the region of deformation described above [9]. Present information on the Se and Kr chain is limited to excitation energies out to94Se [10], the B(E2 ↑) strength of 86,88Kr and 86Se from Coulomb excitation [11], and lifetimes of excited states measured for 84,86Se [12]. The present work extends the investigation of the quadrupole properties of nuclei in this mass region to-wards the doubly magic Z = 28, N = 50 shell closures. We report the measurements of several states lifetimes of excited states in 88Kr and 86Se (N = 52) with improved accuracy as compared to the literature and we ob-tained, for the first time, absolute lifetimes measurements for higher energy Yrast and near-Yrast states in 88Kr and 86Se. The results are compared to shell model calculations in the π(f pg)–ν(sdgh) shell relative to a 78Ni core and to HFB-5DCH mean-field calculation.
2. Experiment
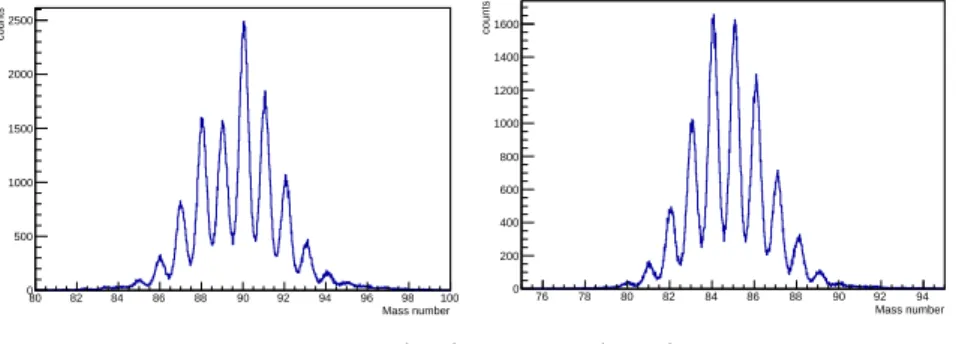
The experiment was performed at GANIL. The88Kr and86Se nuclei were produced by fusion–fission and transfer–fission of a238U beam at 6.2 AMeV on a Be target with a thickness of 2.07 mg/cm2. The average intensity of the beam was 0.25 pnA. The fission fragments were identified and their velocities were determined with the magnetic spectrometer VAMOS++ [13] located at 28◦ from the beam direction in order to select the neutron-rich Ge region. The identification of fission products was based on the ion trajectory reconstruction using: (i) the x and y entrance coordinates on the target multiwire chambers (TMW) [14], (ii) the x and y coordinates in the drift chambers (DC) locate at the focal plane, (iii) the time of flight (ToF) of the fission products between the TMW and the array of parallel plates of the multiwire chambers (MWPPAC) located at the focal plane, (iv) the partial (∆E) and total (E) energies released in the 20 sections of the ionization chambers (IC). The selection of the atomic number (Z) was made using ∆E versus E correlation data. The isotope selection was made in three steps. First, the ratio AQ was reconstructed using the magnetic rigidity and the ToF. Then, the ion charge was identified through an evaluation of the mass obtained from the measurement of the kinetic energy divided by AQ. The charge states Q are selected in the bi-dimensional matrix QE versus AQ. Finally, for each charge state Q, the mass distribution was obtained using the selection of VAMOS events of a given mass A (Fig.1).
Mass number 80 82 84 86 88 90 92 94 96 98 100 counts 0 500 1000 1500 2000 2500 Mass number 76 78 80 82 84 86 88 90 92 94 counts 0 200 400 600 800 1000 1200 1400 1600
Fig. 1. Mass distribution of Kr (left) and Se (right) isotopes obtained with
VAMOS++.
The prompt γ-rays were detected by the AGATA detector [15]. The setup comprised eight triple cluster modules placed at 18.6 cm from the target and at backward angles. Using the grid search algorithm for pulse shape analysis (PSA) [16], the γ-ray interaction points were located in the Ge material with a resolution (FWHM) of about 5 mm at 1 MeV [17]. The energies of γ rays were obtained by applying offline the OFT γ-ray tracking algorithm [18]. The γ-rays spectrum of the nuclei of interest was Doppler
636 C. Delafosse et al.
corrected event-by-event using the velocity vector measured in VAMOS and the position of the first interaction in AGATA. Lifetime measurements were performed using the Recoil Distance Doppler Shift (RDDS) technique using the OUPS plunger [19]. An Mg degrader foil with a thickness of 5 mg/cm2 was placed downstream from the target in order to slow down the fission-products. Depending on the lifetime of the state of interest and the distance between target and degrader, γ-ray emission happened partially before and after the degrader at respective recoil velocities βbefore and βafter. Conse-quently, for each transition, two components (one shifted and one unshifted) were observed in the γ-ray spectrum. As βafter is precisely calculated from
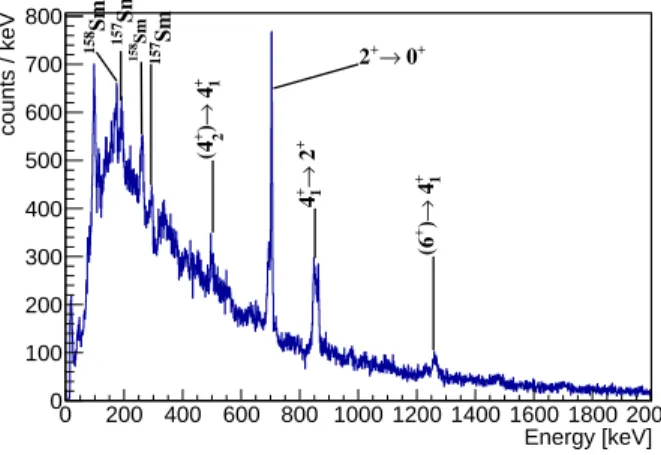
VAMOS information, the “after” component is accurately Doppler corrected (unshifted peak), whereas the “before” component is shifted to lower energy (AGATA being placed at backward angles). Lifetimes are deduced from the ratio of intensity of the two components. The degrader was placed at three distances from the target: 120(10) µm, 270(10) µm and 520(10) µm with a measuring time of 75 h, 75 h and 85 h, respectively. The spectrum contain-ing the sum of statistics collected at all target–degrader distances for 86Se is shown in Fig.2. Energy [keV] 0 200 400 600 800 1000 1200 1400 1600 1800 2000 counts / keV 0 100 200 300 400 500 600 700 800 + 1 4 → ) + 2 (4 + 1 4 → ) + (6 + 2 → + 1 4 + 0 → + 2 Sm 158 Sm 158 Sm 157 Sm 157
Fig. 2. γ-spectrum in AGATA in coincidence with86Se identified in VAMOS.
3. Lifetime results
The lifetime extraction procedure is described in Refs. [12, 20]. We measured the ratio R = IU
IU+IS (IU and IS are the integral of the unshifted
and shifted components of the peak, respectively) for all the distances (when statistics allows). In the case of low statistics, this ratio was obtained from a sum spectrum including measurement at all distances. The velocity of the residue measured in VAMOS was βafter from which βbefore is deduced using the LISE++ software, see Table I. The times of flight between target and
degrader for the distances are then respectively obtained using t = β dc
before
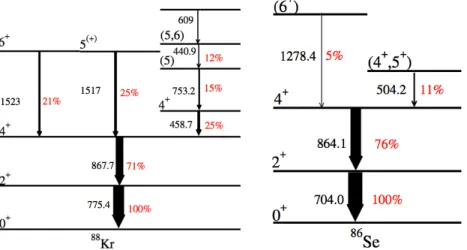
where d is the target–degrader distance and c the speed of light. Seven transitions were attributed to 88Kr: 440, 460, 609, 753, 775, 868, 1517 and 1523 keV [21], and five were attributed to 86Se: 504, 704, 864, 991 and 1279 keV [22], giving the level scheme shown in Fig. 3 (left) and Fig. 3
(right), respectively. Lifetimes were extracted by fitting the R(t) data points with the corresponding Bateman equation (see Fig.4and 5).
Fig. 3. (Colour on-line) Observed level scheme of88Kr (left) and86Se (right). In
red/grey are indicated the observed relative γ-intensities in this work.
time of flight (ps) 0 2 4 6 8 10 12 14 16 18 20 R 0 0.2 0.4 0.6 0.8 1 (a) time of flight (ps) 0 2 4 6 8 10 12 14 16 18 20 R 0 0.2 0.4 0.6 0.8 1 (b)
Fig. 4. Fit of the R ratio as a function of time of flight between target and degrader
using the Bateman equations for the 2+ (a) and 4+
1 (b) states of88Kr.
When the lifetime is too short, only data from the shortest distance measurement can be exploited. In this case, we use the technique used in Ref. [20]. It was used, for example, to determined the lifetimes of the higher energy states in88Kr. All the lifetimes obtained are reported in Table I.
638 C. Delafosse et al. time of flight [ps] 0 2 4 6 8 10 12 14 16 18 20 R 0 0.2 0.4 0.6 0.8 1 (a) time of flight [ps] 0 2 4 6 8 10 12 14 16 18 20 R 0 0.2 0.4 0.6 0.8 1 (b) time of flight [ps] 0 2 4 6 8 10 12 14 16 18 20 R 0 0.2 0.4 0.6 0.8 1 (c)
Fig. 5. The same as Fig. 4but for (4+2) state (a), 4+1 state (b) and 2+ state (c) of
86Se.
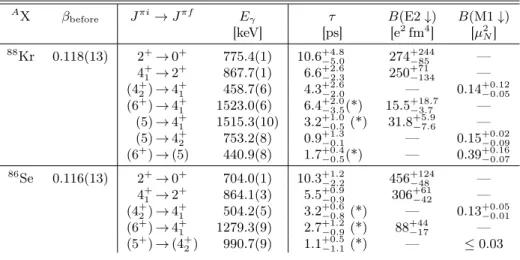
TABLE I
Summary of the experimental lifetimes obtained in88Kr and86Se (the ones with a
star are effective lifetimes i.e. uncorrected from feeding lifetimes). The correspond-ing B(E2) and B(M1) values are also reported.
A
X βbefore Jπi→ Jπf Eγ τ B(E2 ↓) B(M1 ↓)
[keV] [ps] [e2fm4] [µ2 N] 88 Kr 0.118(13) 2+→ 0+ 775.4(1) 10.6+4.8−5.0 274 +244 −85 — 4+1 → 2+ 867.7(1) 6.6+2.6 −2.3 250 +71 −134 — (4+2) → 4 + 1 458.7(6) 4.3 +2.6 −2.0 — 0.14 +0.12 −0.05 (6+) → 4+1 1523.0(6) 6.4 +2.0 −3.5(*) 15.5 +18.7 −3.7 — (5) → 4+1 1515.3(10) 3.2+1.0−0.5(*) 31.8 +5.9 −7.6 — (5) → 4+2 753.2(8) 0.9 +1.3 −0.1 — 0.15 +0.02 −0.09 (6+) → (5) 440.9(8) 1.7+0.4−0.5(*) — 0.39 +0.16 −0.07 86 Se 0.116(13) 2+→ 0+ 704.0(1) 10.3+1.2−2.2 456 +124 −48 — 4+1 → 2 + 864.1(3) 5.5+0.9−0.9 306 +61 −42 — (4+2) → 4+1 504.2(5) 3.2+0.6−0.8(*) — 0.13 +0.05 −0.01 (6+) → 4+1 1279.3(9) 2.7 +1.2 −0.9(*) 88 +44 −17 — (5+) → (4+2) 990.7(9) 1.1 +0.5 −1.1(*) — ≤ 0.03 4. Conclusion
In this work, we report the lifetime measurements of Yrast and near-Yrast states in N = 52 isotones88Kr and86Se (see Table I). The obtained lifetimes of the first excited 2+1 states are compatible with both Coulomb excitation and previous RDDS measurements and with both shell-model using an inert core of 78Ni [23] and beyond mean-field calculations [24] (Table II).
TABLE II Comparison of B(E2) values obtained in this work with available measurements in
the literature and shell model (SM:Ni78-II) [23] and mean-field calculations
(HFB-5DCH) [24].
A
X Jπi→ Jπf
B(E2 ↓) [e2fm4]
This work Exp. literature SM:Ni78-II HFB-5DCH 88 Kr 2+→ 0+ 274+244−85 262(38) [11] 371 389 86 Se 2+→ 0+ 456+124−48 438 +259 −171 [12]/422(64) [11] 436 447 86Se 4+ 1 → 2 + 306+61 −42 ≥ 140 [12] 329 —
C.D. and D.V. express their gratitude to K. Sieja for fruitful discussions and to F. Farget for decisive help with a judicious choice of the VAMOS angle. We acknowledge the important technical contributions of J. Goupil, G. Fremont, L. Menager, J. Ropert, C. Spitaels, and the GANIL accelerator staff. The authors acknowledge support from the European Union Seventh Framework Programme through ENSAR, contract No. 262010. C.A. also acknowledges the support from the Natural Sciences and Engineering Re-search Council of Canada.
REFERENCES
[1] C. Delafosse et al., Phys. Rev. Lett. 121, 192502 (2018).
[2] E. Cheifetz et al., Phys. Rev. Lett. 25, 38 (1970).
[3] H. Wollnik et al.,Nucl. Phys. A 291, 355 (1977).
[4] J.-M. Régis et al., Phys. Rev. C 95, 054319 (2017).
[5] T. Togashi et al.,Phys. Rev. Lett. 117, 172502 (2016).
[6] S. Naimi et al., Phys. Rev. Lett. 105, 032502 (Jul 2010).
[7] M. Albers et al.,Phys. Rev. Lett. 108, 062701 (2012).
[8] J.-M. Régis et al., Phys. Rev. C 90, 067301 (2014).
[9] J. Dudouet et al., Phys. Rev. Lett. 118, 162501 (2017).
[10] I.N. Gratchev et al.,Phys. Rev. C 95, 051302 (2017).
[11] B. Elman et al.,Phys. Rev. C 96, 044332 (2017).
[12] J. Litzinger et al.,Phys. Rev. C 92, 064322 (2015).
[13] M. Rejmund et al.,Nucl. Instrum. Methods Phys. Res. A 646, 184 (2011).
[14] M. Vandebrouck et al.,Nucl. Instrum. Methods Phys. Res. A 812, 112
(2016).
640 C. Delafosse et al.
[16] R. Venturelli, D. Bazzacco, Adaptive Grid Search as Pulse Shape Analysis Algorithm for γ-Tracking and Results, LNL Annual Report 2004, 2005.
[17] B. Bruyneel, B. Birkenbach, P. Reiter,Eur. Phys. J. A 52, 70 (2016).
[18] A. Lopez-Martens et al.,Nucl. Instrum. Methods Phys. Res. A 533, 454
(2004).
[19] J. Ljungvall et al., Nucl. Instrum. Methods Phys. Res. A 679, 61 (2012).
[20] F. Didierjean et al., Phys. Rev. C 96, 044320 (2017).
[21] A. Astier et al.,Phys. Rev. C 88, 024321 (2013).
[22] F. Drouet et al., EPJ Web Conf. 62, 01005 (2013).
[23] K. Sieja, private communication.