HAL Id: hal-01225254
https://hal.inria.fr/hal-01225254v2
Submitted on 27 Dec 2018
HAL is a multi-disciplinary open access
archive for the deposit and dissemination of
sci-entific research documents, whether they are
pub-lished or not. The documents may come from
teaching and research institutions in France or
abroad, or from public or private research centers.
L’archive ouverte pluridisciplinaire HAL, est
destinée au dépôt et à la diffusion de documents
scientifiques de niveau recherche, publiés ou non,
émanant des établissements d’enseignement et de
recherche français ou étrangers, des laboratoires
publics ou privés.
Automated Measurement and Prediction of
Consciousness in Vegetative and Minimally Conscious
Patients
Denis Engemann, Federico Raimondo, Jean-Remi King, Mainak Jas,
Alexandre Gramfort, Stanislas Dehaene, Lionel Naccache, Jacobo Sitt
To cite this version:
Denis Engemann, Federico Raimondo, Jean-Remi King, Mainak Jas, Alexandre Gramfort, et al..
Automated Measurement and Prediction of Consciousness in Vegetative and Minimally Conscious
Pa-tients. ICML Workshop on Statistics, Machine Learning and Neuroscience (Stamlins 2015), Bertrand
Thirion, Lars Kai Hansen, Sanmi Koyejo, Jul 2015, Lille, France. �hal-01225254v2�
Automated Measurement and Prediction of Consciousness in Vegetative and
Minimally Conscious Patients
Denis A. Engemann∗ DENIS.ENGEMANN@GMAIL.COM
Institut du Cerveau et de la Moelle ´Epini`ere, ICM, F-75013, Paris, France
Federico Raimondo∗ FRAIMONDO@DC.UBA.AR
Laboratorio de Inteligencia Artificial Aplicada, Departamento de Computaci´on FCEyN, UBA, Argentina
Jean-R´emi King JEANREMI.KING@GMAIL.COM
Institut du Cerveau et de la Moelle ´Epini`ere, ICM, F-75013, Paris, France
Mainak Jas MAINAKJAS@GMAIL.COM
Institut Mines-T´el´ecom, T´el´ecom ParisTech, CNRS LTCI, France
Alex Gramfort ALEXANDRE.GRAMFORT@TELECOM-PARITECH.FR
Institut Mines-T´el´ecom, T´el´ecom ParisTech, CNRS LTCI, France
Stanislas Dehaene STANISLAS.DEHAENE@CEA.FR
Cognitive Neuroimaging Unit, Institut National de la Sant´e et de la Recherche M´edicale, U992, F-91191 Gif/Yvett , France Lionel L. Naccache LIONEL.NACCACHE@GMAIL.COM
Institut du Cerveau et de la Moelle ´Epini`ere, ICM, F-75013, Paris, France
Jacobo D. Sitt JDSITT@GMAIL.COM
Institut du Cerveau et de la Moelle ´Epini`ere, ICM, F-75013, Paris, France
Abstract
Recent findings in clinical neuroscience have emphasized electroencephalography (EEG) as a tool to discriminate different disorders of con-sciousness (DOC) such as the vegetative and the minimally conscious state. Here we present an automated approach to computing EEG-measures of consciousness and guiding clini-cal diagnostics of DOC. Our approach capital-izes the automated extraction of statistically val-idated EEG-measures quantifying biomarkers of consciousness and filing a database thereof. In a second step, statistical models trained on the database of EEG-measures are then used to pre-dict an incoming patient’s state of conscious-ness. For each new patient, the results of the EEG and the predictions are automatically sum-marized and deployed to the clinician in form ICML Workshop on Statistics, Machine Learning and Neuro-science
∗
equal contributions
of a self-contained HTML-report, which sup-ports interactive visualization and navigation. To validate our approach, we replicated previous findings on EEG-measures of consciousness and quantified the robustness of the EEG-measures to loss of temporal and spatial information. Our re-sults suggest that the EEG-measures can be suc-cessfully employed in a wide range of practical contexts to measure a patients degree of con-sciousness.
1. An automated scalable approach to
measure and predict consciousness in
clinical settings
Advances in contemporary medicine have as consequence that increasingly more patients survive catastrophic brain injuries but remain in disordered consciousness condi-tions, such as the vegetative (VS) or the minimally con-scious state (MCS). Recent brain imaging and neurophys-iological studies have enhanced the scientific understand-ing of these conditions, but also emphasize novel
diag-Automated measurement and prediction of consciousness nostic challenges (Laureys & Schiff,2012). The
distinc-tion of MCS from VS patients can be elusive even for trained physicians. For example, non-standardized behav-ioral evaluations can lead to misclassifications of up to 40%
(Schnakers et al.,2009), which in turn can lead to erroneous
pain-management, prognosis evaluation and even misin-formed end-of-life decisions. Furthermore, for a small proportion of patients that are correctly classified as VS (by means of their behavioral responses), functional neu-roimaging suggests preserved consciousness (Owen et al.,
2006). This poses challenges on multiple, interdisciplinary levels. One such challenge is related to incorporating sci-entific findings on neural correlates of consciousness into the clinical and diagnostic practice. Over the last decade, abundant electrophysiological signatures of consciousness have been proposed. Recently, a systematic analysis of electroencephalography (EEG) measures has been put for-ward by Sitt et al. (2014). A set of measures has been identified that allows to differentiate patients in a vegeta-tive state from those in a minimally conscious or conscious state. These measures quantify putative biomarkers of con-sciousness such as low-frequency brain-rhythms, stimulus-related synchronization of EEG signals (evoked responses), information sharing between electrodes and signal com-plexity. Importantly, previous multivariate classification analyses suggested that these EEG-measures capture com-plementary information as they yield superior classification performance when combined. This poses the question of how such advanced analysis of the EEG recordings can be used in practice to facilitate clinical diagnostics.
1.1. A system for guiding clinical diagnostics of consciousness disorders
Here we implemented an automated solution to clinical di-agnostics of disorders of consciousness (DOC) based on statistical analysis of clinical EEG. Its goal is to estimate an undiagnosed patient’s degree of consciousness based on the EEG-measures described in Sitt et al.(2014) and to efficiently communicate the EEG-analysis together with the diagnostic prediction. For this purpose we developed a flexible and scalable data analysis workflow that au-tomates processing of EEG recordings, the extraction of EEG-measures and the communication of results (cf. fig-ure1for an illustration of the workflow). The solution that we present here is purely based on open source software and is scalable on multiple levels.
For example, by taking advantage of the Python language and its parallel processing libraries such as joblib1, multi-ple CPU-cores can be used to carry out numerical compu-tations. Previously, the only available option to compute
1
https://pythonhosted.org/joblib/ parallel.html
the EEG-measures proposed bySitt et al.(2014) consisted in using local computers and required licenses for commer-cial software. Moreover, our solution has built-in support for Amazon web services (AWS), which allows to carry out computations in parallel across subjects. With 20 virtual workstations of which each is equipped with 4 CPU-cores for example, the computation time can be cut down by a factor of 80. Currently, for a single recording, all EEG-measures can be computed in about 30 minutes. These benchmarks are particularly relevant for the practical pur-pose of the system. The current implementation facilitates the computation of reference models that are estimated on EEG-measures from hundreds of clinical recordings to pre-dict unseen patients.
This not only facilitates more frequent updates of these ref-erence models, which may be required for research pur-poses. It also lowers the maintenance burdens, i.e., of detecting and fixing software bugs. To communicate re-sults efficiently, we devised an HTML-report tool that em-beds images together with the requisite Java-script code en-abling interactive navigation. This self-contained feature promotes automated dispatch of summary-reports to clini-cians or operators, hence, facilitates review and interpreta-tion.
This approach thus minimizes manual interaction or inter-vention by the operator to produce and review findings and is therefore expected to reduce errors. To the best of our knowledge this solution is novel and constitutes the first automated workflow for diagnostics of DOC patients. The following sections detail the implementation strategy and present a validation of the proposed solution based on the analysis of clinical EEG data from DOC patients.
1.2. Implementation details 1.2.1. SOFTWARE
Our software solution is based on open source technolo-gies and is written in Python, C, and bash shell scripts. The computation of the EEG-measures described in Sitt
et al. (2014) was implemented in Python, taking
advan-tage of the Numpy and Scipy libraries for fast matrix cal-culus and scientific computing (Jones et al.,2001). Some performance critical computations have been deferred to code written in C, accompanied by Python bindings. Bash scripts are then used to handle distributed computing and distributing jobs using GNU-parallel (Tange, 2011). For general data-processing and visualization the open source software package MNE is used (Gramfort et al., 2013;
2014) The report-technology has meanwhile been made publicly available as part of the MNE package. For unsu-pervised learning and classification, the scikit-learn library for machine learning is used (Pedregosa et al.,2011).
(A)
(B)
(C)
(D)
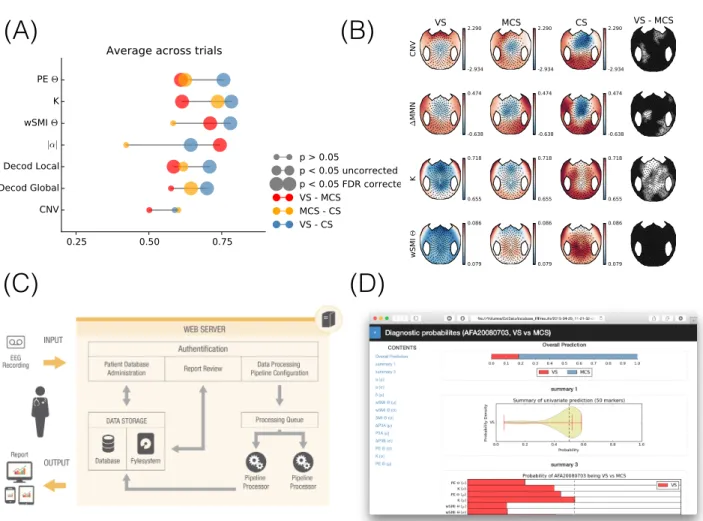
Figure 1. Overview on the automated approach to measurement and diagnostics of consciousness. Panel (A) and (B) illustrate group results for a subset of EEG-measures for different groups of patients suffering from disorders of consciousness (DOC), i.e., vegetative state (VS), minimally conscious state (MCS) and conscious (CS). Panel (A) depicts univariate area under the curve (AUC) scores for mean values across channels. From top to bottom, permutation entropy (PE), complexity measure (K), the wSMI connectivity, normalized alpha-band power, the classification score for the global and the local auditory novelty task, respectively, and the contingent negative variation (CNV). Different colors and different sizes refer to contrasts of interest and significance thresholds, respectively. Big circles refer to false discovery-rate (FDR) corrected p-values. The computation of the EEG-measures was implemented afterSitt et al.
(2014), supplementary materials. Panel (B) depicts related topographies for a subset of the measures shown in panel (B). The outermost column shows a non-parametric statistical map based on a Wilcoxon rank sum test where white, gray and black areas indicate uncorrected p-values greater than 0.05, smaller than 0.05 or smaller than 0.01 respectively. Panel (C) illustrates the overall workflow. EEG data are entered into the system by the operator, the automated pipeline is launched on a web-server, summary reports are dispatched to the operator. Panel (D) shows a screenshot of a diagnostic report that presents the estimated probability of the patient being in a minimally conscious state.
Automated measurement and prediction of consciousness 1.2.2. EEG-RECORDINGS AND PROCESSING
For development and validation analyses, the data reported
inSitt et al.(2014) were used. Subjects were stimulated
us-ing the auditory Local-Global protocol (Bekinschtein et al.,
2009). In this protocol, subjects were presented with a se-ries of sounds that contains regularities at two different hi-erarchical levels, a local level defined by short-term and global level defined by long-term regularities. The devi-ations from these regularities evoke distinct event-related potentials that are useful to evaluate the cognitive state of the patient. EEG recordings were sampled at 250 Hz with a 256-electrode geodesic sensor net (EGI) referenced to the vertex. Recordings were band-pass filtered (from 0.5 to 45Hz using a 12 order FFT-based Butterfly filter). Data were then epoched from −200ms to +1336ms relative to the onset of the first sound.
The following parameters reflect default settings of our software solution and do not depend on the validation dataset. Trials were excluded based on their amplitude range with a rejection threshold at 100mV . Trials were subsequently baseline corrected over the first 200 ms win-dow preceding the onset of the first sound. Electrodes with a rejection rate superior to 20% across trials were rejected and were interpolated using a spherical spline interpolation. To remove remaining artifacts, the FastICA (Hyv¨arinen
et al.,2004) algorithm for Independent Component
Anal-ysis (ICA) was used in concert with the ADJUST proce-dure for identifying artefact-related EEG signal compo-nents (Mognon et al.,2011). Subsequently, data were re-referenced using an average reference. All data were pro-cessed in Python 2.7 using the open source software pack-age MNE (Gramfort et al.,2013;2014). Figure2gives an overview about the single data processing steps.
Note that our EEG-processing workflow is not confined to a specific EEG-vendor and does not require task-related EEG-recordings.
Notable changes as of July 2015
Adaptive outlier detection To automate detection and re-pair of bad EEG data segments, we developed an adaptive outlier detection procedure. This procedure first selects bad electrodes where more than 50 % of the epochs have a peak-to-peak amplitude higher than 100 µV . The second step consists on computing the variance of each individ-ual channel and its corresponding z-score across all chan-nels. Channels with a z-score greater than 4 are discarded. This operation is repeated four times. The remaining data is then analysed at the epoch level: epochs with more than 10% of the channels outside the 100 µV peak-to-peak am-plitude range are then discarded. Finally, the second step is repeated, but with the standard deviation of the channels
filtered with a 4thorder Butterworh high-pass filter at 25
Hz. In order to use the same set of electrodes for every pa-tients, electrodes marked as “bad” by the outlier algorithm are interpolated using a spherical spline interpolation (
Per-rin et al.,1989). Data was finally re-referenced using an
average reference and baseline corrected over the first 200 ms window preceding the onset of the first sound.
Independent Component Analysis By the time of the construction of the pipeline in 2015, no accurate automated procedure for selection of ICAcomponents has been avail-able. While semi-automated procedures can be used at scale in smaller dataset where manual checking and cor-rection is feasible, the situation is quite different in larger datasets where exhaustive quality checks are expensive in terms of human processing time. In particular, when not correcting wrong labeled ICA components, there is a sub-stantial risk of removing signal of interest. After some ex-perimentation, we therefore decided to refrain from using ICA in this pipeline.
2. Validation of EEG-measures of
consciousness
To validate the extraction of the EEG-measures against the reference implementation, we replicated the main analysis
fromSitt et al.(2014) on univariate classification (cf.
fig-ures 1 and 2, supplement) and we validated the multivari-ate classification against alternative algorithms and imple-mentations (cf. Figure 3, supplement). We further profiled the EEG-measures by evaluating their discriminative per-formance as information was removed from the input data. For this purpose, the original data fromSitt et al.(2014) were used. We considered a subset of patient recordings comprising 69 samples of MCS and 76 samples of VS pa-tients. To emulate the impact of different sensor geometry, the spatial coverage and acquisition settings, the data were spatially (number of sensors) and temporally (sampling fre-quency) subsampled. Results were then recomputed on the subsampled data and compared to the full data. Classifica-tion was based on a support vector machine with an area under the curve (AUC) performance metric. A filter-based feature selection (best k features as defined by univariate F-statistic) and the regularization parameter (C) were tuned using a grid search with 10 fold stratified cross-validation that was repeated 5 times. Figure3depicts measure-wise (average across sensors) central tendencies and dispersion across all subsampled datasets. For details on the compu-tation of the univariate AUC scores, see the supplementary materials.
It can be observed that certain types of measures, for ex-ample the wSMI connectivity measure (King et al.,2013) or evoked response measures, such as the contingent
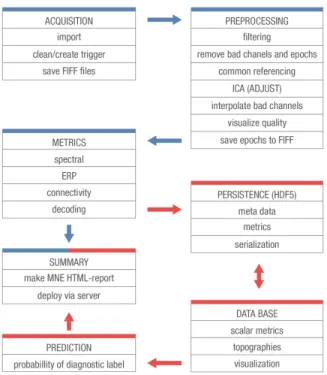
nega-Figure 2. Schematic EEG data-processing workflow. The proce-dure comprises two complementary routines, depicted by blue and red connecting arrows between the steps. Directly after acqui-sition, data are converted in to the FIFF file format (cf.Gramfort
et al.(2013;2014)). Subsequently, the EEG data are cleaned from
environmental noise, intrinsic and physiological artifacts. This is achieved by peak-to-peak amplitude rejection of contaminated data segments and removal of artifact signal components as es-timated from Independent Component Analysis (ICA). Data are then segmented according to task-related events or fixed-length epochs (resting state) and stored to disk. In the next step rele-vant EEG-measures are computed and stored to disk together with meta-data and added to the database. Visual summaries of the re-sults are saved into an HTML report. Fed with EEG-measures from the database, a statistical model is employed to estimate the probability of each diagnostic class. Visual summaries of the pa-tient’s measured EEG-measures and the probability estimates are deployed in form of a second HTML report. The entire procedure is scalable and can be executed locally or remotely on multiple workers in a distributed fashion.
tive variation (CNV) exhibit more performance variability across data inputs. In contrast, information theory mea-sures, e.g., PE, K and low frequency cortical oscillations show little variability, e.g., α, θ and δ. These findings were expected as the connectivity measures naturally ben-efit from higher spatial sampling density, whereas α power can be computed on single favorably located sensors. This latter finding extends previously reported results (Sitt et al.,
2014). Not only are low-frequency oscillations among the
Discriminative performance of EEG-measures across subsampled data
Figure 3. Univariate evaluation of discriminative performance of different EEG-measures as spatial and temporal information is re-moved from the data. New datasets were derived from temporally and spatially subsampling the original data. To generate a set of realistic electrode nets the original number of electrodes (256) was progressively subdivided by two and remaining electrodes were manually selected. They were chosen such that the result-ing electrode net was spatially symmetric and included a subset of standard locations described by the international 10-20 system. In total, 6 electrode nets (256 to 8 electrodes) were compared at 250Hz and 125Hz temporal sampling frequency. The boxplots summarize each EEG-measure individually depicting the central tendency and dispersion of area under the curve (AUC) scores across the datasets. The red lines represent the median, the red squares the mean. The results suggest that certain EEG-measures were more robust across varying density of information in the in-put data. Note that AUC scores below 0.5 indicate a negative relationship between the respective EEG-measure and the target-category. Acronyms for EEG-measures are explained in the sup-plementary materials (cf. Table 1). A multuvariate comparison is depicted in figure4
Automated measurement and prediction of consciousness most robust predictors of consciousness, their computation
is also highly robust across different sensor configurations and temporal sampling rates. This is of high practical rele-vance, as it may inform practitioners about reasonable low cost choices for the assessment of consciousness. For in-stance, the low frequency brain rhythms can be reliably extracted from a few electrodes only using a low tempo-ral sampling frequency. This finding may have practical implication when single measures have to be selected for fast ambulant screening based on low-density EEG. Like-wise, these measures remain robust at reduced sampling rates which may be helpful for mobile EEG acquisition se-tups with limited recording capacity such as for long term recordings. c256 c128 c64 c32 c16 c8 0.55 0.60 0.65 0.70 0.75 0.80 0.85 0.90
Area Under the Curve
Mutlivariate decoding accuracy across subsampled data full decim = 2
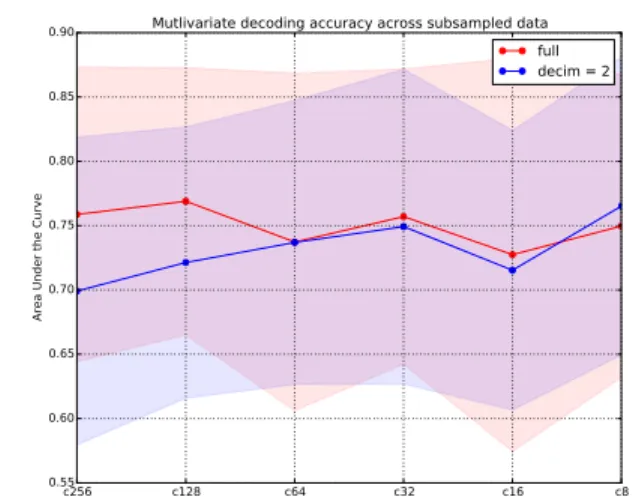
Figure 4. Multivariate evaluation of discriminative performance of different EEG-variables as spatial and temporal information is removed from the data. The points represent cross-validated area under the curve (AUC) scores separately for temporally and spa-tially subsampled versions of the data. The x-axis depicts differ-ent electrode nets, including 256, 128, 64, 32, 16 and 8 electrodes. Lines represent different sampling frequencies, i.e., 250Hz and 125Hz. Areas represent the standard deviation of the score. The overall pattern suggests that spatiotemporal subsampling does not notably affect the classification performance.
Additional insights can be obtained from comparing cross-validated classification performance based on multivari-ate inputs including all the EEG-measures. Figure 4 de-picts such scores for each subsampled version of the in-put data. The findings show considerable overlapping es-timation variance across folds for each dataset, suggest-ing that for multivariate classification the availability of high-density sampling is not particularly relevant. In other words, regular clinical EEG-setups that commonly include between 32 and 64 channels are sufficient to acquire data from which reliable EEG-measures can be computed. To summarize, the experiments provide novel insights
re-garding the stability, or reliability, of the EEG-measures. The univariate results (cf. Figure 3) highlight certain types of measures that are more robust to loss of information than others. In contrast, the multivariate results (cf. Figure 4) demonstrate that removing temporal and spatial informa-tion does not relevantly decrease predictive performance when all information is fed into a statistical model.
3. Conclusion
In the present work we presented an integrated scalable solution for measuring, predicting and guiding clinical di-agnostics of disorders of consciousness (DOC). This ap-proach promotes a translation from neuroscience findings and data science technologies to clinical practice. The val-idation analyses not only suggest a successful implementa-tion of the EEG-measures reported in (Sitt et al.,2014) but also extend our understanding of their practical properties such as their dependency on particular acquisitions setups. Future enhancement in classification and diagnostics are expected from incorporating additional samples (clinical EEG-recordings) and a prediction of the patient’s recovery into the proposed system. Similarly, it should be easily ad-justable to other physiological and pathological conditions in which an evaluation of the subject’s degree of conscious-ness is relevant. This would at least include anesthesia and sleep. Our solution, this way, promotes a diagnostic prac-tice emphasizing brain-circuits disorders (Insel & Cuthbert,
2015).
Acknowledgments
References
Bekinschtein, Tristan A., Dehaene, Stanislas, Ro-haut, Benjamin, Tadel, Franois, Cohen, Laurent, and Naccache, Lionel. Neural signature of the conscious processing of auditory regularities. Pro-ceedings of the National Academy of Sciences, 2009. doi: 10.1073/pnas.0809667106. URL
http://www.pnas.org/content/early/
2009/01/21/0809667106.abstract.
Gramfort, A, Luessi, M, Larson, E, Engemann, D A, Strohmeier, D, Brodbeck, C, Goj, R, Jas, M, Brooks, T, Parkkonen, L, and H¨am¨al¨ainen, M. MEG and EEG data analysis with MNE-Python. Frontiers in Neuroscience, 7 (267), 2013. ISSN 1662-453X. doi: 10.3389/fnins.2013. 00267.
Gramfort, A, Luessi, M, Larson, E, Engemann, D, Strohmeier, D, Brodbeck, C, Parkkonen, L, and H¨am¨al¨ainen, M. MNE software for processing MEG and EEG data. Neuroimage, 86(0):446 – 460, 2014. ISSN
1053-8119. doi: http://dx.doi.org/10.1016/j.neuroimage. 2013.10.027.
Hyv¨arinen, Aapo, Karhunen, Juha, and Oja, Erkki. Inde-pendent component analysis, volume 46. John Wiley & Sons, 2004.
Insel, Thomas R. and Cuthbert, Bruce N. Brain disorders? precisely. Science, 348(6234):499– 500, 2015. doi: 10.1126/science.aab2358. URL
http://www.sciencemag.org/content/
348/6234/499.short.
Jones, Eric, Oliphant, Travis, Peterson, Pearu, et al. SciPy: Open source scientific tools for Python, 2001.
URLhttp://www.scipy.org/. [Online; accessed
2015-05-01].
King, Jean-Rmi, Sitt, JacoboD., Faugeras, Frdric, Ro-haut, Benjamin, ElKaroui, Imen, Cohen, Laurent, Naccache, Lionel, and Dehaene, Stanislas. In-formation sharing in the brain indexes conscious-ness in noncommunicative patients. Current Bi-ology, 23(19):1914 – 1919, 2013. ISSN 0960-9822. doi: http://dx.doi.org/10.1016/j.cub.2013.07.
075. URL http://www.sciencedirect.com/
science/article/pii/S0960982213009366.
Laureys, Steven and Schiff, Nicholas D. Coma and con-sciousness: paradigms (re) framed by neuroimaging. Neuroimage, 61(2):478–491, 2012.
Mognon, Andrea, Jovicich, Jorge, Bruzzone, Lorenzo, and Buiatti, Marco. Adjust: An automatic eeg artifact de-tector based on the joint use of spatial and temporal fea-tures. Psychophysiology, 48(2):229–240, 2011.
Owen, Adrian M, Coleman, Martin R, Boly, Melanie, Davis, Matthew H, Laureys, Steven, and Pickard, John D. Detecting awareness in the vegetative state. Sci-ence, 313(5792):1402–1402, 2006.
Pedregosa, F., Varoquaux, G., Gramfort, A., Michel, V., Thirion, B., Grisel, O., Blondel, M., Prettenhofer, P., Weiss, R., Dubourg, V., Vanderplas, J., Passos, A., Cour-napeau, D., Brucher, M., Perrot, M., and Duchesnay, E. Scikit-learn: Machine learning in Python. Journal of Machine Learning Research, 12:2825–2830, 2011. Perrin, F., Pernier, J., Bertrand, O., and Echallier, J.F.
Spherical splines for scalp potential and current density mapping. Electroencephalography and Clinical Neuro-physiology, 72(2):184 – 187, 1989. ISSN 0013-4694. doi: https://doi.org/10.1016/0013-4694(89)90180-6.
URL http://www.sciencedirect.com/
science/article/pii/0013469489901806.
Schnakers, Caroline, Vanhaudenhuyse, Audrey, Giacino, Joseph, Ventura, Manfredi, Boly, Melanie, Majerus, Steve, Moonen, Gustave, and Laureys, Steven. Diagnos-tic accuracy of the vegetative and minimally conscious state: clinical consensus versus standardized neurobe-havioral assessment. BMC neurology, 9(1):35, 2009. Sitt, J D, King, J-R, El Karoui, I, Rohaut, B, Faugeras, F,
Gramfort, A, Cohen, L, Sigman, M, Dehaene, S, and Naccache, L. Large scale screening of neural signatures of consciousness in patients in a vegetative or minimally conscious state. Brain, 137(8):2258–2270, 2014. Tange, O. Gnu parallel - the command-line power tool.
;login: The USENIX Magazine, 36(1):42–47, Feb 2011.