HAL Id: hal-00145686
https://hal.archives-ouvertes.fr/hal-00145686
Submitted on 11 May 2007
HAL is a multi-disciplinary open access
archive for the deposit and dissemination of
sci-entific research documents, whether they are
pub-lished or not. The documents may come from
teaching and research institutions in France or
abroad, or from public or private research centers.
L’archive ouverte pluridisciplinaire HAL, est
destinée au dépôt et à la diffusion de documents
scientifiques de niveau recherche, publiés ou non,
émanant des établissements d’enseignement et de
recherche français ou étrangers, des laboratoires
publics ou privés.
issues
Florentin Millour, Romain Petrov, Fabien Malbet, Eric Tatulli, Gilles Duvert,
Gérard Zins, Evelyne Altariba, Martin Vannier, Oscar Hernandez, Gianluca Li
Causi
To cite this version:
Florentin Millour, Romain Petrov, Fabien Malbet, Eric Tatulli, Gilles Duvert, et al.. AMBER on the
VLTI: data processing and calibration issues. ESO calibration workshop 2007, Jan 2007, Garching
bei München, Germany. �hal-00145686�
hal-00145686, version 1 - 11 May 2007
AMBER on the VLTI: data processing and
calibration issues
Florentin Millour1 , Romain Petrov2 , Fabien Malbet3 , Eric Tatulli4 , Gilles Duvert3 , G´erard Zins3 , Evelyne Altariba3 , Martin Vannier5 , Oscar Hernandez3, and Gianluca Li Causi6
1
Max-Planck-Institut f¨ur Radioastronomie, fmillour@mpifr-bonn.mpg.de
2
Laboratoire Universitaire d’Astrophysique de Nice
3
Laboratoire d’AstrOphysique de Grenoble
4
Observatorio di Arcetri
5
European Southern Observatory
6
Rome Astronomical Observatory
1 Introduction
We present here the current performances of the AMBER / VLTI instrument for standard use and compare these with the offered modes of the instrument. We show that the instrument is able to reach its specified precision only for medium and high spectral resolution modes, differential observables and bright objects.
For absolute observables, the current achievable accuracy is strongly lim-ited by the vibrations of the Unit Telescopes, and also by the observing pro-cedure which does not take into account the night-long transfer function mon-itoring.
For low-resolution mode, the current limitation is more in the data reduc-tion side, since several effects negligible at medium spectral resolureduc-tion are not taken into account in the current pipeline.
Finally, for faint objects (SNR around 1 per spectral channel), electromag-netic interferences in the VLTI interferometric laboratory with the detector electronics prevents currently to get unbiased measurements. Ideas are under study to correct in the data processing side this effect, but a hardware fix should be investigated seriously since it limits seriously the effective limiting magnitude of the instrument.
Spatial filtering Anamorphosis Recombination Spectral dispersion
Single-mode fibers
Cylindrical optics
Spectrograph Raw Data Output pupil λ x P1 P2 IF P3
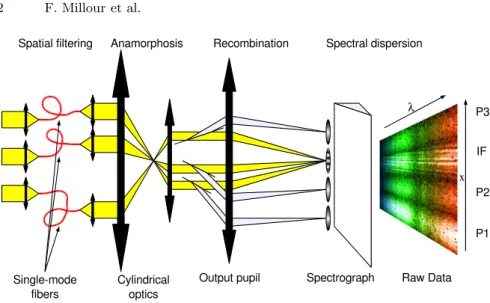
Fig. 1. The AMBER optical schematics, showing the principal elements of the instrument: the spatial filtering is made with optical fibers, then an anamorphosis optics shrinks the beam in one direction to feed it into a long slit spectrograph where the spectrally dispersed fringes are finally imaged on the detector.
2 The AMBER instrument
2.1 Short description
AMBER is the near-infrared interferometric re-combiner of the VLTI. Its gen-eral and technical descriptions are held in the two articles Petrov et al. (2007); Robbe-Dubois et al. (2007). In short, it features simultaneous observations in J, H and K bands observations, low (R=35), moderate (R=1500) and high (R=12000) spectral resolutions, and 3 telescopes operation. The use of optical fibers to improve calibration and the multiaxial scheme adopted complete this short view of the instrument (see Fig. 1). The AMBER instrument features also a limited number of pixels in the fringes leading to the use of very specific algorithms for data reduction.
2.2 AMBER data processing: principle
The AMBER data processing is based on the fitting in the image plane of the fringe pattern. One can find a complete description of the process in the article Tatulli et al. (2007b). The resulting basic information is a measurement of the coherent flux (instantaneous complex coherence factor multiplied by the flux) for each single frame. Three time-averaged squared visibility, a closure phase and three differential phases can be extracted from these measurements, us-ing respectively specific techniques such as quadratic estimator (Perrin 2003),
AMBER/VLTI data calibration 3 bi-spectrum estimator (Hofmann & Weigelt 1990) and inter-spectrum esti-mator (Beckers 1981). Added to these interferometric observables, AMBER provides the object spectrum which adds simultaneous velocimetric measure-ments to the purely geometric measuremeasure-ments brought by the interferometric observables.
3 AMBER and the VLTI
3.1 How AMBER behaves on VLTI ?
The AMBER instrument was installed and tested at the Paranal observatory (ESO, Chile) during the month of may 2004 (Robbe-Dubois et al. 2004). Since then, a series of commissioning were performed to check the performances of the AMBER instrument together with the VLTI infrastructure. These first tests showed that the UTs have vibrations that affects strongly the AMBER signal (see Fig. 2) with a drastic average instrumental visibility decrease with regards to specifications (20% instead of 80%, leading to a loss of a factor 4 in signal to noise ratio). These vibrations comes mainly from the Coud´e train of the UTs and are in the process of being damped by ESO. However, one has to consider using the AMBER instrument in the today limited state of VLTI, taking into account these vibrations.
Therefore, changes in observing and data processing strategies were needed for AMBER to successfully be opened to the community:
• A longer exposure time (i.e. more individual short exposure frames) is needed to maximize the chances to get some “useful” frames for the data processing.
• A frame-selection process, i.e. a removal of spurious frames where there is either no fringes, no flux or a too high piston has been added to the data processing software.
3.2 The standard operating mode performances
These observing and data processing strategies are used today on the AM-BER/VLTI instrument, allowing a better visibilities histogram (closer to a Gaussian and therefore easier to compute realistic error bars), but are quite observing time-consuming (about 50 to 90% of the shutter-opened observing time is lost in practice, added to the already large overheads linked to optical interferometry). This allows an internal precision (i.e. visibilities scatter inside an exposure time) of roughly 0.01 to 0.05 for a bright star (K ≤ 4 at medium spectral resolution), depending on the observing conditions (wind, vibrations, seeing). However, in practice, the AMBER visibilities precision cannot be bet-ter than 0.05 due to several strong limitations coming from the infrastructure itself and from the observing strategy used at Paranal.
0 200 400 600 800 0.0 0.5 1.0 0 200 400 600 800 0.0 0.5 1.0 0 200 400 600 800 0.0 0.5 1.0 V 2 Base 1 V 2 Base 2 V 2 Base 3 SNR2 0.5 1.0 0 1 2 3 0.5 1.0 0 1 2 3 4 0.5 1.0 0 1 2 3 Base 1 Base 2 Base 3 V2
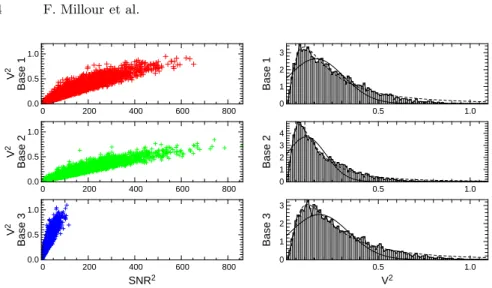
Fig. 2.Left: A correlation plot between fringe SNR and visibilities shows a strong correlation, linked to the domination of the jitter effect (blurring of the fringes by their move during integration time).
Right: AMBER squared visibilities histogram on the same star, showing the highly non-symmetric effect induced by UT vibrations. The resulting histogram looks like a log-normal distribution (dashed line) and not like a Gaussian distribution (solid line), which makes it difficult to extract an average and an error.
• The time between two measurements cannot be less than 30 min (for star and calibrators, i.e. 1h between 2 science measurements), leading to very large time gaps in the instrumental/atmospheric/vibrations transfer func-tion (see Fig. 3). This prevents today from interpolating such transfer function and gain in precision and stability of the measurement.
• The individual frames exposure times changes a lot during the night (see Fig. 3), leading to miscomparisons between full-night data sets, which provokes a typical night-long visibilities scatter of 0.05. This translates into typical calibrated visibilities errors of about 0.07.
The table 1 summarizes the current situation with typical observing con-ditions and the AMBER/VLTI instrument. Please note that this is an indica-tive table and does not represent all the conditions, which can change strongly depending on the air-mass, seeing, vibrations conditions, etc. Therefore, im-provements can be expected for AMBER in standard mode, following several tracks for improving operation:
• Restrain strongly the number of available and effectively used exposure times during the observing nights. This would probably enhance the final transfer function scatter and therefore the calibration accuracy.
• Accelerate the time between observations by working on the telescopes overheads: from the beginning of AMBER operation to today, huge
im-AMBER/VLTI data calibration 5 28ms 34ms 41ms 34ms 50ms 34ms 50ms hd63744 HD86440 HD87643 hd101531−0 HD109787 HD87643 epsoph B02 RS Oph 0 2 4 6 8 0.0 0.5 1.0
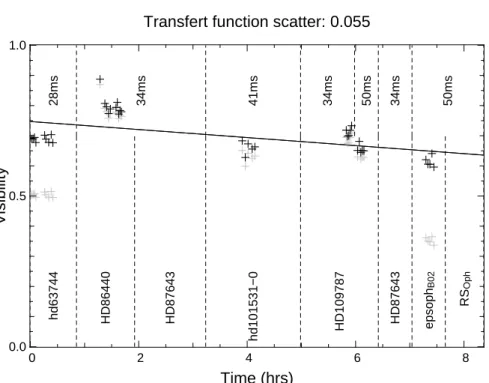
Transfert function scatter: 0.055
Time (hrs)
Visibility
Fig. 3. Instrument+atmosphere transfer function during the night of 17/02/2006. In gray are the original visibilities and in black the visibilities corrected from the intrinsic calibration star’s visibilities. The stars where no visibilities are plotted are the science stars. One can see the frame exposure time dependence of the transfer function for the star HD 109787.
Table 1.Error bars order of magnitude one can expect from the AMBER instrument in the current status using UTs for calibrated measurements. Visibility errors are dominated by the transfer function error and not by internal visibilities scatter. LR differential data reduction is highly biased by the atmospheric phase bias and the errors given here take into account this bias as an error. The figures given here can be seen as the result of a hard work data processing and very careful calibration process and not as a pipeline black-box output error estimate.
LR (R=35) MR (R=1500) Observable Bright star (K = 5) Bright star (K = 3.5)
V 0.07 0.07
Vdiff 0.1 0.01
φdiff (rad.) 0.1 0.01 ψ123 (rad.) 0.01 0.05
−100 0 100 0.000
0.002 0.004 0.006
Closure phase (degrees)
probability
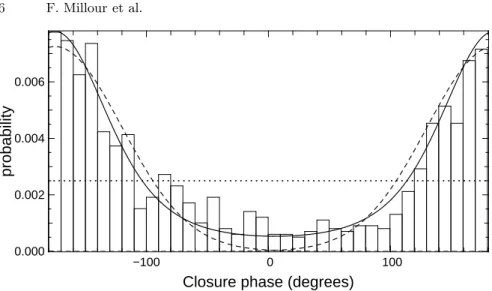
Fig. 4. Example of a closure phase histogram on an observed star (ǫ Sco, courtesy of O. Chesneau), illustrating the difference between a Gaussian distribution (dashed line) and a wrapped phase distribution (solid line): the phase distribution is in-between a Gaussian-like (dashed line) and a white noise distribution (dotted line), leading to a problematic estimation of the error bars.
provements have been achieved, and the arrival of FINITO will improve again these overheads.
• Improve the data processing software, in terms of accuracy, so it take into account the identified problems and proposed solutions. An effort is also needed in terms of ergonomy and documentation.
3.3 Closure phase and differential phases
Due to the low number of frames where all three fringes patterns from the three baselines are present together, the closure phases are very much affected by the current state of the VLTI. Therefore, the best achievable closure phase accuracy on a bright star is of the order of 10−2 radians, i.e. ∼1◦, in low
spectral resolution, and about 10−1 radians, i.e. ∼10◦ in medium spectral
resolution. For “standard” applications, this is in general sufficient, but for high dynamics or high accuracy measurements, this low precision is very much killing the use of such observable. Added to that, the specific behaviour of phases obliges one to compute very specifically the error bars (see Fig. 4), resulting in under-evaluated error bars in the current data processing software and very noisy data (but this will be solved in the next releases).
The situation on differential phases is much better, with already reached 10−2 radians accuracy at medium spectral resolution (Meilland et al. 2007b)
and 10−3 radians accuracy (but with a 10−1 radians bias) at low spectral
AMBER/VLTI data calibration 7
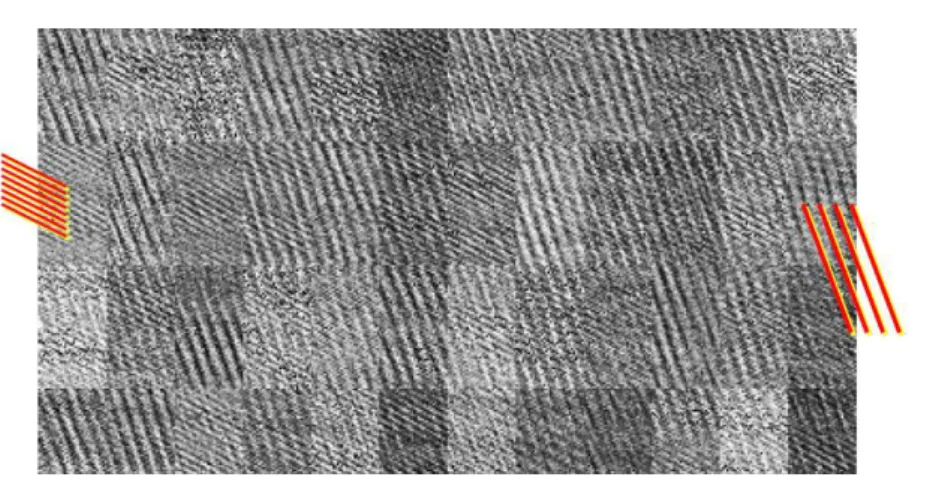
Fig. 5.AMBER detector fringes induced by electromagnetic interferences (Li Causi et al. 2007).
amount of water vapour are still under investigation and the calibration of such biases for low spectral resolution is still under development.
3.4 The low flux issue
For low number of photons, the AMBER signal switches from a photon-noise driven behaviour to a detector-noise driven one. In case the detector behaviour is well known, this signal with few photons is workable with a lower signal-to-noise regime than with high flux. However, for AMBER, the detector noise behaviour has changed between the integration laboratory in Grenoble in 2003 and the Paranal interferometric laboratory where it is installed today: electromagnetic interferences from an unknown source occurs and creates a correlated noise which appears as “detector fringes” (see Fig. 5). Therefore in the current data reduction scheme and knowledge of the detector put in the AMBER software, low flux data reduction results in non reliable results.
Therefore, while ESO puts manpower to solve this problem in the hardware side (Mardones 2007), this problem is also under investigations in the data reduction software side (Li Causi et al. 2007), in order to achieve a workable data reduction solution for already observed targets. The idea is there to evaluate the detector correlated noise from exposures without fringes (dark or photometric beams) and to try to subtract it from the interferometric beam where the pattern affects the fringes. A prototype version of this algorithm can be found on the AMDC7
web page.
However, this study is only for the already-acquired data and this problem affects also the on-site real time acquisition of the targets, preventing AM-BER to reach its goal limiting magnitude without the external fringe tracker FINITO.
7
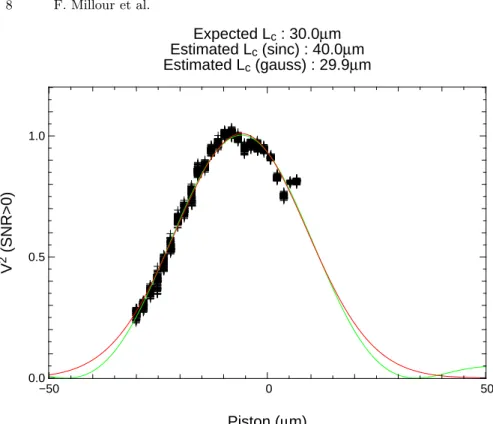
−50 0 50 0.0 0.5 1.0 Piston (µm) V 2 (SNR>0) Expected Lc : 30.0µm Estimated Lc (sinc) : 40.0µm Estimated Lc (gauss) : 29.9µm
Fig. 6.Coherence length (Lc) dependence of the visibilities of AMBER measured in
lab. using the internal piezo mirrors of the instrument. It corresponds to a Gaussian of FWHM Lc.
3.5 The low resolution issues
AMBER is facing a series of data processing issues very specific to low res-olution observations, and which prevents it from working in an optimal way. We present here a series of identified points to enhance significantly the data processing in this mode:
• The jitter effect affecting the visibilities (Fig. 2) is very important in the way that it introduces an “artificial” slope to the visibilities, very hard to calibrate since this jitter effect cannot be calibrated efficiently in the current state of the infrastructure.
• The coherence length visibility decrease plays also an important role (see Fig. 6), and is difficult to calibrate.
• Problems of bias removal in the squared visibilities introduce a visibility flux dependence, which is highly problematic for low resolution, since be-tween the center and the edges of a band, a difference of flux of up to 100 can be found.
AMBER/VLTI data calibration 9 All these issues except the first one have an associated solution, included hopefully in the next version of the AMBER data reduction software. The jitter issue is still under investigation and has not reached up to now a level of comprehension allowing us to present a solution. For this issue, the use of FINITO (available first with ATs in P80 and probably soon after with the UTs) is expected to improve a lot the problem.
4 Conclusion
We presented here an overview of what AMBER can do in the current state of the instrument, data reduction pipeline and infrastructure. The table 1 gives typical figures (taken from the personal experience of the authors, and that must be taken as indicative values and not as specified performances) of what can reach in practice the AMBER instrument using the Unit Telescopes of VLTI. With the use of Auxiliary Telescopes and FINITO in a near future, these figures are expected to improve a lot.
As one can see, the instrument does not work in optimal conditions and there is room for near future improvements as well as long term instrumental study to correct all the expected and unexpected effects on the AMBER sig-nal. However, the huge potential of the AMBER instrument has been already proved by the numerous first articles published in a special feature of A&A (Malbet et al. 2007; Tatulli et al. 2007a; Meilland et al. 2007b,a; Weigelt et al. 2007; Millour et al. 2007; Chesneau et al. 2007; Domiciano de Souza et al. 2007), and many other new successful observing programs can be ex-pected for the future, even with the infrastructure-limited performances of the instrument.
Acknowledgements
This paper is based on data taken at the Paranal observatory, ESO, Chile, and during the AMBER integration in Grenoble in 2003.
The AMBER project (The structure and members of the AMBER Consortium can be found in the AMBER website8
) has been founded by the French Centre National de la Recherche Scientifique (CNRS), the Max Planck Institute f¨ur Ra-dioastronomie (MPIfR) in Bonn, the Osservatorio Astrofisico di Arcetri (OAA) in Firenze, the French Region Provence Alpes Cˆote D’Azurand the European Southern Observatory (ESO).
The AMBER data reduction software amdlib is freely available on the AMBER website. It has been linked to the open source software Yorick9
to provide the user friendly interface ammyorick.
8
http://amber.obs.ujf-grenoble.fr
9
References
Beckers, J. M. 1981, Lowell Observatory Bulletin, 9, 165
Chesneau, O., Nardetto, N., Millour, F., et al. 2007, A&A, 464, 119
Domiciano de Souza, A., Driebe, T., Chesneau, O., et al. 2007, A&A, Special AM-BER issue (4134)
Hofmann, K.-H. & Weigelt, G. 1990, in Digital image synthesis and inverse optics; Proceedings of the Meeting, San Diego, CA, July 9-13, 1990 (A92-18776 05-74). Bellingham, WA, Society of Photo-Optical Instrumentation Engineers, 1990, p. 522-525., ed. A. F. Gmitro, P. S. Idell, & I. J. Lahaie, 522–525
Li Causi, Antoniucci, & Tatulli. 2007, A&A, submitted
Malbet, F., Benisty, M., de Wit, W.-J., et al. 2007, A&A, 464, 43 Mardones, P. 2007, AMBER image interferences report, Tech. rep., ESO Meilland, A., Millour, F., Stee, P., et al. 2007a, A&A, 464, 73
Meilland, A., Stee, P., Vannier, M., et al. 2007b, A&A, 464, 59 Millour, F., Petrov, R. G., Chesneau, O., et al. 2007, A&A, 464, 107
Millour, F., Vannier, M., Petrov, R. G., Lopez, B., & Rantakyr¨o, F. 2006, in IAU Colloq. 200: Direct Imaging of Exoplanets: Science and Techniques, ed. C. Aime & F. Vakili, 291–296
Perrin, G. 2003, A&A, 400, 1173
Petrov, R. G., Malbet, F., Weigelt, G., et al. 2007, A&A, 464, 1 Robbe-Dubois, S., Lagarde, S., Petrov, R. G., et al. 2007, A&A, 464, 13
Robbe-Dubois, S., Petrov, R. G., Lagarde, S., et al. 2004, in New Frontiers in Stellar Interferometry, Proceedings of SPIE Volume 5491. Edited by Wesley A. Traub. Bellingham, WA: The International Society for Optical Engineering, 2004., p.1089, ed. W. A. Traub, 1089
Tatulli, E., Isella, A., Natta, A., et al. 2007a, A&A, 464, 55 Tatulli, E., Millour, F., Chelli, A., et al. 2007b, A&A, 464, 29 Weigelt, G., Kraus, S., Driebe, T., et al. 2007, A&A, 464, 87