HAL Id: hal-03052900
https://hal.archives-ouvertes.fr/hal-03052900
Submitted on 10 Dec 2020
HAL is a multi-disciplinary open access
archive for the deposit and dissemination of
sci-entific research documents, whether they are
pub-lished or not. The documents may come from
teaching and research institutions in France or
abroad, or from public or private research centers.
L’archive ouverte pluridisciplinaire HAL, est
destinée au dépôt et à la diffusion de documents
scientifiques de niveau recherche, publiés ou non,
émanant des établissements d’enseignement et de
recherche français ou étrangers, des laboratoires
publics ou privés.
NEARBY OPEN CLUSTERS SHAPE :
THREE-DIMENSIONAL GAUSSIAN MIXTURE
MODEL AND TWO-DIMENSIONAL DENSITY MAPS
Y Tarricq, L Casamiquela, C Soubiran
To cite this version:
Y Tarricq, L Casamiquela, C Soubiran.
NEARBY OPEN CLUSTERS SHAPE :
THREE-DIMENSIONAL GAUSSIAN MIXTURE MODEL AND TWO-THREE-DIMENSIONAL DENSITY MAPS.
Annual meeting of the French Society of Astronomy and Astrophysics, May 2019, Nice, France.
�hal-03052900�
SF2A 2019
P. Di Matteo, O. Creevey, A. Crida, G. Kordopatis, J. Malzac, J.-B. Marquette, M. N’Diaye, O. Venot (eds)
NEARBY OPEN CLUSTERS SHAPE : THREE-DIMENSIONAL GAUSSIAN MIXTURE
MODEL AND TWO-DIMENSIONAL DENSITY MAPS
Y. Tarricq
1, L. Casamiquela
1and C. Soubiran
1Abstract. We use new memberships from Gaia DR2 to investigate the shape of the nearest open clusters. For open clusters closer than 250 pc from the Sun, we fit 3D ellipsoids on the spatial distribution of the members. At higher distances, the radial effect due to the uncertainties on the parallax measurements introduces a strong bias in the spatial distribution of members. Therefore, for more distant open clusters, we compute density maps on the sky to study their spatial properties and search for correlations with age and galactic environments of the clusters.
Keywords: Gaia, open clusters, solar neighborhood
1 Introduction
Open Clusters (OCs) are gravitationnaly bound groups of stars which formed from the same giant molecular cloud. The members of an OC share therefore the same characteristics such as their age, metallicity, proper motions or distances. These stars covering a wide range of mass and evolutionnary stages, OCs are ideal laboratories to better constrain formation and stellar evolution theories. The determination of these stars’ physical properties being much more accurate than for field stars, OCs and their members are also widely used as reference objects in order to better constrain and validate large observational surveys. Finnaly, studying these objects allows us to better understand the galactic disk’s history. Over their lifespan, OCs indeed dissolve themselves into the galactic disk. The study of this process, in particular by focusing on evolved OC is thus a way to know with more details the dynamical properties and stellar populations of our galaxy. In particular, the study of the shape of OCs will give us hints of the disruption process at stake in our galaxy depending on the age of the clusters, their environment,... In the first section, we describe the data we take advantage of and explain why we had to consider two ways of handling OCs, depending on their distance. In the next section, we explain the two different method we used to evaluate the shape of OCs and our results.
2 Data
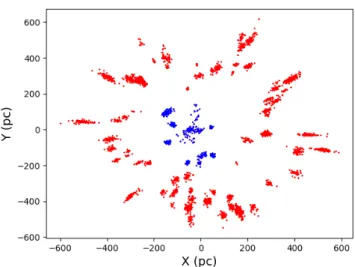
We take advantage of Gaia DR2 unprecedented astrometric accuracy containing more than 1.6 billion sources with five-parameter solutions. We focused on the OCs already identified in the solar neighborhood and con-structed a sample composed of 84 OCs located closer than 550pc. To investigate the shape of OCs, we have considered the members with a membership probability higher than 0.8 from Cantat-Gaudin et al. (2018), Gaia Collaboration et al. (2018) and R¨oser et al. (2019) for the tail of the Hyades. In Fig. 1, we have plotted the X-Y distribution of the members of our sample. A selection has been performed using the astrometric quality cuts suggested by Sch¨onrich et al. (2019). Positions in the X-Y plane have been calculated with distances from Bailer-Jones et al. (2018). The strong radial effect seen here shows that even with bayesian distances and drastic quality cuts, there is still a strong bias in the spatial distribution of members. Therefore we limit our 3D study to the 14 OCs which lie within 250 pc from the Sun : Alessi 13, Blanco 1, the Hyades, Coma Berenices, the Pleiades, NGC 2632, NGC 2451A, IC 2391, IC 2602, Platais 3, Platais 8, Platais 9, Mamajek 1 and Alpha Persei.
1 Laboratoire d’Astrophysique de Bordeaux, 33600 Pessac, France
c
162 SF2A 2019
Fig. 1. Distribution of the members from our OCs sample in the X-Y plane, centered on the Sun. Blue dots indicate the closest OCs for which the 3D shape has been fitted.
3 Results
For the 14 nearest OCs, we have fitted a Gaussian Mixture Model (GMM) composed of two gaussians in order to modelize their shape. This allows us to consider the evolution of both the cores and the outer parts of the OCs by modelling them as ellipsoids. However, because of the strong radial effect seen in Fig. 1, we chose a different approach to study more distant OCs’ shapes. For each OC which is not too extended on the sky, the position of its members has been projected on a tangential plane and we are computing density maps of these distributions by using a Gaussian kernel. An exemple of these two different approaches is shown on Fig. 2
1 2 3 BH99 1 2 3 NGC7058 1 2 3 RSG1 1 2 3 Roslund5
Fig. 2. Left: Example of the fit of two Gaussians on the spatial distribution of Platais 3 members. The color scale represents the membership probability of each star. Right: Density maps with contours computed for BH99, NGC7058, RSG1 and Roslund5. The ellipses represent the maximum extent of the 1, 2 and 3 σ contour. Red cross represent the highest density pixel and black cross represent the OC’s center computed in the litterature.
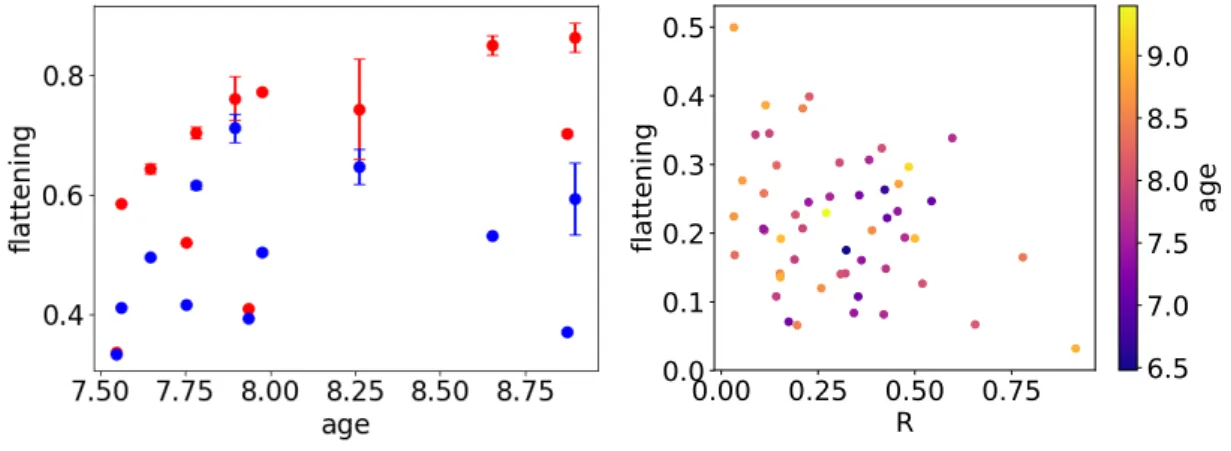
As seen in the left part of Fig 3 which focus on closer OCs three dimensional shapes, the flattening (defined as 1 − ca with c the semi minor axis and a the semi major axis) of outer OCs’ parts tends to increase but we can’t reach a conclusion for the inner parts due to the low amounts of points and their high dispersion. For more distant OCs, while we expect to see the flattening of the 1σ contour to increase with age, we couldn’t find
Nearby Open Clusters shape 163
such a correlation but as shown in the right part of Fig 3, the flattening tends to decrease for more populated clusters.
0.00 0.25 0.50 0.75
R
0.0
0.1
0.2
0.3
0.4
0.5
flattening
6.5
7.0
7.5
8.0
8.5
9.0
age
Fig. 3. Left: Evolution of the flattening of both cores (in blue) and outer parts (in red) for the nearest OCs with age. Right: Evolution of the flattening of the 1 σ contour ellipse of the OCs with the ratio R meaning the number of members over the number of field stars in a 10pc sphere centered on the cluster. The color scale represents OCs’ ages.
4 Conclusions
We have highlighted that despite the unprecedented astrometric accuracy of Gaia DR2, the study of OCs shapes in three dimensions is still very difficult due to the increase of parallax uncertainties with distance. We focused on the closest OCs which lie closer than 250 pc from the Sun. By fitting a GMM to each of them, we noticed that their external enveloppe tends to be more and more elongated as age increases. This is consistent with what was expected : an increase of outer parts’ flattening wich are disrupted by the OCs encounters. For the clusters located between 250 pc and 550pc from the Sun, we had to restrain our study to their shape in two dimensions. This still allowed us to notice that the densest clusters tend to be more spherical than others, due to their strong gravitational binding.
We acknowledge support from the ”programme national de physique stellaire” (PNPS) and from the ”programme national cos-mologie et galaxies” (PNCG) of CNRS/INSU.
References
Bailer-Jones, C. A. L. et al. 2018, AJ, 156, 58 Cantat-Gaudin, T. et al. 2018, A&A, 618, A93
Gaia Collaboration, Babusiaux, C., et al. 2018, A&A, 616, A10 R¨oser, S., Schilbach, E., & Goldman, B. 2019, A&A, 621, L2 Sch¨onrich, R., McMillan, P., & Eyer, L. 2019, MNRAS, 487, 3568