Conformational dynamics of supramolecular protein assemblies
The MIT Faculty has made this article openly available. Please sharehow this access benefits you. Your story matters.
Citation Kim, Do-Nyun, Cong-Tri Nguyen, and Mark Bathe. “Conformational Dynamics of Supramolecular Protein Assemblies.” Journal of Structural Biology 173, no. 2 (February 2011): 261–270.
As Published http://dx.doi.org/10.1016/j.jsb.2010.09.015
Publisher Elsevier B.V.
Version Author's final manuscript
Citable link http://hdl.handle.net/1721.1/108611
Terms of Use Creative Commons Attribution-NonCommercial-NoDerivs License
1
Conformational Dynamics of Supramolecular Protein Assemblies
Do-Nyun Kim, Cong-Tri Nguyen†, Mark Bathe*
Department of Biological Engineering Massachusetts Institute of Technology
Cambridge, MA, 02139, USA
*Corresponding author:
Mark Bathe
77 Massachusetts Avenue Building NE47, Room 223 Cambridge, MA 02139, U.S.A. Tel. +1-617-324-5685
Fax +1-617-324-7554 [email protected]
E-mail addresses: [email protected] (Do-Nyun Kim), [email protected] (Cong-Tri Nguyen), and [email protected] (Mark Bathe)
†Present address: Center for Biophysics and Computational Biology, University of Illinois at Urbana-Champaign,
2
ABSTRACT
Supramolecular protein assemblies including molecular motors, cytoskeletal filaments, chaperones, and ribosomes play a central role in a broad array of cellular functions ranging from cell division and motility to RNA and protein synthesis and folding. Single-particle reconstructions of such assemblies have been growing rapidly in recent years, providing increasingly high resolution structural information under native conditions. While the static structure of these assemblies provides essential insight into their mechanism of biological function, their dynamical motions provide additional important information that cannot be inferred from structure alone. Here we present an unsupervised computational framework for the analysis of high molecular weight assemblies and use it to analyze the conformational dynamics of structures deposited in the Electron Microscopy Data Bank. Protein assemblies are modeled using a recently introduced coarse-grained modeling framework based on the finite element method, which is used to compute equilibrium thermal fluctuations, elastic strain energy distributions associated with specific conformational transitions, and dynamical correlations in distant molecular domains. Results are presented in detail for the ribosome-bound termination factor RF2 from Escherichia coli, the nuclear pore complex from Dictyostelium discoideum, and the chaperonin GroEL from E. coli. Elastic strain energy distributions reveal hinge-regions associated with specific conformational change pathways, and correlations in collective molecular motions reveal dynamical coupling between distant molecular domains that suggest new, as well as confirm existing, allosteric mechanisms. Results are publically available for use in further investigation and interpretation of biological function including cooperative transitions, allosteric communication, and molecular mechanics, as well as in further classification and refinement of electron microscopy based structures.
KEY WORDS
3
INTRODUCTION
Single-particle reconstructions of supramolecular protein assemblies deposited in the publically accessible Electron Microscopy Data Bank (EMDB, http://www.emdatabank.org/) have been growing rapidly in recent years, representing a total of approximately 250 distinct structures in 2009 [1, 2]. The EMDB covers a range of supramolecular assemblies including viruses as the dominant class, and RNA binding proteins and protein kinases as major subclasses (Figure 1). Recent growth of the EMDB parallels early growth of the Protein Data Bank (PDB), which has developed to include tens of thousands of protein crystal structures since its inception in 1971 [3, 4]. While the static structure of proteins provides invaluable insight into their
biological function, their conformational dynamics often play an additional important role in understanding their function mechanistically [5-7].
Normal mode analysis (NMA) has proven to be an effective computational approach to investigate biologically relevant collective motions about a representative ground-state structure, or ensemble thereof [8]. The primary advantage of NMA over molecular or Brownian dynamics is its relative computational efficiency, which is a result of the harmonic approximation of atomic motions about the ground-state conformation, as well as the neglect of explicit solvent degrees of freedom. Computational efficiency is further enhanced in NMA by using coarse-grained modeling approaches that reduce the number of protein degrees of freedom, which has been essential to facilitating the analysis of high molecular weight supramolecular assemblies. Popular approaches include the Rotational Translational Blocks (RTB) procedure [9], which requires atomic coordinates for the underlying protein structure, the Gaussian [10-13] and Elastic Network Model (ENM) [14], the Rigid-Cluster Model [15-17], and more recently the Finite Element Method (FEM) [18]. The FEM is a well established numerical procedure with solid
4
theoretical foundations that has been developed over several decades to be applied to a broad range of continuum and molecular-level dynamical phenomena [19-21]. The FEM provides a natural framework for the computation of conformational dynamics and mechanics of high molecular weight proteins and their assemblies based on EM reconstructions because the model is defined using a closed molecular surface, which is naturally provided by single-particle EM reconstructions. In the FE framework employed here, proteins are modeled as homogeneous isotropic elastic bodies characterized by a mean mass density and elastic stiffness, which has been shown to reproduce quantitatively atomic-level protein fluctuations and correlations computed using all-atom NMA [18]. Accurate prediction of atomic motions using the FEM is attributed to its preservation of detailed molecular shape, even for high molecular weight protein assemblies.
While several data banks and servers [22-27] exist to disseminate publically the
conformational dynamics of protein structures deposited in the PDB, similar data banks do not exist at present for the EMDB. Such a data bank would support both further computational analyses to gain insight into the biological function of high molecular weight protein assemblies lacking atomic structure, as well as potentially serve as a basis set for classification in single-particle reconstruction [28]. Toward this end, here we establish an unsupervised computational framework to analyze the conformational dynamics of structures deposited in the EMDB and store them in a publically accessible online data bank*. In this framework, the molecular surface of EMDB entries are computed and validated for computation of normal modes using the FEM [18]. Normal modes may be used to calculate conformational properties including root-mean-square fluctuations of the molecules in thermal equilibrium, elastic strain energy densities
5
corresponding to biologically relevant conformational changes, and correlations in collective dynamical motions that may relate to cooperative or allosteric mechanisms. Individual normal mode shapes and frequencies are provided together with the molecular models used to perform the analyses, which may be used in further FE-based analyses of dynamical and mechanical response (Figure 2). Results for the ribosome-bound termination factor RF2 from Escherichia
coli, the nuclear pore complex from Dictyostelium discoideum, and the bacterial chaperonin
GroEL from E. coli are presented in detail here to illustrate the utility of the foregoing results.
MATERIAL AND METHODS
Structures in the EMDB are analyzed using an automated procedure that consists of several distinct computational steps (Figure 3A): (1) retrieval of the EM density map; (2) molecular surface computation and discretization; (3) discretized molecular surface evaluation and repair; (4) FE model generation and normal mode analysis; and (5) results processing. The EMDB is monitored regularly to determine when new structures suitable for conformational dynamics analysis are deposited. To date, the preceding analysis approach has been applied to 681 EMDB entries with 453 entries solved successfully. The remaining entries are excluded from the analysis because 55 entries are on hold by the EMDB, 31 entries are tomograms, 10 entries do not provide contour levels or molecular weights from which to determine the molecular surface, 87 entries consist of disconnected multiple bodies, and 45 entries had surface meshes that could not be repaired using the current approach (Figure 3B and Table S1). Proteins are classified according to their biological function by title and sample name key words provided by the EMDB (Figure 1).
6
Molecular surface computation and discretization
For computation of the molecular surface in step 2, the suggested contour level provided in the EMDB is used unless no such contour level is provided. In this case, the molecular weight is used instead (four entries), where the contour level corresponding to the given molecular volume assuming a protein mass density of 1.35 g/cm3 is employed [29]. If neither the contour
level nor the molecular weight of the complex is provided, the EMDB entry is classified as “molecular surface indeterminable” and no analysis is performed (ten entries, Table S1). An alternative to using a simple molecular-volume-based contour level is to use one of the surface determination algorithms employed previously in NM studies of EM maps [30-33]. Additionally, in several cases structures consisting of disconnected multiple bodies are obtained using the suggested contour level, in which case the entry is flagged as having “disconnected multiple bodies” and no analysis is performed (87 entries, Table S1). Several examples of such maps are presented in Supplementary Material (Figure S1). Discretization of the molecular surface is performed using the marching cubes algorithm [34] implemented in Chimera [35]. The triangulated surface is subsequently exported in OBJ format, a geometry definition file format originally developed by Wavefront Technologies, Inc., Santa Barbara, CA.
In general, the triangulated molecular surface generated using Chimera contains small isolated fragments where an “isolated fragment” is defined to be a closed surface that consists of fewer than 10% of the number of triangular faces that forms the largest structure in the map. It additionally often contains intersecting, overlapping, degenerate, and/or non-manifold surface triangles. Because the FEM requires unique, closed surfaces for the generation of a volumetric mesh, surface mesh repair is required in step 3 prior to performing FE-based NMA (Figure S2).
7
Surface mesh filters available in Meshlab [36] are used for this purpose. Meshlab reads the OBJ file format exported from Chimera and exports the filtered molecular surface in STL file format, which is native to the stereolithography CAD software created by 3D Systems, Inc., Rock Hill, SC. The resulting STL file from Meshlab is imported to the commercially available Finite Element Analysis program ADINA (ADINA R&D, Inc., Watertown, MA), which is used to generate the 3D FE volume mesh consisting of 4-node tetrahedral finite elements [37]. If mesh repair is impossible using Meshlab, then the EMDB entry is classified as “failed in molecular surface repair” and no further analysis is performed (45 entries, Table S1).
The mesh filtering and repair scheme employs several filters available in Meshlab. The original surface mesh obtained from Chimera is first processed using basic filters with default parameters that remove duplicate faces, unreferenced vertices, zero-area faces, self-intersecting faces, isolated fragments, and non-manifold faces. Default parameters are additionally used to close holes that are in the original surface mesh and are created by removing defective faces. In cases where closing holes keep re-introducing problems with the surface, the surface mesh is refined successively, smoothened, and coarsened, where “Midpoint subdivision” [38],
“Laplacian smooth” [39] and “Quadratic edge collapse decimation” [40] are employed for these procedures, respectively. The surface mesh is processed again using basic filters to remove defective faces that may be re-introduced during the mesh coarsening.
Finite element model generation and normal mode analysis
In step 3, the FEM is used to calculate normal modes based on the three-dimensional volume mesh. While twenty normal modes are chosen for the initial database because they generally describe approximately 60–90% of the total magnitude of equilibrium thermal
8
fluctuations (Figure S3), the database is currently being expanded to include results from 100 normal modes. Additional normal modes may easily be calculated using the provided FE model when desired, in addition to FE-based simulation of mechanical response properties such as viral capsids [41, 42]. Proteins are modeled as homogeneous linear isotropic materials characterized by three independent effective material parameters: the Young’s modulus (E ), the mass density
(), and Poisson’s ratio ( ), where proteins are assumed to have mass density 1.35 g/cm3 and Poisson’s ratio 0.3 [43], which is typical of crystalline solids. While the effective Young’s modulus is generally unknown for proteins, it can be obtained by fitting thermal fluctuations of α-carbon atoms in the FE model to those obtained using either the all-atom normal mode analysis or the RTB procedure when atomic coordinates are available, which generally ranges from two to five GPa [18, 44]. Because most structures in the EMDB lack atomic coordinates, normal mode amplitudes and dependent properties are computed using a Young’s modulus of 2 GPa, representing an approximate lower bound on protein stiffness, and correspondingly an upper bound on molecular RMSFs [18]. The precise value of the Young’s modulus affects linearly the magnitude of thermal fluctuations, and therefore all results presented may be scaled linearly to calculate their value corresponding to higher or lower Young’s moduli.
The subspace iteration procedure [44, 45] is used to solve the eigenvalue problem using 2N starting iteration vectors, where m N denotes the number of eigenmodes to be calculated. m
Analyses are performed on a 2.0 GHz Intel Xeon E5405 processor with 8 GB RAM. The computed number of rigid body modes is compared with the number of isolated molecular volumes calculated in the surface discretization step by successively removing the largest components from the molecular surface until no component remains and counting the number of those steps, where each isolated fragment has six rigid body modes.
9
Root-mean-square fluctuations and elastic strain energy densities
RMSFs in molecular motions are computed using the equipartition theorem of statistical thermodynamics [46], which requires that the equilibrium mean elastic strain energy associated with each normal mode equals 1
2k T , where B k is the Boltzmann constant and T is temperature, B assumed to be 298 K. The equilibrium mean elastic strain energy associated with each mode k is
given by 1
1 1 2 2 2 2 T k kxk K kxk k k k TB where x denotes the mass normalized k
eigenvector satisfying T 1 kM k
x x with the mass matrix M , k is its equilibrium amplitude, K
is the stiffness matrix and k is the eigenvalue associated with mode k. The RMSF for FE node
i is calculated using 2 1/2
2
1/2
2 2
1/2i k ik kk ik
r
r
x where x is the displacement ikvector of node i due to mode k.
Elastic strain energy densities corresponding to each mode are also computed at FE nodes. The elastic strain energy density corresponding to mode k is defined as 1 3 3
2 1 1 k k ij ij k i j v where k ij and k ij
denote the components of the strain and stress tensor for mode k, respectively. The
strain energy is first evaluated for each element and then averaged at each FE node because strains are discontinuous at element boundaries. Residues with high elastic strain energy density associated with experimentally observed conformational changes are structurally important to the stability of corresponding functional motions. It has been shown for some polymerases that those residues, termed hot spots by Zheng et al. [47], are also conserved evolutionarily, where hot spots are identified using the structural perturbation method, which measures for each
10
maximally overlaps with the conformational change to the perturbation in the stiffness of springs connected to the residue using the ENM [47]. The elastic strain energy density is physically correlated to the structural perturbation method because the perturbation in the stiffness of a residue with high elastic strain energy density will yield high perturbation to the total elastic energy as well (Figure S4). The similarity between the modes and the conformational change is measured by the overlap coefficient defined as Ck r xd k r x where d k x is the k
displacement vector of mode k and r is the difference vector between two conformations. d
When atomic structures of two or multiple conformations are available, the elastic strain energy densities corresponding to the conformational change are calculated by displacing FE nodes of the open conformer to their corresponding positions in the closed state. The
displacements of FE nodes are obtained by superposing the lowest 100 normal modes with appropriate weights. The weight of each normal mode is computed using
Ck C C d k k W r x x where C d
r is the difference vector between α-carbon positions of the conformers and C k
x is the
displacement vector at α-carbon positions due to mode k calculated by a linear projection from
FE nodes [44] (Figure S5).
All FE nodal results are stored in ASCII format including eigenvectors, their magnitudes, corresponding elastic strain energy densities for each normal mode, and total RMSF amplitudes. Results at FE nodes are also interpolated to each voxel of the original density map and stored in the MRC density map format so that both the original density map and result maps may be viewed simultaneously using, for example, Chimera (Figure S6). In addition, initial and deformed molecular surfaces for each mode are stored in STL file format for use in programs such as Maya (Autodesk, Inc., San Rafael, CA). Distributions of modal magnitudes and strain
11
energy densities on the initial molecular surface are stored in PLY file format, known as the Polygon File Format or the Stanford Triangle Format, where relative values are used as colors of vertices comprising the discretized molecular surface. Molecular animations in high (640×480 pixels) and low (320×240 pixels) resolutions are provided for four sub-frames in orthogonal views: ISO-3D, XY-plane, XZ-plane and YZ-plane to illustrate the dynamical motions associated with each mode.
Correlations in molecular motions
Linearized Mutual Information (LMI) is used to calculate correlations in molecular motions [48, 49]. The Mutual Information (MI) in atomic displacements is defined as
1 2
1 , , ( ) ln ( ) ( , ) i N N i i p p p d
r r r r r rr where r denotes the positional fluctuation i
vector of node i, and (pi r and i) p(r are their marginal and joint probability distributions, ) respectively. The LMI can be written in terms of equilibrium conformational properties as
( ) ( ) ( )
1
, ln det ln det ln det 2 lin i j Ci C j Cij r r where C( )ij
ri, rj
T ri, rj
and ( ) i T i iC r r . The generalized correlation coefficient,
1/2, j 1 exp 2 ,
LMI i lin i j
r r r r r d , is employed, where d is dimensionality (d
=1,2,3) [48]. Accordingly, LMI components are computed in the standard way using the normal
modes and
1 T T i k ik k nm j k jk r r
x x where nm is the number of normal modes, taken here to be 100 by default which is generally sufficient to obtain converged correlation coefficients (Figure S7, Figure S8, and Figure S9), and x is the displacement vector of node i due to mode ik12
k [50, 51]. The MI metric is employed due to its higher sensitivity in detecting correlations in molecular motions than the more commonly used Pearson correlation coefficient, which does not account for non-collinear correlated motions [48, 51]. In general, correlation coefficients are computed between FE nodes because EM-based structures typically lack atomic coordinates, although correlations in molecular motions may easily be computed at alpha carbon positions, for example, if a reference atomic structure is known using a linear projection from FE nodes (Figure S5).
To identify molecular regions that are highly correlated in their dynamical motion, hierarchical clustering is performed using 1rLMI as a distance metric and by defining the inter-cluster distance as the mean pair-wise distance between all elements (FE nodes) in any two clusters. In general, the density of FE nodes is uniform in the molecule and clusters identified are considerably larger than the inter-node spacing. While this process naturally forms clusters of nodes with respect to their magnitude of MI, in most cases clusters with high MI consist of nodes that are spatially near one another because direct geometric/packing interactions introduce highly correlated motions that are trivial and not of interest. Instead, we seek to identify clusters that are both highly correlated and spatially distant, which could not be identified from molecular
structure or geometry alone. To achieve this, N clusters are formed by choosing the number of clusters (N) at the knee point of a clustering performance curve that shows compactness (intra-cluster variance) and separation (inter-(intra-cluster partitioning) of resulting (intra-clusters as a function of the number of clusters [52]. Compactness is computed as the mean cluster size, where cluster size is defined as the mean pair-wise distance between all elements (FE nodes) in the cluster. Separation is defined as the mean inter-cluster distance, where the distance between clusters is the same as that used in hierarchical clustering. Spatially distant cluster pairs are determined
13
using the criterion DijCdist
Rg i, Rg j,
, where D is the distance between the mean positions ijof clusters i and j, 1 1 , 2 i i L i g i L k k
R
d is the radius of gyration of cluster i, which is the root-mean-squared distance (d ) between FE node k and the mean position of cluster i over the iknumber of nodes in cluster i (L ), and i C is an empirical parameter that is used to define dist
“distant,” which is taken here to be 1.2. In general, DijRg i, Rg j, means that clusters are physically overlapping whereas Dij Rg i, Rg j, means that they are non-overlapping. Distant cluster pairs with the highest mean correlation are selected for evaluation.
This approach is tested for T4 lysozyme (PDB ID 3LZM) and adenylate kinase (PDB ID 4AKE, open conformer). Residue clusters obtained for T4 lysozyme correspond to residues correlated due to hinge-bending [18, 48] and those for adenylate kinase are active residues in the conformational change from its open (PDB ID 4AKE) to its closed states (PDB ID 1AKE) [44, 53] (Figure S10 and Figure S11). Note that the generalized correlation coefficients from LMI generally give more information compared with the Pearson correlation metric (Figure S12).
RESULTS
Ribosome-bound termination factor RF2
Class I release factors (RFs), RF1 and RF2 in prokaryotes, or eRF1 in eukaryotes, recognize mRNA stop codons via tripeptide motifs that result in termination of protein synthesis by the ribosome via peptidyl-tRNA hydrolysis and subsequent peptide chain release [54]. The cryo-EM structure of the ribosome-bound E. coli RF2 (EMDB ID 1010) consists of four domains in its native open, tri-lobed conformation (Figure 4A), which is in contrast to the closed
14
conformation that it exhibits in its unbound crystal structure [55-58]. The conserved GGQ amino-acid motif that is essential to peptidyl-tRNA hydrolysis is located at the distal end of domain 3 [59, 60], whereas the SPF loop that is essential to stop codon recognition is located in domains 2 and 4, which form a compact super-domain [54]. Overall, NMA reveals that domain 3 exhibits the highest conformational flexibility relative to the remainder of the molecule, as measured by root-mean-square fluctuations (RMSFs) (Figure 2). This is in contrast with domains 2 and 4, as well as the central region of domain 1, which exhibit relatively low flexibility (Figure 2).
Residues that are structurally important to the stability of specific functional motions are associated with regions of high elastic strain energy, termed hot spots by Zheng et al. [47]. The biological relevance of such residues has been established in several cases using sequence analysis [47], which shows that they are conserved evolutionarily. Regions of highest elastic strain energy associated with the open-to-closed transition of RF2 are predominantly at the interface between domains 3 and the super-domain 2 & 4, as well as secondarily in the neck region of domain 1 (Figure 2). Both of these regions act as hinges in the open-to-closed
transition (Figure S13). Sequence analysis would be of interest to test whether residues in these regions are under evolutionary pressure to be conserved.
Analysis of the correlations in RF2 collective motions identifies five distinct molecular regions with domain 3 and the proximal region of domain 1 exhibiting the highest mean
correlation despite their large spatial separation (Figure 4). The mean correlation of these regions corresponds to the 88th percentile of correlation coefficients in the molecule. While this result is
unaffected by increasing the number of normal modes employed from 100 to 400 (Figure S14), molecular dynamics simulations would be of interest to test potential effects of anharmonic
15
dynamics on this correlation analysis [48]. The fact that these domains correspond to regions of the molecule that undergo a significant conformational change between its open and closed conformers [55] suggests that this correlation analysis might be useful to identify molecular domains involved in conformational transitions. Further analyses to test this hypothesis are beyond the scope of the present work.
Nuclear pore complex
Nuclear pore complexes (NPCs) are high molecular weight (50 to 120 MDa from yeast to vertebrates) supramolecular assemblies that confer eukaryotes the ability to transport selectively macromolecules between the nucleus and cytoplasm [61-63]. NPCs are highly conserved from yeast to humans, consisting of approximately 30 different nucleoporin proteins that form a central pore of approximately 30 to 60 nm through which small molecules (< 40 kDa) may diffuse freely, but larger molecules may only be transported with the assistance of karyopherin (Kap) receptor proteins [64, 65]. In order to transport cargo selectively, Kaps interact with the phenylalanine-glycine-rich domain repeats present within the channel of the NPC, which are thought to act either as an entropic or a physical barrier, with a detailed molecular mechanism that remains unclear [66-72]. Beyond their role in transport, NPCs are recently implicated in playing important additional roles in nuclear organization and gene regulation [73].
Cryo-electron tomography (Cryo-ET) applied to the NPC from D. discoideum nuclei (EMDB ID 1097, Figure 5A) reveals eight-fold symmetry of the complex that is composed of a 125 nm diameter central framework consisting of cytoplasmic, luminal spoke, and nuclear rings that form a central pore of 60 nm [74]. The nuclear basket consists of a distal ring plus nuclear
16
filaments and eight cytoplasmic filaments, each approximately 35 nm in length, are seen clearly to be oriented towards the central plug/transporter (CP/T) in the reconstruction [74].
NMA of this NPC reveals that the cytoplasmic filaments are conformationally most flexible relative to the rest of the molecule (Figure 2 and Figure S15). The nuclear basket also exhibits conformational mobility relative to the nearly rigid central framework, which may be attributed to the porous structure of the former compared with the solid hub-like structure of the latter.
Analysis of the correlations in molecular motions of the NPC demonstrates that the large amplitude fluctuations of the cytoplasmic filaments are not correlated with one another: the mean inter-cluster correlation between cytoplasmic filaments is 0.13, which corresponds to the 5th
percentile of correlation coefficients for all nodal pairs in the molecule (Figure 5B). This is in contrast to the nuclear basket and central framework, in which nodal pairs have relatively high mean correlation coefficients of 0.67 (90th percentile) and 0.41 (75th percentile), respectively, exhibiting structural integrity that is manifest in their individually highly correlated collective motions. The lack of correlation in the collective motions of the cytoplasmic filaments might explain the inability of single-particle reconstructions to reach high resolution in the absence of interacting cargo molecules, which tend to stabilize the filaments in specific conformations [74, 75].
Bending transverse to the plane of the nuclear envelope, elliptical distortion, and
homogeneous dilatational motions dominate the lowest normal modes of the central framework (Figure 5C and Figure S16), thereby representing the most significant large-scale, collective motions of the complex as measured by their relative contributions to total RMSFs (Figure S15). Regions of elevated elastic strain energy corresponding to elliptical distortion that has been
17
observed experimentally using cryo-ET [76] include the inner region of the cytoplasmic ring (Figure 2), suggesting that this region might be important to the structural stability of this motion. Other regions of elevated elastic strain energy include the roots of cytoplasmic filaments, the boundaries between the central framework and the nuclear basket, and the luminal spoke ring, which acts as a plane of transverse pseudo-symmetry for the hub-like central framework. Homogeneous dilatation of the central pore, which has also been observed to occur
experimentally in response to the presence of calcium ions [77], ATP [78], and steroids [79-81], first appears at the considerably higher mode number 27, whose frequency is approximately twice that of the elliptical normal modes. This significant difference in harmonic frequency suggests that this latter mode of deformation is considerably less favorable mechanically. Thus, either small-molecule-induced structural transitions should occur to render homogeneous dilation energetically on par with elliptical distortion, or this difference operates to separate energetically these functional motions, with potential implications on selective transport of macromolecular cargo.
The lowest normal modes reported here for the cryo-ET-based NPC structure from D.
discoideum are similar to the lowest normal modes reported for the yeast and Xenopous oocyte NPCs, which were analyzed using the ENM [82] and a FE representation [83], respectively, using simplified models based on idealized geometries. Notwithstanding, the similarity of the lowest normal modes reported across these studies indicates that the collective motions of the NPC central framework are robust to significant variations in overall structure as long as the hub-like structure of the central framework is preserved.
18
GroEL
GroEL is an extensively studied bacterial chaperonin that assists polypeptide chains in folding to form their native structure [84-89]. The assembly consists of two co-axial rings that are each composed of seven identical subunits of 60 kDa each. Each subunit consists of three domains: an equatorial domain that contains an ATP binding site and connects the coaxial rings, an apical domain that contains the co-chaperonin GroES binding site, and an intermediate domain that connects the equatorial and apical domains (Figure 6A).
NMA of GroEL (EMDB ID 1080) [90] reveals that the apical subunit domain, which exhibits significant conformational polymorphism between the bound and unbound states of GroES, also exhibits the highest conformational flexibility in the molecule (Figure 2). The elastic strain energy associated with the functional transition from the native T-state to the ATP-bound R-state (for the upper ring) is elevated at the interfaces of the different subunits, the upper and lower rings, and the equatorial and intermediate domains within the same subunit (Figure 2), suggesting that residues at these interfaces may play important roles in the structural stability of this functional motion.
Analysis of the correlations in the dynamical motions of GroEL identifies 28 molecular regions that are highly correlated in the collective motions of the complex (Figure 6B): each structural subunit consists of two clusters, one that contains the equatorial domain and another that contains the intermediate and apical domains†. Nearest-neighbor clusters in different subunits within the same ring (Figure 6C, i) exhibit maximally correlated dynamics amongst all nearest-neighbor clusters in the molecule (horizontal shaded region in Figure 6C), whereas other
† Correlation analysis performed using the alpha carbon positions of the reference atomic structure (PDB ID 1OEL)
19
nearest-neighbor clusters are relatively less correlated (Figure 6C, ii). These high inter-subunit correlations may be important for the cooperative ATP binding and hydrolysis reactions that occur in seven subunits within each ring with the heptameric symmetry of GroEL being maintained [84, 86, 89]. In contrast, all non-neighboring cluster pairs exhibit relatively low correlations. The same correlation analysis results are consistently obtained for other GroEL models based on the molecular surfaces at different resolutions (Figure S17).
CONCLUSIONS
An unsupervised approach to computing the conformational dynamics of supramolecular protein assemblies based on single-particle cryo-EM based reconstructions is proposed.
Conformational flexibility, spatial distributions of elastic strain energy, and correlation analysis highlight molecular regions that are important to functional motions, elucidated here for RF2, the NPC, and GroEL. A novel, objective approach to identifying highly correlated molecular
domains identifies domains that are known to be functionally involved in cooperative or allosteric transitions, as well conformational change pathways. This suggests that the foregoing procedure might prove useful in the discovery of such domains that are not known a priori and that cannot be deduced from structure alone. Application of this procedure to large classes of molecules with known allosteric or functional coupling is needed to test this hypothesis.
While the present procedure is applied to single-particle reconstructions in the EMDB, the approach is generally applicable to atom-based structures in the PDB [18] and VIPERdb [91] as well, for related functional analyses to those presented here. Analysis of the conformational flexibility, elastic strain energy density, and correlations in dynamical motions of the ribosome,
20
viral capsid, and bacterial flagellar motor shown in Figure 2 may be the subject of future work. Together with the remaining several hundred structures analyzed, these results should prove broadly useful to understanding the molecular-basis of the biological function of supramolecular protein assemblies [92].
ACKNOWLEDGEMENTS
Funding for this work was provided by MIT Faculty Start-up Funds and the Samuel A. Goldblith Career Development Professorship awarded to MB.
21
REFERENCES
[1] M. Tagari, et al., New electron microscopy database and deposition system, Trends Biochem Sci 27 (2002) 589.
[2] K. Henrick, et al., EMDep: a web-based system for the deposition and validation of
high-resolution electron microscopy macromolecular structural information, J Struct Biol 144 (2003) 228-237.
[3] F.C. Bernstein, et al., The Protein Data Bank: A computer-based archival file for
macromolecular structures, J Mol Biol 112 (1977) 535-542.
[4] H.M. Berman, et al., The Protein Data Bank, Nucleic Acids Res 28 (2000) 235-242. [5] Z. Xu and P.B. Sigler, GroEL/GroES: structure and function of a two-stroke folding
machine, J Struct Biol 124 (1998) 129-141.
[6] J.F. Conway, et al., Virus maturation involving large subunit rotations and local
refolding, Science 292 (2001) 744-748.
[7] Z. Zhang, et al., Visualization of the maturation transition in bacteriophage P22 by
electron cryomicroscopy, J Mol Biol 297 (2000) 615-626.
[8] Q. Cui and I. Bahar, eds. Normal Mode Analysis: Theory and applications to biological
and chemical systems. Mathematical and Computational Biology Series. 2006, Chapman & Hall/CRC: Boca Raton.
[9] F. Tama, et al., Building-block approach for determining low frequency normal modes of
macromolecules, Proteins: Struct Funct Genet 41 (2000) 1-7.
[10] Y. Suezaki and N. Go, Breathing mode of conformational fluctuations in globular
proteins, Int J Pept Protein Res 7 (1975) 333-334.
[11] D. ben-Avraham, Vibrational normal-mode spectrum of globular proteins, PhRvB 47 (1993) 14559-14560.
[12] M.M. Tirion, Large amplitude elastic motions in proteins from a single-parameter, atomic analysis, Phys Rev Lett 77 (1996) 1905-1908.
[13] T. Haliloglu, I. Bahar, and B. Erman, Gaussian dynamics of folded proteins, Phys Rev Lett 79 (1997) 3090-3093.
[14] I. Bahar and A.J. Rader, Coarse-grained normal mode analysis in structural biology, Curr Opin Struct Biol 15 (2005) 586-592.
[15] M.K. Kim, R.L. Jernigan, and G.S. Chirikjian, Rigid-cluster models of conformational
transitions in macromolecular machines and assemblies, Biophys J 89 (2005) 43-55. [16] M.K. Kim, R.L. Jernigan, and G.S. Chirikjian, An elastic network model of HK97 capsid
maturation, J Struct Biol 143 (2003) 107-117.
[17] A.D. Schuyler and G.S. Chirikjian, Efficient determination of low-frequency normal
modes of large protein structures by cluster-NMA, J Mol Graph Model 24 (2005) 46-58. [18] M. Bathe, A Finite Element framework for computation of protein normal modes and
mechanical response, Proteins: Struct Funct Bioinform 70 (2008) 1595-1609. [19] R. Phillips, M. Dittrich, and K. Schulten, Quasicontinuum representations of
atomic-scale mechanics: From proteins to dislocations, Annu Rev Mater Res 32 (2002) 219-233. [20] K.J. Bathe, Finite Element Procedures, Prentice Hall Inc., Upper Saddle River, New
Jersey, 1996.
[21] V.B. Shenoy, et al., Quasicontinuum models of interfacial structure and deformation, Phys Rev Lett 80 (1998) 742-745.
22
[22] V. Alexandrov, et al., Normal modes for predicting protein motions: A comprehensive
database assessment and associated Web tool, Protein Sci 14 (2005) 633-643. [23] K. Suhre and Y.-H. Sanejouand, ElNemo: a normal mode web server for protein
movement analysis and the generation of templates for molecular replacement, Nucleic Acids Res 32 (2004) W610-W614.
[24] H. Wako, M. Kato, and S. Endo, ProMode: a database of normal mode analyses on
protein molecules with a full-atom model, Bioinformatics 20 (2004) 2035-2043.
[25] L.-W. Yang, et al., iGNM: a database of protein functional motions based on Gaussian
Network Model, Bioinformatics 21 (2005) 2978-2987.
[26] S.M. Hollup, G. Salensminde, and N. Reuter, WEBnm@: a web application for normal
mode analyses of proteins, BMC Bioinformatics 6 (2005) 52.
[27] E. Lindahl, et al., NOMAD-Ref: visualization, deformation and refinement of
macromolecular structures based on all-atom normal mode analysis, Nucleic Acids Res 34 (2006) W52-W56.
[28] J. Brink, et al., Experimental verification of conformational variation of human fatty acid
synthase as predicted by normal mode analysis, Structure 12 (2004) 185-191.
[29] H. Fischer, I. Polikarpov, and A.F. Craievich, Average protein density is a
molecular-weight-dependent function, Protein Sci 13 (2004) 2825-2828.
[30] D. Ming, et al., How to describe protein motion without amino acid sequence and atomic
coordinates, Proc Natl Acad Sci U S A 99 (2002) 8620-8625.
[31] D.M. Ming, et al., Domain movements in human fatty acid synthase by quantized elastic
deformational model, Proc Natl Acad Sci U S A 99 (2002) 7895-7899.
[32] P. Chacon, F. Tama, and W. Wriggers, Mega-Dalton biomolecular motion captured from
electron microscopy reconstructions, J Mol Biol 326 (2003) 485-492.
[33] F. Tama, W. Wriggers, and C.L. Brooks, Exploring global distortions of biological
macromolecules and assemblies from low-resolution structural information and elastic network theory, J Mol Biol 321 (2002) 297-305.
[34] W.E. Lorensen and H.E. Cline, Marching cubes: A high resolution 3D surface
construction algorithm, Computer Graphics (SIGGRAPH '87 Proceedings) 21 (1987) 163-169.
[35] E.F. Pettersen, et al., UCSF chimera - A visualization system for exploratory research
and analysis, J Comput Chem 25 (2004) 1605-1612.
[36] P. Cignoni, et al., Meshlab: An open-source mesh processing tool, in Sixth Eurographics
Italian Chapter Conference. 2008. pp. 129-136.
[37] E. Béchet, J.C. Cuilliere, and F. Trochu, Generation of a finite element mesh from
stereolithography (STL) files, Comput-Aided Des 34 (2002) 1-17.
[38] J. Peters and U. Reif, The simplest subdivision scheme for smoothing polyhedra, ACM Trans Graphics 16 (1997) 420-431.
[39] D.A. Field, Laplacian smoothing and Delaunay triangulations, Commun Appl Numer Methods 4 (1988) 709-712.
[40] M. Garland and P.S. Heckbert, Surface simplification using quadric error metrics, in
Proceedings of the 24th annual conference on computer graphics and interactive techniques. 1997: Los Angeles, CA. pp. 209-216.
[41] M.M. Gibbons and W.S. Klug, Nonlinear finite-element analysis of nanoindentation of
23
[42] M.M. Gibbons and W.S. Klug, Influence of nonuniform geometry on nanoindentation of
viral capsids, Biophys J 95 (2008) 3640-3649.
[43] D.P. Kharakoz, Protein compressibility, dynamics, and pressure, Biophys J 79 (2000) 511-525.
[44] R.S. Sedeh, M. Bathe, and K.J. Bathe, The subspace iteration method in protein normal
mode analysis, J Comput Chem 31 (2010) 66-74.
[45] K.J. Bathe and S. Ramaswamy, An accelerated subspace iteration method, Comput Meth Appl Mech Eng 23 (1980) 313-331.
[46] D.A. McQuarrie, Statistical Mechanics. Harper's Chemistry Series, Harper & Row, New York, 1975.
[47] W.J. Zheng, et al., Network of dynamically important residues in the open/closed
transition in polymerases is strongly conserved, Structure 13 (2005) 565-577. [48] O.F. Lange and H. Grubmuller, Generalized correlation for biomolecular dynamics,
Proteins: Struct Funct Bioinform 62 (2006) 1053-1061.
[49] R.S. Sedeh, et al., Structure, evolutionary conservation, and conformational dynamics of Homo sapiens fascin-1, an F-actin crosslinking protein, J Mol Biol (2010) In press. [50] B.R. Brooks, D. Janezic, and M. Karplus, Harmonic analysis of large systems. 1.
Methodology, J Comput Chem 16 (1995) 1522-1542.
[51] T. Ichiye and M. Karplus, Collective motions in proteins: A covariance analysis of
atomic fluctuations in molecular dynamics and normal mode simulations, Proteins: Struct Funct Genet 11 (1991) 205-217.
[52] J. Handl, J. Knowles, and D.B. Kell, Computational cluster validation in post-genomic
data analysis, Bioinformatics 21 (2005) 3201-3212.
[53] P. Maragakis and M. Karplus, Large amplitude conformational change in proteins
explored with a plastic network model: Adenylate kinase, J Mol Biol 352 (2005) 807-822. [54] K. Ito, M. Uno, and Y. Nakamura, A tripeptide anticodon deciphers stop codons in
messenger RNA, Nature 403 (2000) 680-684.
[55] U.B.S. Rawat, et al., A cryo-electron microscopic study of ribosome-bound termination
factor RF2, Nature 421 (2003) 87-90.
[56] B.P. Klaholz, et al., Structure of the Escherichia coli ribosomal termination complex with
release factor 2, Nature 421 (2003) 90-94.
[57] B. Vestergaard, et al., Bacterial polypeptide release factor RF2 is structurally distinct
from eukaryotic eRF1, Mol Cell 8 (2001) 1375-1382.
[58] B.Y. Ma and R. Nussinov, Release factors eRF1 and RF2 - A universal mechanism
controls the large conformational changes, J Biol Chem 279 (2004) 53875-53885. [59] A. Seit-Nebi, et al., Class-1 translation termination factors: invariant GGQ minidomain
is essential for release activity and ribosome binding but not for stop codon recognition, Nucleic Acids Res 29 (2001) 3982-3987.
[60] H.W. Song, et al., The crystal structure of human eukaryotic release factor eRF1 - Mechanism of stop codon recognition and peptidyl-tRNA hydrolysis, Cell 100 (2000) 311-321.
[61] M.P. Rout, et al., The yeast nuclear pore complex: Composition, architecture, and
transport mechanism, J Cell Biol 148 (2000) 635-651.
[62] J.A. Cronshaw, et al., Proteomic analysis of the mammalian nuclear pore complex, J Cell Biol 158 (2002) 915-927.
24
[63] L.J. Terry, E.B. Shows, and S.R. Wente, Crossing the nuclear envelope: Hierarchical
regulation of nucleocytoplasmic transport, Science 318 (2007) 1412-1416.
[64] M. Stewart, Molecular mechanism of the nuclear protein import cycle, Nat Rev Mol Cell Biol 8 (2007) 195-208.
[65] M. Suntharalingam and S.R. Wente, Peering through the pore: Nuclear pore complex
structure, assembly, and function, Dev Cell 4 (2003) 775-789.
[66] I.G. Macara, Transport into and out of the nucleus, Microbiol Mol Biol Rev 65 (2001) 570-594.
[67] R. Peters, Translocation through the nuclear pore complex: Selectivity and speed by reduction-of-dimensionality, Traffic 6 (2005) 421-427.
[68] R. Peters, Translocation through the nuclear pore: Kaps pave the way, Bioessays 31 (2009) 466-477.
[69] K. Ribbeck and D. Gorlich, Kinetic analysis of translocation through nuclear pore
complexes, EMBO J 20 (2001) 1320-1330.
[70] M.P. Rout, et al., Virtual gating and nuclear transport: the hole picture, Trends Cell Biol 13 (2003) 622-628.
[71] L. Miao and K. Schulten, Probing a structural model of the nuclear pore complex
channel through molecular dynamics, Biophys J 98 (2010) 1658-1667.
[72] L.L. Miao and K. Schulten, Transport-related structures and processes of the nuclear
pore complex studied through molecular dynamics, Structure 17 (2009) 449-459.
[73] C. Strambio-De-Castillia, M. Niepel, and M.P. Rout, The nuclear pore complex: bridging
nuclear transport and gene regulation, Nat Rev Mol Cell Biol 11 (2010) 490-501. [74] M. Beck, et al., Nuclear pore complex structure and dynamics revealed by cryoelectron
tomography, Science 306 (2004) 1387-1390.
[75] N. Elad, et al., Structural analysis of the nuclear pore complex by integrated approaches, Curr Opin Struct Biol 19 (2009) 226-232.
[76] M. Beck, et al., Snapshots of nuclear pore complexes in action captured by cryo-electron
tomography, Nature 449 (2007) 611-615.
[77] D. Stoffler, et al., Calcium-mediated structural changes of native nuclear pore complexes
monitored by time-lapse atomic force microscopy, J Mol Biol 287 (1999) 741-752. [78] A. Rakowska, et al., ATP-induced shape change of nuclear pores visualized with the
atomic force microscope, J Membr Biol 163 (1998) 129-136.
[79] V. Shahin, et al., Steroids dilate nuclear pores imaged with atomic force microscopy, J Cell Physiol 202 (2005) 591-601.
[80] L. Kastrup, et al., Nuclear envelope barrier leak induced by dexamethasone, J Cell Physiol 206 (2006) 428-434.
[81] V. Shahin, et al., Glucocorticoids remodel nuclear envelope structure and permeability, J Cell Sci 118 (2005) 2881-2889.
[82] T.R. Lezon, A. Sali, and I. Bahar, Global motions of the nuclear pore complex: Insights
from elastic network models, PLoS Comp Biol 5 (2009) e1000496.
[83] C. Wolf and M.R.K. Mofrad, On the octagonal structure of the nuclear pore complex:
Insights from coarse-grained models, Biophys J 95 (2008) 2073-2085.
[84] B.L. de Groot, G. Vriend, and H.J.C. Berendsen, Conformational changes in the
chaperonin GroEL: New insights into the allosteric mechanism, J Mol Biol 286 (1999) 1241-1249.
25
[85] Z. Yang, P. Majek, and I. Bahar, Allosteric transitions of supramolecular systems
explored by network models: Application to chaperonin GroEL, PLoS Comp Biol 5 (2009) e1000360.
[86] J.P. Ma and M. Karplus, The allosteric mechanism of the chaperonin GroEL: A dynamic
analysis, Proc Natl Acad Sci U S A 95 (1998) 8502-8507.
[87] C. Hyeon, G.H. Lorimer, and D. Thirumalai, Dynamics of allosteric transitions in GroEL, Proc Natl Acad Sci U S A 103 (2006) 18939-18944.
[88] R. Tehver, J. Chen, and D. Thirumalai, Allostery wiring diagrams in the transitions that
drive the GroEL reaction cycle, J Mol Biol 387 (2009) 390-406.
[89] Q. Cui and M. Karplus, Allostery and cooperativity revisited, Protein Sci 17 (2008) 1295-1307.
[90] S.J. Ludtke, et al., A 11.5 Å single particle reconstruction of GroEL using EMAN, J Mol Biol 314 (2001) 253-262.
[91] M. Carrillo-Tripp, et al., VIPERdb2: an enhanced and web API enabled relational
database for structural virology, Nucleic Acids Res 37 (2009) D436-442.
[92] P. Csermely, R. Palotai, and R. Nussinov, Induced fit, conformational selection and
independent dynamic segments: an extended view of binding events, Trends Biochem Sci (2010) In Press.
26
FIGURE LEGENDS
Figure 1 Classification of EMDB entries according to biological function. Numbers in
parentheses denote successfully analyzed structures deposited at http://www.cdyn.org.
Figure 2 Representative results of conformational dynamics analysis. Discretized molecular
surface, equilibrium RMSF at room temperature (298 K), and elastic strain energy densities for ribosome-bound termination factor RF2 from E. coli (EMDB ID 1010); nuclear pore complex from D. discoideum (EMDB ID 1097); GroEL from E. coli (EMDB ID 1080); 70S ribosome from E. coli in the pretranslocation state (EMDB ID 1554); human hepatitis B viral capsid (EMDB ID 1402); and connector of bacteriophage T7 (EMDB ID 1231). Elastic strain energy densities correspond for RF2 to its open-to-closed transition (PDB ID 1MI6 and 1GQE) represented using the lowest 100 normal modes, for GroEL to the functional transition from the native T-state (PDB ID 1OEL) to the ATP-bound R-state prior to co-chaperonin GroES binding (PDB ID 2C7E) represented by the lowest 100 normal modes, for the NPC to normal mode 3 that represents its experimentally observed elliptical distortion [76], and for the remaining structures to their lowest normal modes. RMSFs and elastic strain energy densities are normalized to range from zero to one, where blue and red denote low and high relative values, respectively.
Figure 3 Automatic procedure for conformational dynamics analysis. (A) Flowchart of the
procedure consisting of map retrieval from the EMDB, surface discretization and repair, finite element mesh generation, normal mode analysis, and results processing. (B) Decomposition of the EMDB into solved (453) and remaining unsolved (228) entries.
Figure 4 Ribosome-bound termination factor RF2. (A) Structure of E. coli RF2 in the open
conformation (EMDB ID 1010) [55]. (B) Generalized inter-nodal correlations and hierarchical clustering dendrogram, clustering performance curve, and identified regions with highly correlated molecular motions. Regions g1 and g2 of the molecule remain in a single cluster in
neighboring clustering partitions consisting of 3, 4, or 6 clusters. (C) The cluster (g1-g2) with
highest correlation is composed of two spatially distant structural regions: domain 3 (g1) and the
proximal region of domain 1 (g2). Scatter plots of (far left) pair-wise spatial distance versus
generalized correlation for (top) all nodal pairs in the molecule and (bottom) only nodal pairs in g1 & g2 show that (middle) nodal pairs in g1 & g2 constitute amongst the most highly correlated
regions in the molecule. (Far right) Scatter plot of the mean generalized correlation versus spatial cluster separation of the five clusters identified in (B). See text for details.
Figure 5 Nuclear pore complex. (A) Structure of the NPC from D. discoideum (EMDB ID
1097) [74]. (B) Generalized inter-nodal correlations and hierarchical clustering dendrogram, clustering performance curve, and identified regions with highly correlated molecular motions. (C) Normal modes corresponding to elliptical distortion (mode 3 and 4) and homogeneous dilatation of the central pore (mode 27), which are implicated in NPC transport.
Figure 6 GroEL. (A) Structure of the bacterial chaperonin GroEL (EMDB ID 1080 & PDB ID
1OEL) [90]. (B) Generalized inter-residue correlations and hierarchical clustering dendrogram, clustering performance curve, and identified regions with highly correlated molecular motions. (C) The generalized correlations and separation of clusters identified in (B) indicate that adjacent
27
subunits in the same ring are more highly correlated than adjacent subunits in distinct rings, and that all adjacent subunits are considerably more correlated than other (nonadjacent) subunits in the collective motions of the complex.
28
29
30
31
32
33
34
SUPPLEMENTARY MATERIAL
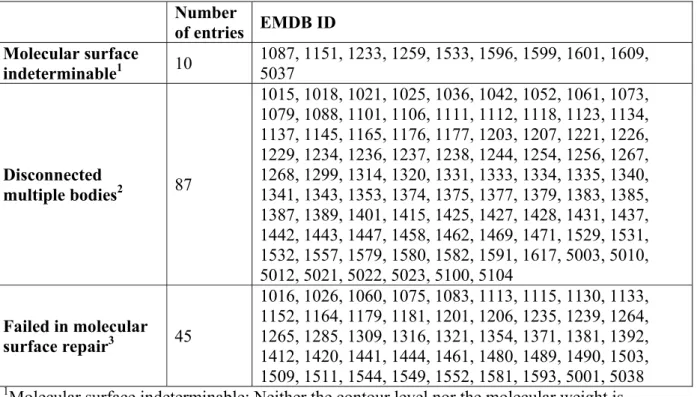
Table S1. EMDB entries excluded from NMA. Number of entries EMDB ID Molecular surface indeterminable1 10 1087, 1151, 1233, 1259, 1533, 1596, 1599, 1601, 1609, 5037 Disconnected multiple bodies2 87 1015, 1018, 1021, 1025, 1036, 1042, 1052, 1061, 1073, 1079, 1088, 1101, 1106, 1111, 1112, 1118, 1123, 1134, 1137, 1145, 1165, 1176, 1177, 1203, 1207, 1221, 1226, 1229, 1234, 1236, 1237, 1238, 1244, 1254, 1256, 1267, 1268, 1299, 1314, 1320, 1331, 1333, 1334, 1335, 1340, 1341, 1343, 1353, 1374, 1375, 1377, 1379, 1383, 1385, 1387, 1389, 1401, 1415, 1425, 1427, 1428, 1431, 1437, 1442, 1443, 1447, 1458, 1462, 1469, 1471, 1529, 1531, 1532, 1557, 1579, 1580, 1582, 1591, 1617, 5003, 5010, 5012, 5021, 5022, 5023, 5100, 5104 Failed in molecular surface repair3 45 1016, 1026, 1060, 1075, 1083, 1113, 1115, 1130, 1133, 1152, 1164, 1179, 1181, 1201, 1206, 1235, 1239, 1264, 1265, 1285, 1309, 1316, 1321, 1354, 1371, 1381, 1392, 1412, 1420, 1441, 1444, 1461, 1480, 1489, 1490, 1503, 1509, 1511, 1544, 1549, 1552, 1581, 1593, 5001, 5038
1Molecular surface indeterminable: Neither the contour level nor the molecular weight is
provided.
2Disconnected multiple bodies: Structure consists of disconnected multiple bodies when the
suggested contour level is used (Figure S1).
3Failed in molecular surface repair: The automatic procedure fails to repair the molecular surface.
Molecular surfaces may be repaired by applying filters manually or in a supervised manner, neither of which is pursued in the present work.
35
Figure S1 Examples of EMDB entries classified as disconnected multiple bodies that are excluded from NMA. Colors highlight all or parts of disconnected fragments. (A) Microtubule
(EMDB ID 1428). (B) ATPases (EMDB ID 5104). (C) Viral capsid (EMDB ID 1111). (D) GroEL (EMDB ID 1458). (E) Ribosome (EMDB ID 1073). (F) Acrosomal actin bundle (EMDB ID 1088). (G) Inositol 1,4,5-triphosphate receptor (EMDB ID 1061). (H) Tail of bacteriophage K1-5 (EMDB ID 1335). (I) Anaphase promoting complex (EMDB ID 1591).
Figure S2 Discretized molecular surfaces. Molecular surfaces for kinesin dimers bound to a
microtubule (EMDB ID 1030) generated by Chimera at the suggested contour level (A) prior to surface mesh repair and (B) after surface mesh repair using Meshlab. Molecular surfaces for GroEL (EMDB ID 1081) (C) prior to surface mesh repair and (D) after surface mesh repair. Isolated fragments and intersecting triangles are highlighted in red in (A) and (C), respectively.
Figure S3 Convergence of RMSFs. Mean relative RMSFs as a function of the number of modes
used for RMSF calculations are shown for RF2 (cyan), NPC (blue), and GroEL (red). RMSFs computed using 400 normal modes is chosen as the reference. The dashed line corresponds to 20 normal modes.
Figure S4 Elastic strain energy densities corresponding to the normal mode that maximally overlaps with the conformational change. (A) Taq DNA polymerase I; and (B) bacteriophage
T7 RNA polymerase I. Numbers 1–8 denote residues with high elastic strain energy densities. Results are similar to those obtained using the structural perturbation method [47].
Figure S5 Linear projection of normal modes at FE nodes onto alpha carbon positions.
Normal modes at alpha carbon positions can be computed by linear projection of normal modes computed at FE nodes. First, local coordinates of an alpha carbon atom inside a tetrahedral element are computed by solving a set of linear equations with given global coordinates of the FE nodes and the alpha carbon atom. Then, components of each normal mode at the alpha carbon position are computed by interpolating normal modes at FE nodes in the same way. Positions and eigenvector components in the global coordinate system are denoted by (x, y, z) and (u, v, w), respectively, and positions in the local coordinate system are denoted by (r, s, t). Subscripts indicate either local FE node numbers or an alpha carbon atom.
Figure S6 Sample EM-NMDB structures. Mobile regions of the lowest normal mode are
highlighted in red whose mode magnitudes are larger than the 80th percentile. Figures are created using Chimera by importing the original density map (transparent) and the lowest mode magnitude map (red) together. (A) Kinesin dimers bound to a microtubule (EMDB ID 1030). (B) A GroEL (EMDB ID 1080). (C) Bacteriophage P22 tail machine (EMDB ID 1119). (D) Connector of bacteriophage T7 (EMDB ID 1231). (E) Human RNA polymerase II (EMDB ID 1283). (F) Nitrilase from Rhodococcus rhodochrous J1 (EMDB ID 1313). (G) A chaperonin, cpn60 (EMDB ID 1397). (H) Parvovirus capsid (EMDB ID 5105).
Figure S7 Convergence of RMSFs and generalized correlation coefficients for RF2. (A)
RMSFs for a subset of FE nodes. (B–F) Distributions of the generalized correlation coefficients. Colors represent the density of pairs within a certain range of correlation coefficients and spatial distances.
36
Figure S8 Convergence of RMSFs and generalized correlation coefficients for the NPC. (A)
RMSFs for FE nodes in the cytoplasmic filaments, the nuclear basket, and the central framework. (B–F) Distributions of the generalized correlation coefficients. Colors represent the density of pairs within a certain range of correlation coefficients and spatial distances.
Figure S9 Convergence of RMSFs and generalized correlation coefficients for GroEL. (A)
RMSFs for residues in a single subunit. (B–F) Distributions of the generalized correlation coefficients. Colors represent the density of pairs within a certain range of correlation coefficients and spatial distances.
Figure S10 T4 lysozyme (PDB ID 3LZM) correlation analysis. (A) Clustering performance
curve. (B) Six clusters correlated in molecular motions where the largest cluster (colored in orange) contains residues correlated due to hinge-bending (residues 13–90 and 108–122). (C) 13 clusters correlated in molecular motions. The most highly correlated distant clusters (inset) consist of residues 33–53 and residues 81–90 that are colored in red. Pearson correlation captures a subset of residues correlated due to hinge-bending (residues 30–50, 70–90, and 100–120; Figure S12).
Figure S11 Adenylate kinase (PDB ID 4AKE) correlation analysis. (A) Clustering
performance curve. (B) Corresponding clusters correlated in molecular motions. The most highly correlated distant clusters (inset) consist of residues 30–73 and residues 113–175 that are colored
in red and correspond to residues active in the conformational change from its open (PDB ID 4AKE) to its closed conformation (PDB ID 1AKE).
Figure S12 Comparisons of mutual information and Pearson correlation coefficients.
Correlation coefficients of (A–B) T4 lysozyme (PDB ID 3LZM) and (C–D) adenylate kinase (PDB ID 4AKE) with linearized mutual information in upper triangle matrix and Pearson coefficients in lower triangle matrix.
Figure S13 Lowest normal modes of RF2. (A–C) Lowest three normal modes. (D) Normal
mode 9, which coincides maximally with the conformational change associated with the open-to-closed transition (overlap coefficient Ck 0.53). The initial molecular surface is colored in gray and two deformed molecular surfaces are colored in yellow and cyan for each mode. Corresponding elastic strain energy densities are shown on the initial molecular surface as inset figures. Animated molecular motions for each mode are available at http://www.cdyn.org.
Figure S14 Distributions of the generalized correlation coefficients of RF2. The scatter plot
represents the fraction of the number of pairs belonging to the cluster with the highest correlation (g1 & g2 in Figure 4) to the total number of pairs with respect to the generalized correlation coefficient and the spatial distance. The generalized correlation coefficients are computed using (A) 10 modes; (B) 20 modes; (C) 50 modes; (D) 100 modes; (E) 200 modes; and (F) 400 modes.
Figure S15 Nuclear pore complex. (A) Relative RMSFs of NPC domains with respect to the
number of modes used in RMSF computation with absolute RMSFs as an inset and (B) eigenvalues. RMSF of each domain is defined as the mean of RMSFs at FE nodes within each domain.
37
Figure S16 Lowest normal modes of the NPC. (A) Normal mode 1 is a shear-like motion
between the nuclear basket and the remaining structure. (B) Normal mode 3 is an elliptical distortion of the central framework consisting of transverse bending and stretching. (C) Normal mode 5 is axial stretching of the central framework. (D) Normal mode 6 is torsional motion between the nuclear basket and the remaining structure. (E) Normal mode 7 is elliptical distortion of the central framework consisting of transverse bending and stretching. (F) Normal mode 27 is homogeneous dilatation of the pore. A large set of modes (9–26) consists largely of fluctuations of the cytoplasmic filaments alone, with closely spaced frequencies that indicate the existence of multiple, nearly degenerate motions associated with these regions (Figure S15). Normal modes 2, 4, and 8 are not shown because they are degenerate to normal modes 1, 3, and 7, respectively.
Figure S17 Correlation analysis of GroEL. The generalized correlations and separation of
identified clusters are shown for GroEL models based on the molecular surfaces obtained from (A) the reference atomic crystal structure (PDB ID 1OEL, 2.8 Å) and (B-D) EM density maps at three resolutions: (B) 6 Å (EMDB ID 1081), (C) 11.5 Å (EMDB ID 1080), and (D) 25 Å (EMDB ID 1095). Insets represent the cross-sectional area at the interface between two rings. High correlations between neighboring clusters are consistently obtained for all models while a slightly wider range of low correlations between non-neighboring clusters is observed in (B) due to weaker connections between two rings (inset) when the suggested contour level is used.
38
39
40
41
42
Figure S5
43
44
45
46
Figure S10
47
48
49
50
Figure S15
51
![Daniel Glattauer - "Quand souffle le vent du Nord" [Critique]](data:image/gif;base64,R0lGODlhAQABAIAAAP///wAAACH5BAEAAAAALAAAAAABAAEAAAICRAEAOw==)