Computer-aided optimization of DC/
DC converters for automotive applications
The MIT Faculty has made this article openly available.
Please share
how this access benefits you. Your story matters.
Citation
Neugebauer, T.C., and D.J. Perreault. “Computer-Aided
Optimization of DC/DC Converters for Automotive Applications.”
IEEE Trans. Power Electron. 18, no. 3 (May 2003): 775–783. © 2003
IEEE
As Published
http://dx.doi.org/10.1109/TPEL.2003.810866
Publisher
Institute of Electrical and Electronics Engineers (IEEE)
Version
Final published version
Citable link
http://hdl.handle.net/1721.1/86930
Terms of Use
Article is made available in accordance with the publisher's
policy and may be subject to US copyright law. Please refer to the
publisher's site for terms of use.
Computer-Aided Optimization of DC/DC Converters
for Automotive Applications
Timothy C. Neugebauer, Student Member, IEEE, and David J. Perreault, Member, IEEE
Abstract—This paper investigates computer-aided optimization of dc/dc converters, with a focus on converters for dual-voltage automotive electrical systems. A new CAD optimization approach based on Monte Carlo search methods is introduced which allows the design space to be rapidly explored in an automated fashion and the most optimal designs and design approaches to be identi-fied. The optimization approach also allows the effects of variations in design specifications on the cost, weight, and volume of an op-timized converter to be readily determined. A prototype converter designed using this optimization procedure is evaluated and com-pared to a converter designed by conventional means.
Index Terms—CAD, dc/dc converters, dual-voltage.
I. INTRODUCTION
T
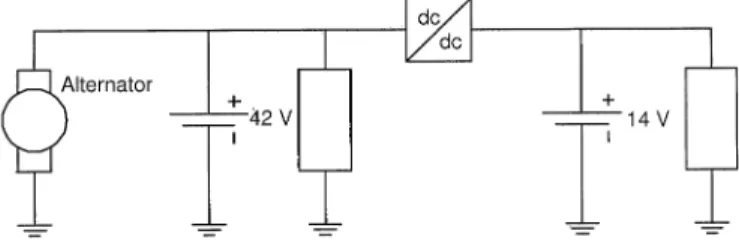
HE ELECTRICAL load in automobiles has been growing rapidly for many years, and is starting to exceed the prac-tical capacity of present-day electrical systems. To address this challenge, it is widely agreed that a dual-voltage system is the next evolutionary step for automotive electrical systems. High-power loads will be moved to a new high-voltage bus, while incandescent lighting, electronics, and other loads that benefit from a lower voltage will remain on the currently-used low-voltage bus [1]–[3].One widely-considered method for implementing a dual-voltage electrical system is illustrated in Fig. 1. A high-voltage alternator supplies the high-voltage bus, while the low-voltage bus is supplied from the high-voltage bus via a dc/dc converter. The converter controls the flow of energy between the two buses, and can be used to regulate the energy balance between the high and low-voltage batteries. In the case where a bidirectional converter is used, either battery may be used to recharge the other if it becomes depleted. These advantages make the dc/dc converter-based system the most desirable of available options from a performance standpoint.
The major practical drawback to the dc/dc converter-based ar-chitecture is the relatively high cost of the dc/dc converter, and to a lesser extent, its size and weight. This fact, along with the high production volumes associated with automotive compo-nents, motivates the optimization of converters for this applica-tion. Nevertheless, the task of truly optimizing such a converter
Manuscript received March 27, 2002; revised November 1, 2002. This work was supported by M.I.T./Industry Consortium on Advanced Automotive Elec-trical/ Electronic Components and Systems. This paper was presented in part at the PESC’02 Conference, Galway, Ireland, June 2000. Recommended by Asso-ciate Editor C. K. Tse.
The authors are with the Laboratory for Electromagnetic and Electronic Systems, Massachusetts Institute of Technology, Cambridge, MA 02139 USA (e-mail: [email protected]; [email protected]).
Digital Object Identifier 10.1109/TPEL.2003.810866
Fig. 1. Dual-voltage automotive electrical system.
is extremely challenging due to the large number of design pos-sibilities that exist and the tight interrelation among many of the design choices. It is also difficult to ascertain a priori how changes in the system-level specifications will affect the cost, weight, and volume of an optimized converter.
In this paper we investigate the computer-aided optimization of power converters for dual-voltage automotive electrical sys-tems. A new computer-aided design (CAD) optimization ap-proach is introduced which allows the design space to be rapidly explored in an automated fashion and the most optimal designs and design approaches to be identified. It also allows the effects of variations in the design specifications on the cost, weight, and volume of an optimized converter to be readily determined, an attribute of particular value to the electrical system designer. Section II of the paper reviews some of the existing work on computer-aided optimization of power electronics. Section III introduces the approach, describes the structure of a new op-timization tool that implements it, and details some of its key elements. Experimental validation of some important models and outputs of the program are also presented. Results demon-strating the use of the new optimization approach are described in Section IV. These include a comparison of a computer-opti-mized design to a conventional design, and illustration of the use of the program to identify both trends in the design space and effects on the design of variations in the design specification. Furthermore, experimental results comparing a prototype opti-mized converter to design predictions and to a prototype nonop-timized converter are presented. Finally, Section V draws con-clusions and presents an overall evaluation of the approach.
II. OPTIMIZATIONBACKGROUND
Computer-aided engineering (CAE) encompasses a range of software tools for use by engineers. Computer-aided analysis (CAA) tools, such as circuit simulators and finite-element mod-eling tools, provide information relating to the performance or analysis of a specified system. Computer-aided design (CAD) tools provide assistance in the design of a system, and in some cases may enable highly automated system design. Computer-0885-8993/03$17.00 © 2003 IEEE
776 IEEE TRANSACTIONS ON POWER ELECTRONICS, VOL. 18, NO. 3, MAY 2003
aided optimization (CAO) tools go a step further, facilitating the optimization of system designs according to specified objec-tives. In the context of power electronics, computer-aided anal-ysis and design are almost universal, while computer-aided op-timization is much less developed.
There has been some previous published work on computer-aided optimization of power electronics. In [4], an optimiza-tion routine is coupled with a circuit simulator to select pa-rameters for a power converter filter. The objective function to be minimized is a predetermined function of the filter induc-tance, capaciinduc-tance, and output voltage ripple. The circuit simu-lator ACSL is used to predict the ripple performance of a design, while a deterministic outer loop searches for the objective func-tion minimum.
In [5] the joint optimization of converter structure and control behavior is formulated as a constrained optimization problem and solved using a numerical optimization procedure. The struc-tural objective of the optimization is formulated in terms of converter losses or efficiency, which are based on simplified closed-form calculations [6], while the control cost is based on a formulation of the control effort and performance. The authors apply this approach to the design of a buck converter, where the plant design parameters are the converter inductance and capac-itance, with other plant parameters fixed. A major disadvantage to this approach is that it requires a very detailed mathematical formulation of the optimization problem.
In [7], computer-aided optimization of a three-phase inverter is considered. The objective function of the optimization is for-mulated in terms of efficiency or temperature rises. Analytical ex-pressions for converter losses and temperature rises are developed and used for the necessary calculations. The optimization is done via stepped search across two design parameters (gate resistance and gate drive voltage) with all other design choices fixed.
While having distinct aspects, the existing investigations have a number of important characteristics in common. First, in each case, only a very small number of parameters are searched over, meaning that only a small fraction of the entire design space is ex-plored. It is not clear to what extent the optimization techniques and problem formulations extend to a more extensive optimiza-tion. Second, all of the techniques consider numerical parame-ters only, without bridging the gap to actual components. For ex-ample, [4], [5] search for optimized inductance values, but there is no tie to actual component design or consideration of actual component nonidealities. This makes it difficult to optimize for quantities such as price, weight, and volume, and does not address many of the issues found in an actual design. Finally, all of these investigations focus primarily on the computations and formu-lation aspects of optimization. However, for a CAD optimization tool to be useful across a large design space and to address compo-nent implementation, user interface and data management issues become very important. It is the authors’ belief that these issues need to be addressed in a fully functional optimization tool.
III. NEWOPTIMIZATIONTOOL
A. Optimization Approach
To address the challenge of optimizing converters for the au-tomotive application, we have developed a CAD optimization
tool that is fundamentally different from those developed previ-ously. The optimization program explores the converter design space to identify the converter design or set of designs that best minimizes an objective function that is a weighted sum of com-ponent volume, weight, and cost.
To perform an optimization run, the design specifications must first be set, including the power rating, ambient temper-ature limit, input and output voltage ranges, and input and output electromagnetic interference (EMI) specifications. The user also has control over the region of the design space to be explored. Design variables considered by the program include a set of power stage topologies, the number of interleaved power stages, switching frequency, inductor ripple ratio, EMI filter topologies, and passive component selection.
A combination of a Monte Carlo system and an expert system is used to choose all the components needed for the converter. In the Monte Carlo approach used, the program chooses random starting points in the user-defined design space, and designs converters that meet the desired specifications based on these starting points. Some components are not chosen randomly. For example, an ex-pert system approach is used to select the heatsink necessary for the design based on the selected power stage components, their computed losses, and the prespecified operating conditions.
Each converter is designed with specific components of known cost, weight, volume, and operating characteristics. Detailed models are used to accurately predict the system be-havior with these components. The output of the program thus consists of converter designs that are composed of available components and have well-defined performance characteris-tics. After the program designs a large number of converters across the possible design space, the results can be analyzed to determine which converter designs are the most desirable.
B. Program Structure
The converter specifications and design variables presently incorporated in the optimization program are those considered appropriate for the automotive power conversion application. For example, only converter topologies and components suit-able for this application are included. Nevertheless, the opti-mization program is object-oriented, and its structure is quite general, so the code itself can be readily modified to admit a wide variety of other specifications and design variables, and can easily be adapted to other applications. The power stage topologies, filter topologies, design variables and algorithms considered by the program are detailed in Appendix A.
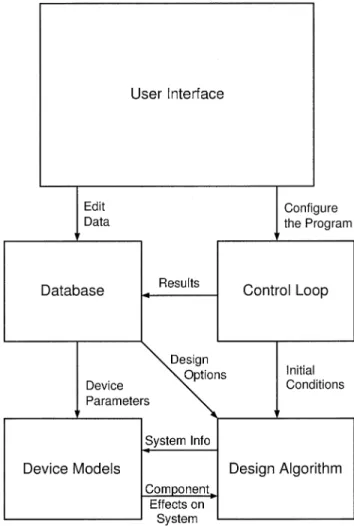
The optimization program consists of five main elements, as illustratedinFig.2.Theseelements arethe controlloop, the design algorithm, the device models, the database, and the user interface. The control loop is the element that guides the search of the design space. It randomly chooses the design starting points to be used for each iteration, and passes these variables to the design algorithm. The design algorithm uses variables generated by the trol loop and previously generated results to design the con-verter subsystems. The design algorithm ensures that any de-signs saved are valid; if a design proves to be invalid at any point the design algorithm stops and the control loop will gen-erate new design variables.
Fig. 2. Structure of the optimization program.
To generate the information necessary for the design of the converter, the design algorithm calls on device models of the converter components. Each of these models consists of code that describes the necessary aspects of a component’s design and use. For example, the model for an inductor contains all the code necessary to design the inductor, as well as to predict its behavior (such as power losses, temperature rises, etc.). If a component can not be found to adequately meet the specifica-tions, then the iteration is declared invalid and the control loop chooses another point in the design space to analyze.
There are three main types of databases used in the CAD pro-gram. The part list databases store information about all the parts that can be used by the optimization program. Configuration databases store the variables used to define the design space and set design specifications. The results databases store the compo-nents used and pertinent information about each valid converter found during the design space search. The user interface has a number of functions. It allows one to edit the properties of all the components in the database, to set up the converter specifi-cations and design space, and to view the optimized designs and other information generated by the program.
C. Optimization and Program Implementation
The optimization process used by the program is illustrated in Fig. 3. The control is divided into an inner and outer control
Fig. 3. Relationships between the control loop and the design algorithm. The outer loop calls the power stage design algorithm. After the power stage is designed the inner control loop runs and the filter stages are designed. The inner control loop iteratesy times and the outer control loop iterates x times.
loop in order to accelerate the optimization process. The outer loop randomly chooses the design variables that are needed to construct the power stage of the converter. The power stage de-sign algorithm then uses these values as initial conditions and determines essential values of the design, chooses components to ensure proper operation of the converter, and makes sure a valid power stage is achieved. If a valid design is found the inner loop and filter design algorithm will attempt to design input and output filters that will meet the EMI specifications. Thus, for each iteration of the outer control loop a power stage will be designed and the inner loop will find input and output filters optimized for that power stage. Greater detail about the opti-mization process is presented in the Appendix. Full details, and a copy of the code, may be found in [8].
Once a design is successfully completed, the program will calculate the total cost, weight and volume of the valid design and save this record in a database. This information can then be used to rank the design and after a thorough examination of the design space the most optimal converter can be found.
The monte carlo search method utilized by the outer control loop provides a randomized search of the design space. The multi-loop search pattern, in conjunction with use of expert system methods to augment the monte carlo methods in the inner loop helps focus the search in realistic portions of the design space and greatly accelerates the search process. One important aspect of the search process is how one decides that an optimum has been reached. The approach we have elected to employ is straightforward and effective: The number of inner-loop operations per iteration of the outer loop is preselected. The outer loop runs for a prespecified number of iterations (e.g., 10 000 iterations), and the resulting designs
778 IEEE TRANSACTIONS ON POWER ELECTRONICS, VOL. 18, NO. 3, MAY 2003
are ranked based on the optimization objective (a prespecified function of component weight, volume and price). The outer loop is then continued for an additional number of iterations (e.g., 1000 runs), and the improvement in best design is noted. The continuation runs are repeated until the best design found has not improved between runs. This approach by no means guarantees that an optimum has been found. However, we have found this to be highly effective for exploring the design space and identifying highly-optimized designs. We also note that additional tools within the optimization program have been developed to evaluate why failed iterations occur (e.g., magnetics design failure, failure to find an appropriate heatsink, etc.) This allows shortcomings in the component database to be identified, and provides a window on what aspects of the design specification are most challenging.
D. Subsystem Design Example
For every major component used in the converter there are subroutines that accurately model the component and make ap-propriate design decisions for it.1For example, consider the
sub-routine used to design the converter power stage inductors. The routine takes as input the desired inductance and operating range and utilizes the database of available inductor cores and their properties. The routine’s output includes the chosen core, the number of turns and wire gauge needed, the power dissipated in the core, and its temperature rise. The potential inductor cores are ranked beforehand based on their suitability; for example the cores may be pre-ranked on cost. The program then finds the lowest ranked core that is suitable for the design. The first step in the design is to find the number of turns needed and the resulting flux density that will be induced in the core. If this flux density is high enough to saturate the core, the core is rejected as a candidate. The next step is to determine the wire size. The turns of wire must fit within the window area of the core. The program finds the largest diameter wire that will fit within the window area. The program verifies that this wire size will result in a maximum current density, J , of less then 3000 A/in (ap-proximately 465 A/cm in the wire. If not, the core is rejected as a candidate.
Because of the significant dc and ripple components in the current waveform, there will be significant winding and core losses. The winding loss for the inductor, including skin and proximity effect, is computed using the models developed in [9]. Specifically, the winding loss is calculated as a summation of the power losses caused by every frequency component of the inductor current
(1)
where is the rms current at the th harmonic frequency, and is the effective resistance of the wire at that fre-quency. The effective resistance of the wire is frequency depen-dent; at higher frequencies the current will be restricted to the
1Full details of all subsystem models and computation techniques are
avail-able in [8].
surface of the wire. This outer region, or skin depth, is given as (2) where , and are the harmonic number, the resistivity and permeability of copper.
The thickness of the wire in skin depths taking into account proximity effects is
(3) where is the wire diameter and is the spacing between the wires. The effective resistance of the wire at the th harmonic is then
(4) where is the number of layers of windings and
(5)
(6) The resistance of the wire at dc is simply the length of the wire used to create all the turns times the resistance per length of the wire. The length of the wire used is the number of turns needed times the mean length per turn (MLT) for a given core.
To calculate core loss, the ac flux swing in the core is ap-proximated as a sinusoid and the core loss is calculated using the empirical Steinmetz model [10], [11]
(7) using model parameters provided by Ferroxcube/Phillips [12]. Based on the sum of winding and core losses, the centerpost temperature rise of the core can be estimated as the product of the power dissipation and the thermal resistance of the core. If the temperature rise is above the maximum allowable tempera-ture, the inductor design is rejected. Otherwise the program ac-cepts the design of the inductor.
E. Program Validation
In order for the optimization program to be useful for ex-ploring the design space, it must be able to generate realistic converter designs and be able to accurately predict operating characteristics such as losses, temperature rises, and EMI per-formance. A great deal of emphasis has been placed on vali-dating the modeling and predictions made by the optimization program for this reason. One example of experimental valida-tion of the program models is illustrated in Table I. The heat sink and inductor core temperature rises of an experimental pro-totype were compared with the predictions for that design made by the optimization program models. The close match between these values indicates that the optimization program models ac-curately predict both the temperature rise and power loss for these elements [13].
TABLE I
COMPARISON OFINDUCTORCORE ANDHEATSINKTEMPERATURERISES OF AN
EXPERIMENTALPROTOTYPE TOTHOSEPREDICTED BY THEOPTIMIZATION
PROGRAM. VALUES ARE FOR ASPECIFICCONVERTEROPERATING AT500 WIN
25 C AMBIENTTEMPERATURE; PREDICTIONS ANDMEASUREMENTS ATRATED
POWER ANDAMBIENTTEMPERATURE(1000 W, 105 C) WOULD BEHIGHER
TABLE II
DESIGNSPECIFICATIONS FOR APOWERCONVERTER IN ADUAL-VOLTAGE
AUTOMOTIVEELECTRICALSYSTEM
IV. RESULTS
The optimization program generates converter designs and ranks them based on a specified weighted sum of component cost, weight, and volume. The results can then be used to identify converter designs that best meet the specified objective function or to study trends within the design space. To illus-trate the use of the program for these purposes, we consider example results for the (component) volume optimization of dc/dc converters meeting the specifications on Table II. (These specifications are typical of what might be required of a power converter for a future dual-voltage automotive electrical system.) Note that component volume is computed as the sum of the volumes of the three-dimensional outlines of the individual components. For example, the volume of a rectangular heat sink is computed as the volume of the smallest box in which it would fit.
Two uses of the presented optimization technique were explored. First, the application of the approach for investigating trends in the design space was explored. This is useful for quantitatively establishing the effects of operating conditions requirements and design specification on the size, weight and cost of a design. Second, the use of the technique for designing an optimized converter for a given specification was explored. We consider each of these uses in turn.
A. Exploration of Design Trends
The optimization program can be used to investigate trends in the design space. For example, Fig. 4 illustrates how the compo-nent volume of a volume-optimized converter varies with power
Fig. 4. Relationship between the component volume of the volume-optimized converter and its power rating.
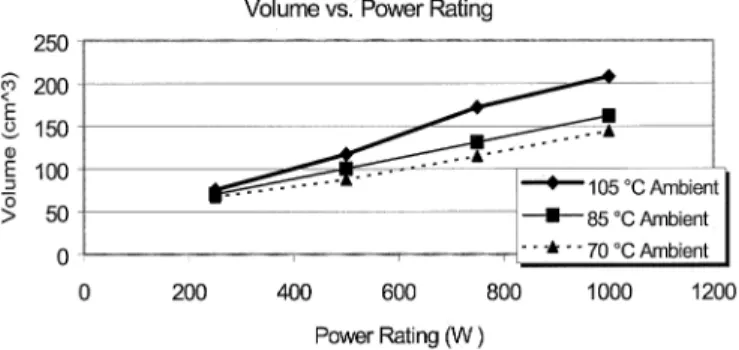
Fig. 5. Volume of the smallest converter at various power ratings for three different ambient temperatures.
rating. To obtain this data, the optimization program was used to identify the minimum volume design for converters rated at 250, 500, 750, and 1000 W (with other specifications as per Table II). Interpolating between the volumes of these optimization cases, one finds an approximately (incrementally) linear relationship between converter volume and power rating which can be rep-resented as
Volume cm Power W
over this range. Evaluations of converter weight, cost, and other attributes can also be made. This type of result is difficult to obtain by conventional means, and is of particular value to the automotive electrical system designer who must trade converter size, weight, and cost against other system-level design consid-erations.
The computer-aided optimization approach is also useful for studying the sensitivity of the optimized converter design to changes in required operating conditions. For example, the re-lationship between the volume of a volume-optimized converter and its power rating is dependent upon the ambient temperature specification of the converter. Fig. 5 shows this temperature de-pendence, calculated using the same process as above across different ambient temperature requirements. The sensitivity of converter size to increases in ambient temperature rating be-comes pronounced at higher temperature and power levels. This
780 IEEE TRANSACTIONS ON POWER ELECTRONICS, VOL. 18, NO. 3, MAY 2003
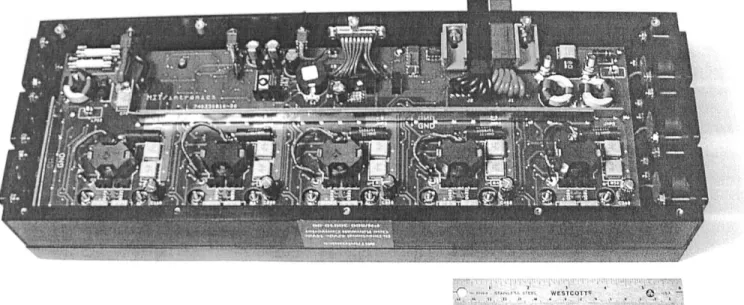
Fig. 6. Volume optimized bidirectional dc/dc converter.
is expected since temperature rise margins and component avail-ability become impinged at high temperatures and power levels, but would be difficult to quantify without such an automated de-sign tool.
Other design requirements (such as EMI specifications) also have a strong effect on the optimized converter design. These sensitivities can be much more easily determined using the pro-posed CAD optimization approach than is possible by conven-tional means.
B. Optimized Converter Design
Use of the optimization technique was also explored for developing optimized converter designs. During the course of this work, two dc/dc converters based on the specifications of Table II2 were designed, constructed, and tested. The first
prototype converter was designed without the aid of the opti-mization tool, although the various subsystems were designed toward low volume and cost using many of the same models and design rules as used in the optimization tool. The second prototype converter was designed using the computer-aided optimization tool described here, with an objective function of minimum component volume. The second converter is capable of bidirectional operation, and is packaged for automotive use.
Development of the first converter proceeded along conven-tional lines: a power stage design was first developed based on hand and computer calculations and simulations. Following this, input and output filters were designed to meet the EMI require-ments, and a suitable controller was developed. After proto-typing the design, minor adjustments were made (e.g., to snub-bers, etc.) to ensure that the design goals were met.
For the second prototype, the optimization tool was used to identify the component volume optimum converter design over the specified design space. The optimizer generated the power
2In both cases, the converter power stages were designed for an ambient
tem-perature of 105 C as per Table II. However, the availability of control and other components ultimately limited the prototype converters to 70 C ambient temperature.
stage and filter designs, including selection of the semicon-ductor devices, passive components, and heat sinks.3 A suitable
bi-directional controller was developed based on this design. Just as with the nonoptimized converter, a number of minor adjustments were made after prototyping the design. Several units of the resulting design were constructed and heavily tested, and were found to meet all of the design specifications. Fig. 6 shows a picture of the optimized converter with the cover removed; details about the converter are presented in Appendix B.
A comparison of the nonoptimized and optimized converters shows that component volume is lower by a factor of six in the optimized converter as compared to the nonoptimized converter. This improvement is principally due to the fact that the opti-mizer was able to fully explore the design space and jointly op-timize the number of power stages, the power stage design, and the filter designs to minimize the component volume. A sec-ondary factor was that the optimizer selected a capacitor type that was more volumetrically efficient than those considered for the nonoptimized design. However, even allowing for the use of more volumetrically efficient capacitors in the nonoptimized converter, a factor of four improvement would still have been achieved.
Comparison of packaged converter volume shows that a smaller but still significant improvement is achieved using the computer-aided optimization method, as illustrated in Fig. 7. The packaged volume of the nonoptimized converter is a factor of 1.6 larger than that of the optimized converter (6000 cm as compared to 3700 cm . Care must be taken in comparing the packaged volume of the two converters. In addition to using more volumetrically-efficient capacitors as previously mentioned, the optimized converter also utilizes pcb-mount bus bars (to carry large currents without large trace
3To simplify the packaging for automotive use, the board-mountable heat
sinks selected by the optimizer were not used. Rather, the semiconductor de-vices are thermally connected to a baseplate forming part of the converter en-closure. This baseplate is then connected to either an external extruded heat sink or to another surface with similar thermal resistance.
Fig. 7. Scaled comparison of the two prototype converters. The hashed section on the volume-optimized converter represents the heatsink needed if the converter is not mounted on an appropriate surface. The total packaged volume of the original converter is 6000 cm . The packaged volume of the volume-optimized converter is 2170 cm without the heatsink and 3700 cm with it.
areas), and makes more extensive use of surface mount control components. However, these volumetric advantages are largely offset by the volume cost of fully packaging the optimized con-verter for underhood automotive use.4 We conclude that—to
first order—a comparison of the packaged volume of the two converters reflects the improvement that is achieved with the implemented optimization technique.
The smaller improvement in packaged volume as compared to component volume reflects the fact that it is component volume that underwent optimization. While component volume is a useful metric for a design, packaged volume may be of greater interest in many cases. One possible method of extending the technique to optimize packaged volume would be to include footprint area and height for each component in the database. The optimizer could then approximate packaged volume by multiplying the sum of the footprint areas of the components by the maximum height of the components and an additional packing factor. This would not pre-cisely correspond to packaged volume (as layout considerations arenotincluded),butwouldbemorereflectiveofpackagedvolume than component volume alone. Nevertheless, component volume is a useful design metric, as are component mass and cost and ob-jective functions related to them.
We conclude from the experimental results that the computer-aided optimization technique introduced here is useful for re-alizing optimized converter designs with improved metrics as compared to converters designed by conventional means. Com-ponent volume optimization has been demonstrated to yield a large improvement in component volume and a smaller but sig-nificant improvement in packaged volume. Component mass or cost optimization (or combinations of mass, cost, and volume) using the means introduce here would also be expected to re-alize significant benefits.
Nevertheless, we find there remain a number of challenges to be addressed in achieving true computer optimization. First, means need to be found to better represent packaged converter volume (including layout and form factor considerations) for a given set of components. Second, some means of including con-verter control characteristics as part of the optimization process would be of great value, particularly for applications where tran-sient response is an important consideration. Finally, means for
4Packaging the converter in a protected enclosure having acceptable thermal
characteristics, form factor, and interconnects introduces constraints that in-crease the fully packaged volume over what might be otherwise achievable.
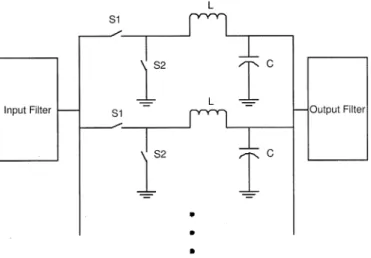
Fig. 8. All dc/dc converters considered in the optimization routine consist of an input and output filter. A number,N, of interleaved power stages are buck converters. The high side device, S1 will be a MOSFET, whereas the low side device, S2, can either be a MOSFET, Schottky diode, or a PiN Diode.
including broader ranges of topologies and operating modes need to be developed, particularly when a wider range of ap-plications are to be addressed via computer-aided optimization. Developments in these areas would serve to provide more re-fined optimization results for the designer to utilize.
V. CONCLUSION
Power converters for dual-voltage automotive electrical sys-tems will be manufactured in high production volumes under tight cost, size, and mass constraints. To address the challenge of designing converters for this application, this paper investigates computer-aided optimization of dc/dc converters. A new CAD optimization approach based on Monte Carlo search methods is introduced which allows the design space to be rapidly explored in an automated fashion and the most optimal designs and de-sign approaches to be identified. The output of the program con-sists of converter designs that are composed of available com-ponents and have well-defined performance characteristics.
The program allows the effects of variations in design speci-fications on the cost, weight, and volume of an optimized con-verter to be readily determined. This is of particular value to the automotive designer who must trade off the power converter de-sign against system-level considerations. The approach is also valuable for developing highly optimized converter designs.
Use of the techniques in component volume optimization of a dc–dc converter for automotive application has been demon-strated. Substantial improvements in component volume and packaged converter volume for a converter have been experi-mentally demonstrated. It may be concluded that the presented approach and refinements based upon it may have value in high-production volume applications where design optimization is of great importance.
APPENDIX A
The power conversion architecture considered by the opti-mization program is illustrated in Fig. 8. This architecture com-prises of an input filter (from the set of filter topologies
il-782 IEEE TRANSACTIONS ON POWER ELECTRONICS, VOL. 18, NO. 3, MAY 2003
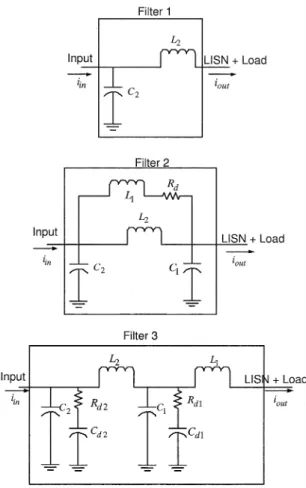
Fig. 9. Possible filter topologies.
lustrated in Fig. 9), a power stage of interleaved buck cells, and an output filter (from the set of topologies illustrated in Fig. 9). The power stage may be composed of any number of cells, and the individual cells may use PiN, Schottky, or syn-chronous (MOSFET) rectifiers. This conversion architecture is highly suited to automotive 42/14 V power converters, and is appropriate for a range of other applications including voltage regulator modules for microprocessors.
The design algorithm employed in the CAD optimization tool may be summarized as follows.
Incorporate user specified run parameters
Outer Control Loop
Select number of cells in power stage (random in user-defined range)
Select cell ripple ratio (random in user-de-fined range)
Select cell switching frequency (random in user-defined range)
Select switching devices from parts library (random selection)
Power Stage Design
Calculate device losses
Select lowest-ranked heatsink that meets temperature limits (Exit iteration if no heatsink found)
Design power stage inductor (see Sec-tion III-D; Exit iteraSec-tion if no acceptable design found)
Inner Control Loop Input Filter Design
Calculate power stage ripple
Select filter topology (random from pre-determined set)
Select filter capacitor (random from ap-propriate set in library)
Apply filter design rules to select re-maining filter component values
(to meet EMI specifications). Exit iter-ation if acceptable design not found.
Design EMI filter inductor(s)
Output Filter Design
Calculate power stage ripple
Select filter topology (random from pre-determined set)
Select filter capacitor (random from ap-propriate set in library)
Apply filter design rules to select re-maining filter component values
(to meet EMI specifications). Exit iter-ation if acceptable design not found.
Design EMI filter inductor(s) Repeat inner control loop specified
number of times and select best filters
Repeat outer loop specified number of times and record all valid designs.
The program utilizes a user-supplied library containing infor-mation about all of the relevant components and their charac-teristics. Several types of components (e.g., inductor cores) are pre-ranked based on the desired criterion (i.e., a combination of weight, volume and cost) and the program will always select the lowest-ranked component that meets the requirement.
APPENDIX B
This appendix provides additional detail about the optimized converter design. The optimized converter comprises five paralleled power stages along with input and output filters and control circuitry. The power stages operate at a nom-inal switching frequency of 82 kHz, and are interleaved to improve the net input and output ripple. Each stage utilizes SUP75N08-10 MOSFET’s as switches. The 8 H power stage inductors are wound with 7 turns of 12-gauge equivalent Litz wire on RM10-3F3-PA160 cores (resulting in a nominal power stage ripple ratio of approximately 52%). The stages each have two 4.7 F, 100 V multilayer polymer film capacitors (ITW Paktron type 475K100V) at both their input and output. The input and output EMI filters are of Type 2 (as defined in Appendix A). The input (42 V-side) filter uses a 4.7 F, 100 V film capacitor (ITW Paktron type 475K100V) as C , and the distributed power stage input capacitors (23.5 F total) as C .
The input filter inductor is 0.19 H built with two turns of two paralleled strands of 10-gauge-equivalent stranded wire on a Micrometals T80-26 core. The small damping leg is 0.27 H in series with 0.1 . Similarly, the output (14 V side) filter uses the (distributed) power stage capacitors as capacitor C2, and a 4.7 F, 100 V film capacitor (ITW Paktron type 475K100V) as C1. The filter inductor is two paralleled 0.74 H inductors each built from 4 turns of 10-gauge-equivalent stranded wire on a Micrometals T80-26 core, and the damping leg is 0.1 in series with 0.07 H. The final designs also incorporates small RC damping legs (47 F electrolytic, 1 ) at the input and output of each power stage in parallel with the filter capacitors. Control design was carried out by hand, and was not part of the optimization routine. (Nevertheless, consideration of control characteristics as part of the optimization is likely to be advan-tageous in applications where high control bandwidth is impor-tant.) Each power stage operates with interleaved clocks from a centralized clock generator circuit. The power stages operate under average current-mode control, and regulate to a single cur-rent reference developed by centralized circuitry. The nature of the outer-loop voltage control is determined by manual switch settings or by a digital input (which overrides the manual set-tings). The converter can be set to regulate the 14 V side (buck mode), the 42 V side (boost mode), or to follow a digital current command (regulation set by external computer control). The converter is designed to operate stably in either buck or boost modes, with or without a battery on the regulated side, with any amount of bus capacitance, and with any type of resistive or current-sink loading (testing specifications were for minimum loads of 12.5% in buck and 5% in boost). This provided a high degree of robustness in the final design, but resulted in rather low closed-loop regulation bandwidths.
The resulting converter weighs 3.6 kg (fully packaged, in-cluding the optional heat sink); this compares favorably to the first prototype, which was 4.9 kg (without a full enclosure). The optimized converter was heavily tested under a wide range of environmental and loading conditions. Efficiency varied with load, input voltage range, operating mode (buck or boost), and temperature. Full-load efficiency varied between 92% and 94% in buck mode and 91% and 95% in boost mode. Minimum-load efficiency varied between 80% and 89% in buck mode and 78% and 87% in boost mode.
ACKNOWLEDGMENT
The authors would like to thank A. Pfaelzer, A. Parker, M. Weiner, and J. Fitzgerald, Intronics Corp., Norwood, MA, for their assistance in the manufacturing and testing of the opti-mized converter.
REFERENCES
[1] J. G. Kassakian, H.-C. Wolf, J. M. Miller, and C. J. Hurton, “The future of automotive electrical systems,” in Proc. IEEE Workshop Power
Elec-tron. Transport., Dearborn, MI, Oct. 24–25, 1996, pp. 3–12.
[2] J. M. Miller, D. Goel, D. Kaminski, H.-P. Schöner, and T. M. Jahns, “Making the case for a next generation automotive electrical system,” in Proc. 1998 Int. Congr. Transport. Electron. (Convergence’98), 1998, pp. 41–51.
[3] J. G. Kassakian, H.-C. Wolf, J. M. Miller, and C. J. Hurton, “Automotive electrical systems circa 2005,” IEEE Spectrum, pp. 22–27, Aug. 1996. [4] J. J. Jeyappragash, T. V. Sivakumar, and V. V. Sastry, “Object oriented
modeling, simulation and optimization of power electronic circuits,” in
Proc. 1996 IEEE Power Electron. Spec. Conf., pp. 581–585.
[5] C. Gezgin, B. S. Heck, and R. M. Bass, “Simultaneous design of power stage and controller for switching power supplies,” IEEE Trans. Power
Electron., vol. 12, pp. 558–566, May 1997.
[6] A. Reatti, “Steady-state analysis including parasitic components and switching losses of buck and boost DC-DC PWM converters under any operating condition,” Int. J. Electron., vol. 77, no. 5, pp. 679–701, 1994. [7] F. Blaabjerg and J. K. Pedersen, “Optimized design of a complete three-phase PWM-VS inverter,” IEEE Trans. Power Electron., vol. 12, pp. 567–577, May 1997.
[8] T. C. Neugebauer, “Computer-aided design and optimization of dc/dc power converters,” S.M. dissertation, Dept. of Elect. Eng. and Comp. Sci., Mass. Inst. Technol., Cambridge, MA, Sept. 1999.
[9] B. Carsten, “High frequency conductor losses in switchmode mag-netics,” Power Conv. Intell. Motion Mag. (PCIM), pp. 34–46, Nov. 1986.
[10] J. Reinert, A. Brockmeyer, and R. W. DeDoncker, “Calculation of losses in Ferro- and Ferrimagnetic materials based on the modified Steinmetz equation,” in Proc. 1999 IEEE Ind. Applicat. Soc. Annu. Meeting, Oct. 1999, pp. 2087–2092.
[11] J. Li, T. Abdallah, and C. R. Sullivan, “Improved calculation of core loss with nonsinusoidal waveforms,” in Proc. 2001 IEEE Ind. Applicat. Soc.
Annu. Meeting, Oct. 2001.
[12] Ferrite Material and Components Catalog, 8th ed. Riviera Beach, FL: Philips Components, 2002.
[13] SAE EMI Standards Committee, “Limits and methods of measurement of radio disturbance characteristics of components and modules for the protection of receivers used on board vehicles,” Tech. Rep., SAE Stan-dards SAE J1113/41, July 1995.
Timothy C. Neugebauer (S’99) received the B.S.
degree in electrical engineering from Union College, Schenectady, NY, in 1997 and the M.S. degree from the Massachusetts Institute of Technology (MIT), Cambridge, in 1999 where he is currently pursuing the Ph.D. degree in power electronics.
Since 1997, he has been with the LEES Labora-tory, MIT. He has worked in the areas of dc/dc con-verters, multilevel incon-verters, and the design of passive elements.
David J. Perreault (M’99) received the B.S. degree
from Boston University, Boston, MA, in 1989, and the S.M. and Ph.D. degrees from the Massachusetts Institute of Technology (MIT), Cambridge, MA, in 1991 and 1997, respectively.
In 1997, he joined the MIT Laboratory for Electro-magnetic and Electronic Systems as a Postdoctoral Associate, and became a Research Scientist in the laboratory in 1999. In July of 2001, he joined the MIT Department of Electrical Engineering and Computer Science as an Assistant Professor. At present, his re-search interests are in design, manufacturing, and control techniques for power electronic systems and components, and in their use in industrial, commercial, transportation, and medical applications. He teaches a graduate-level course in power electronics at MIT, and is a consultant to industry in the field.
Dr. Perreault received the IEEE Richard M. Bass Outstanding Young Power Electronics Engineer Award and the ONR Young Investigator Award. He is a member of Tau Beta Pi and Sigma Xi.