HAL Id: hal-02186747
https://hal.univ-lorraine.fr/hal-02186747
Submitted on 17 Jul 2019HAL is a multi-disciplinary open access archive for the deposit and dissemination of sci-entific research documents, whether they are pub-lished or not. The documents may come from teaching and research institutions in France or abroad, or from public or private research centers.
L’archive ouverte pluridisciplinaire HAL, est destinée au dépôt et à la diffusion de documents scientifiques de niveau recherche, publiés ou non, émanant des établissements d’enseignement et de recherche français ou étrangers, des laboratoires publics ou privés.
Operating heterogeneities in a PEM Electrochemical
Hydrogen Compressor
Giuseppe Sdanghi, Jérôme Dillet, Sophie Didierjean, Vanessa Fierro, Gaël
Maranzana
To cite this version:
Giuseppe Sdanghi, Jérôme Dillet, Sophie Didierjean, Vanessa Fierro, Gaël Maranzana. Operating heterogeneities in a PEM Electrochemical Hydrogen Compressor. 8th International Conference on Fundamentals and Development of Fuel Cells 2019, Feb 2019, Nantes, France. �hal-02186747�
1
Operating heterogeneities in a PEM Electrochemical Hydrogen Compressor
G. Sdanghi1,2, J. Dillet2, S. Didierjean2, V. Fierro1, G. Maranzana21Institut Jean Lamour, UMR 7198 CNRS and Université de Lorraine, Épinal, France
2Laboratoire d'Energétique et de Mécanique Théorique et Appliquée, UMR 7563 CNRS and Université de
Lorraine, Vandœuvre-lès-Nancy, France [email protected]
Keywords: compression, hydrogen, polymer electrolyte Abstract
In this study, the local behavior of an electrochemical hydrogen compressor (EHC) was investigated. A local dehydration of the polymer electrolyte membrane (PEM) was experimentally observed, due to the unbalanced contribution of the electro-osmosis flow and the back diffusion of water across the membrane. Such operating heterogeneities can significantly affect the overall efficiency of an EHC. A pseudo 2D model was developed along with experimental studies in order to estimate the physical parameters enhancing the overall efficiency of the system.
1. Introduction
Electrochemical hydrogen compressor (EHC) has proven to be a valid solution to compress hydrogen. Even though pressures up to 1000 bar can be reached using an EHC [1], very high pressure gradients can cause issues related to sealing and the diffusion of dissolved hydrogen molecules across the membrane from the high pressure cathode to the low pressure anode, decreasing the overall efficiency. Rohland et al. [2] showed that hydrogen permeation across the membrane is a function of both the pressure gradient and the temperature. In particular, they showed that the higher the EHC temperature, the higher the hydrogen permeation. Grigoriev et al. [3] showed that it is possible to compress hydrogen from atmospheric pressure to 48 bar in a single step with an energy consumption of 0.3 kWh/Nm3 and an efficiency around 50%. This
value is in average higher than those obtained with mechanical compressors [4].
Water management is an important issue in an EHC. As in proton electrolyte membrane fuel cells (PEMFCs), the polymer electrolyte membrane (PEM) has to be hydrated in order to enhance its proton conductivity. Nevertheless, contrarily to PEMFCs, water is not a reaction product in an EHC, thus it needs to be fed along with hydrogen in order to preserve the optimal hydration degree of the membrane. Onda et al. [5] found that both the hydrogen concentration in the gas distribution channels and the current density distribution decrease along the channel direction during operation. This behavior was found to be directly related to the water transport across the membrane. Heterogeneities in the distribution of the electric resistances are the main consequence of the unstable water flow across the membrane: specifically, the local dehydration of the membrane can lead to an increase of the electric resistance of the system, which in turn makes the current density decreasing.
In this study, the local behavior of an EHC is investigated and the effect of the humidity of feed gas, temperature and membrane thickness was evaluated and discussed. A pseudo 2D model taking into account the overall mass and energy balance occurring in the EHC, as well as the heterogeneities introduced above, was developed along with the experimental investigation.
2. Experimental
A single 30 x 1 cm2 cell segmented in 20 electrically-insulated parts of 1.5 cm2 each was used. All
segments are connected after the measurement system so that they operate at identical voltage. Such a system allowed measuring the distribution of both the current densities and the electric resistances along the channel direction, the latter measured by impedance spectroscopy. An external power supply of nominal capacity of 150 A was used. The EHC temperature was fixed by using a hot water circulating system realized in the support plates. Hydrogen was fed to the cell after bubbling it through water for humidification. All the lines were overheated in order to prevent water condensation and purged with nitrogen before each experiment. The feed hydrogen flowed on the anode side through 5 parallel channels of 1 mm x 1 mm x 300 mm realized
2
on the support plates. Unreacted hydrogen was collected at the anode outlet and its humidity was measured by a probe. On the other hand, the cathode inlet was blocked. A condenser unit was placed on the cathode outlet to remove water in excess from the high pressure hydrogen flow. A pressure regulator was placed downward the condenser unit to regulate the discharge pressure of hydrogen. The membrane-electrode-assemblies (MEAs) used were supplied by Ion Power. Gas diffusion layers (GDLs) Sigracet® and sintered titanium with a pore size of 5µm were used at the cathode and at the anode respectively.
3. Model
A pseudo 2D model was developed to simulate: (i) the mass transport through the GDLs; (ii) the charge and mass transport through the membrane; (iii) water absorption and desorption phenomena and (iv) the temperature dynamic through the whole EHC, by taking into account the variation of water and hydrogen concentrations along the channel direction (Figure 1). Such approach proved to be computationally efficient compared to 3D models [6].
Figure 1: Schematic of the segmented cell used and the pseudo-2D model Hydrogen and water transport along the gas channels
The mass transport along the channel direction (y-axis) allows finding the water and hydrogen concentrations at the anode gas channels for each control volume k. Those values are used as boundary conditions for the balances in the across-the-membrane direction (x-axis).
Hydrogen flow rate changes because of both the consumption on the anode (where hydrogen oxidation occurs) and the contribution given by the dissolved hydrogen molecules permeating across the membrane because of the pressure gradient. Thus, the hydrogen flow rate nH2 [mol/s] along the anode gas channels is given by: 𝑑𝑛𝐻2 𝑑𝑦 = −𝑝 [ 𝑖(𝑦) 2𝐹 + 𝑁𝐻2,𝑝𝑒𝑟𝑚], 𝑛𝐻2,𝑖𝑛 = 𝑆 𝐴 𝐼 2𝐹 (1)
where p is the width of the active area [cm], i(y) is the local current density [A/cm2], S is the stoichiometric
ratio, A is the active area [cm2] and NH2,perm is the hydrogen molar flux [mol/ cm-2 s-1] permeating across the
membrane. The latter can be defined as following:
𝑁𝐻2,𝑝𝑒𝑟𝑚 = 𝜀0𝑒𝑥𝑝 (−𝐸𝜀 𝑘𝐵𝑇) ∗ ( 𝑃𝐻2 𝑐𝑎𝑡− 𝑃 𝐻2 𝑎𝑛 𝛿𝑚𝑒𝑚𝑏 ) (2)
The permeation flux depends on the gas permeability, the difference of hydrogen partial pressure at the cathode PH2cat and at the anode PH2an and the membrane thickness δmemb [cm]. We used the expression
proposed by Schalenbach et al. [7] to describe the temperature dependence of the hydrogen permeability through the membrane. The values of the parameters ε0 and Eε were taken from literature [8].
On the other hand, water concentration changes along the y-axis mainly because of the transport across the diffusion layers and the membrane:
𝑑𝑛𝐻2𝑂 𝑑𝑦 = 𝑝𝑁𝐻2𝑂,𝑃𝑇𝐿 , 𝑛𝐻2𝑂,𝑖𝑛 = 𝑆 𝐴 𝐼 2𝐹 𝑅𝐻𝑎𝑛 𝑝𝑠𝑎𝑡 𝑃𝑎𝑛− 𝐻𝑅𝑎𝑛 𝑝𝑠𝑎𝑡 (3)
3
where nH20 is the water flow rate along the distribution channels [mol/s], NH20 is the water molar flux [mol/ cm-2 s-1] across the GDL, RHan is the relative humidity, p
sat is the saturation pressure and Pan is the anode pressure.
Hydrogen and water transport across the GDLs
The Stefan-Maxwell equation, well describing the multicomponent diffusion in a porous medium, was used to predict hydrogen and water diffusion across the GDL. In the specific case of binary diffusion, the equation takes the following form:
𝑑𝑦𝑖𝑃𝑇𝐿 𝑑𝑥 = 1 𝑐𝐷𝑖,𝑗𝑒𝑓𝑓[𝑦𝑖(𝑁𝑖 𝑃𝑇𝐿+ 𝑁 𝑗) − 𝑁𝑖𝑃𝑇𝐿] (4)
where yi is the molar fraction of hydrogen or water, Ni is the molar flux [mol cm-2s-1] and Deffis the effective
diffusion coefficient [cm2/s], which takes into account the porosity of the GDL [9].
Water transport across the membrane
Water transport across the membrane occurs via two main mechanisms: electro-osmosis and water back diffusion. The electro-osmosis flow takes place when water molecules are dragged across the membrane by the protons because of the electrostatic attraction (from anode to cathode). On the other hand, water back diffusion occurs as a consequence of the water concentration gradient across the membrane (from the cathode to the anode). The global water flux across the membrane is described by the following equation: 𝑁𝐻𝑚𝑒𝑚𝑏2𝑂 = 𝜁𝑖(𝑦) 𝐹 − 𝐷𝐻2𝑂 𝑚𝑒𝑚𝑏𝜌𝑑𝑟𝑦 𝐸𝑊 𝑑𝜆 𝑑𝑥 (5)
where ζ is the electro-osmotic drag coefficient, ρdry is the dry membrane density [kg/cm3], EW is the
membrane equivalent weight [kg/mol], DH2Omemb is the diffusion coefficient of water across the membrane [cm2/s] and λ is the water content of the membrane, defined as follows [10]:
𝜆 = 0.043 + 17.81𝑎 − 39.85𝑎2+ 36𝑎3 (6)
where a is the water activity. Because of the high pressures, we considered that the humidity on the cathode side was equal to 100% (λ=14), i.e. water concentration on the cathode side was supposed to be equal to the concentration at saturation conditions.
Voltage
The voltage to be supplied to the EHC is given by the following equation: 𝐸 = 𝐸𝑁𝑒𝑟𝑛𝑠𝑡+ 𝐸𝑎𝑐𝑡+ 𝑅𝐼 = 𝐸𝑁𝑒𝑟𝑛𝑠𝑡+ 𝐸𝑎𝑐𝑡+
𝛿𝑚𝑒𝑚𝑏 𝜎 𝐼
(7)
where ENernst is the Nernst potential, Eact is the activation overpotential and R incorporates the electric resistance of the membrane, electrode, contacts and cell hardware. Actually, the electrical resistance of the membrane is the main factor affecting the performance of an EHC [11], and can be defined as the membrane thickness (δmemb) /membrane conductivity (σ) ratio. In the case of the EHC, the activation overpotential Eact is negligible since both the hydrogen oxidation and reduction reactions are highly reversible [12].
Heat transfer and temperature dynamic
To describe the heat transfer along the x-axis, an approach based on an equivalent electric circuit was used (Figure 2).
4
Figure 2: Equivalent electric circuit for the heat transfer across-the-membrane direction
The thermic resistances Ri are defined as zi /ki , where zi are the thickness of the GDL or membrane and ki their thermal conductivity. Both the heat of condensation and the heat of vaporization of water at the boundaries of the membrane are taken into account according to the water adsorption and desorption phenomena, as well as the Joule losses due to the electric resistance of the membrane.
4. Results and discussion Effect of humidity
Figure 3 shows the distribution of the local current densities in an EHC considering different humidity percentages in hydrogen:
Figure 3: Distribution of the current density in an EHC for different values of relative humidity of the inlet hydrogen (Temperature 60 °C, cathode pressure 4 bar, supplied current 0.66 A/cm2, membrane thickness
175 μm)
For a relative humidity of 30%, the current density increased in the first segments until the middle of the EHC, becoming stable until the anode outlet afterwards. This evolution is directly related to a decrease of the electric resistance of the membrane, i.e. an increase of its proton conductivity, as seen in Eq. 5. Hence, it is clearly deduced that a gradual hydration of the membrane occurred. This behavior is due to the unbalanced contribution of the two main water transport mechanisms across the membrane, i.e. the electro-osmotic drag and the water back diffusion. In the first segments of the EHC, the water concentration gradient through the membrane is high (because of dry inlet conditions). The back diffusion water flow is therefore higher than the electroosmotic one, which leads to a net flow of water directed from the cathode to the anode, thus enriching the flow in the direction of the anodic channel. Once water concentration in the gas channels increased, water transport by back diffusion became lower, and it gradually balanced the electro-osmotic flow, making the current density stable.
On the other hand, when the humidity of the feed hydrogen was relatively high, as in the case of RH=90%, the observed behavior was completely opposite. A decrease in the current density along the first segments of the cell was observed, meaning that a gradual dehydration of the membrane occurred. It must be considered that water is not a reaction product in an EHC unlike the PEMFCs, thus it must be fed along with hydrogen on the anode side. As a consequence, since water crosses the membrane mainly because of electro-osmosis in the first centimeters of the cell, the water concentration progressively decreased. Hence, water transport by back diffusion became important close to the anode outlet, stabilizing the membrane resistance – at lower values than in the first centimeters of the EHC because of dehydration – and the current density.
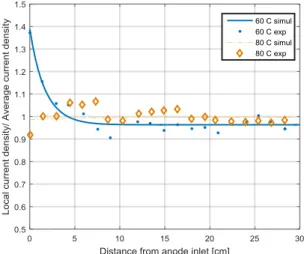
Effect of average temperature
Figure 4 shows the effect of the average temperature on the distribution of the current density along the EHC. At 80°C and RH=90%, the current density was quite homogeneously distributed over the whole system, whereas at 60 °C and at the same humidity of the inlet hydrogen a dehydration of the membrane was
5
observed. This can be explained by the high water vapor pressure at high temperature and higher diffusion coefficients, as the electro-osmosis water flow is considered as not sensitive to temperature. We can conclude that at this operating conditions the humidity of the feed hydrogen was too high to observe a dehydration of the membrane as in the case of low temperatures, thus the membrane was supposed to be well hydrated all over the EHC.
Figure 4: Distribution of the current density in an EHC for different values of the EHC temperature (RH
inlet hydrogen 90%, cathode pressure 4 bar, supplied current 0.66 A/cm2, membrane thickness 175 μm)
Effect of the membrane thickness
Figure 5 shows the current density distribution along the EHC for two different membranes: (i) Nafion XL - thickness 25 μm and Nafion 117, thickness 175 μm.
Figure 5: Distribution of the current density in an EHC for different membrane thickness (RH inlet hydrogen 90%, temperature 60 °C, cathode pressure 4 bar, supplied current 0.66 A/cm2)
The membrane thickness plays an important role on the performances of an EHC. The distribution of the local current densities using a thin membrane was opposite to that showed when using a thicker one (Figure 5). Whereas dehydration was observed in the first centimeters of the EHC with a thick membrane, a slight hydration was observed at the gas channel inlet when a thinner membrane was used. Moreover, in the latter case the distribution of the local current density was quite stable all over the system. It is clearly deduced that water was uniformly transported across the membrane all over the system when a thin membrane was used. In other words, the electro-osmotic drag and the water back diffusion were globally balanced in this latter condition. In fact, water back diffusion strictly depends on the membrane thickness as shown in Eq. 4. The thicker is the membrane the lower is the water back diffusion flow. As a consequence, when hydrogen with high humidity content was fed to the EHC with a thick membrane, water flowed across the membrane by electro-osmosis initially, giving as a result an unbalanced transport of water across the membrane.
6
Conclusion
The distribution of the local current densities along an electrochemical hydrogen compressor (EHC), as well as the water transport phenomena across the membrane, were investigated by using a single 30 cm2 cell
segmented in 20 parts. The effect of the degree of humidification of the feeding hydrogen, the cell temperature and the membrane thickness on the performances of an EHC was studied. An unbalanced water transport across the membrane was obtained when thick membranes were used. High humidity contents caused the local dehydration of the membrane in the first centimeters of the cell, whereas a progressive humidification of the membrane was observed for low humidity contents. Good performances were obtained at relatively high temperatures (80°C). A pseudo-2D model, taking into account the mass and energy balances along the cell, was developed, and its results were in good agreement with the experimental data. The possibility of using an EHC for reaching higher discharge pressures has been foreseen, with specific energy consumption of around 2 kWh/kg H2.
Acknowledgements
This study was partly supported by the French PIA project “Lorraine Université d’Excellence”, reference ANR-15-IDEX-04-LUE.
REFERENCES
1. HyET | Hydrogen Efficiency Technologies, http://hyet.nl/hydrogen/
2. Rohland B., Eberle K., Strobel R., Scholta J., Garche J. Electrochemical Hydrogen Compressor.
Electrochimica Acta, 43 (24), 3841-3846 (1998)
3. Grigoriev S.A., Shtatniy I.G., Millet P., Porembsky V.I., Fateev V.N. Description and characterization of an electrochemical hydrogen compressor/concentrator based on solid polymer electrolyte technology.
International Journal of Hydrogen Energy, 36, 4148-4155 (2011)
4. Onda K., Ichihara K., Nagahama M., Minamoto Y., Araki T.. Separation and compression characteristics of hydrogen by use of proton exchange membrane. Journal of Power Sources, 164 (1), 1-8 (2007)
5. Sdanghi G., Maranzana G., Celzard A., Fierro V. Review of current technologies and performances of hydrogen compression for automotive and stationary applications. Renewable and Sustainable Energy
Reviews, 102, 150-170 (2019)
6. Goshtasbi A., Pence B.L., Ersal T. Computationally efficient pseudo-2D non-isothermal modeling of polymer electrolyte membrane fuel cells with two-phase phenomena. Journal of the Electrochemical
Society, 163 (13) F1412-F1432 (2016)
7. Schalenbach M., Hoefner T., Paciok P., Carmo M., Lueke W., Stolten D. Gas permeation through Nafion. Part 1: Measurements. The Journal of Physical Chemistry. 119, 25156-25169 (2015)
8. Schalenbach M., Hoefner T., Paciok P., Carmo M., Lueke W., Stolten D. Gas permeation through Nafion. Part 2: Resistor Network Model. The Journal of Physical Chemistry. 119, 25145-25155 (2015)
9. Martinez M.J., Shimpalee S., Van Zee J.W. Comparing predictions of PEM fuel cell behavior using Mawxell-Stefan and CFD approximation equations. Computers and Chemical Engineering. 32 2958-2965 (2008)
10. J.T. Hunatsu, M. Mizuhata, and H. Takenaka. Water uptake of perfluorosulfonic acid membranes from liquid water and water vapor. Electrochemical Society. 141 (6): 1493-1498 (1994)
11. Abdin Z, Webb CJ, Gray EM. PEM fuel cell model and simulation in Matlab–Simulink based on physical parameters. Energy. 116,1131–44 (2016).
12. Ströbel R, Oszcipok M, Fasil M, Rohland B, Jörissen L, Garche J. The compression of hydrogen in an electrochemical cell based on a PE fuel cell design. Journal of Power Sources 105 (2), 208–15 (2002)