HAL Id: hal-01508071
https://hal.archives-ouvertes.fr/hal-01508071
Submitted on 13 Apr 2017HAL is a multi-disciplinary open access archive for the deposit and dissemination of sci-entific research documents, whether they are pub-lished or not. The documents may come from teaching and research institutions in France or abroad, or from public or private research centers.
L’archive ouverte pluridisciplinaire HAL, est destinée au dépôt et à la diffusion de documents scientifiques de niveau recherche, publiés ou non, émanant des établissements d’enseignement et de recherche français ou étrangers, des laboratoires publics ou privés.
ChemFET-Based Microdevices: Application to
Hydrogen Peroxide Detection
Abdou Karim Diallo, Lyas Djeghlaf, Jérôme Launay, Pierre Temple-Boyer
To cite this version:
Abdou Karim Diallo, Lyas Djeghlaf, Jérôme Launay, Pierre Temple-Boyer. Modelling of Impulsional pH Variations Using ChemFET-Based Microdevices: Application to Hydrogen Peroxide Detection. Sensors, MDPI, 2014, 14 (2), pp.3267-3283. �10.3390/s140203267�. �hal-01508071�
Article
Modelling of impulsional pH variations using ChemFET-based
microdevices: application to hydrogen peroxide detection
A.K. Diallo1,2, L. Djeghlaf1,2, J. Launay1,2, P. Temple-Boyer1,2*
1
CNRS, LAAS, 7 avenue du colonel Roche, F-31400 Toulouse, France
2
University of Toulouse; UPS; LAAS; F-31400 Toulouse, France
* Author to whom correspondence should be addressed; E-Mail: [email protected], Tel: +33 561 336 954, Fax: +33 561 336 208
Received: / Accepted: / Published:
Abstract: This work presents the modelling of impulsional pH variations in microvolume
related to water-based electrolysis and hydrogen peroxide electrochemical oxidation using an ElecFET (Electrochemical Field Effect Transistor) microdevice. This ElecFET device consists of a pH-ChemFET (pH-Chemical FET) with an integrated microelectrode around the dielectric gate area in order to trigger electrochemical reactions. Combining oxidation/reduction reactions on the microelectrode, water self-ionization and diffusion properties of associated chemical species, the model shows that the sensor response depends on the main influential parameters as: (i) polarization parameters on the microelectrode, i.e. voltage (Vp) and time (tp), (ii) distance between the gate sensitive area
and the microelectrode (d), and (iii) hydrogen peroxide concentration ([H2O2]). The model
developed can predict the ElecFET response behaviour and creates new opportunities for H2O2–based enzymatic detection of biomolecules.
Keywords: Modelling, ChemFET, microelectrode, H2O electrolysis, H2O2 detection
1. Introduction
Hydrogen peroxide (H2O2) is an important chemical species and its determination is of great interest
for food processing, industrial, clinical and biochemical applications. In the past years, many methods for H2O2 detection were published in literature. These different techniques involve spectrophotometry
[1], chemiluminescence [2], titration [3] and fluorescence [4]. Nevertheless, they encounter considerable drawbacks, can be expensive and lack a suitable simplicity when used in specific
applications. Electrochemistry is also a very interesting method for the detection of H2O2, leading to
the development of associated sensors in liquid [5-8] and gaseous phases [9-11]. Indeed, amperometric or potentiometric electrochemical detection principles are advantageous over other methods due to their high sensitivity, fast response, low cost, simple instrumentation, compatibility with microtechnologies and related potentialities for miniaturization. The amperometric technique monitors redox phenomena in a conductive liquid/solid interface and has led to the development of electrochemical electrodes and cells [12,13] while the potentiometric one involves the detection of charges trapped at an insulating liquid/solid interface and has been responsible for the development of ion sensitive electrodes (ISE) and chemical field effect transistors (ChemFET) [13,14]. Both detection/transduction principles induced successful alternatives for the liquid phase analysis due to/in spite of different advantages/drawbacks in terms of (bio)chemical species detection, technological integration and data treatment. As a result, each of them was largely confined to specific applications according to their characteristics. Finally, the combination of amperometric and potentiometric techniques has also been very promising in terms of detection in liquid phase [15-19]. Such combination is associated with the functional integration of an electrochemical microelectrode and a pH-ChemFET on a single chip, leading to the realization of a pH-ChemFET based coulometric sensor-actuator system [15] also known as electrochemical field effect transistor (ElecFET) [19].
In parallel with the technological development of pH-ChemFET based microdevices, modelling investigations were also conducted. Based on the site-binding theory [20,21], such studies led to the development of complete behavioural models using SPICE [22], MATHEMATICA [23] or VHDL-AMS [24] softwares. From a general point of view, these different models focus on the study of electrolyte/insulator/semiconductor capacitive structures while taking into account the FET electrical behaviour due to well-known current–voltages equations [24,25]. Beyond the pH measurement, it is necessary to consider other phenomena occurring in liquid phase such as diffusion, migration, acid/basic chemical reactions, enzymatic biochemical reactions,... This was performed for EnFET microsensors [26,27] as well as for pH-ChemFET-based coulometric sensor-actuator system [28,29]. Nevertheless, such modelling efforts have to be carried out in order to completely understand the ElecFET detection/transduction principles.
In this paper, using the MATLAB™ software, we report modelling of ElecFET microdevices in the frame of water electrolysis and hydrogen peroxide oxidation, studying main influential parameters (polarization voltage and time as well as integration level) while dealing with impulsional pH variations in microvolume and H2O2 detection.
2. Experimental Section
The ElecFET microdevice was developed through functional integration of a metallic microelectrode with a pH-sensitive chemical field effect transistor (pH-ChemFET) on a silicon chip [19]. Thus, by combining at the microscale amperometric production of water-based ions in solution and pH potentiometric detection, unusual electrochemical detection properties were evidenced [15-19] and should be modelled accordingly.
Since the pH-ChemFET theoretical behaviour is well known [14,24,25], its modelling was considered globally by taking into account the threshold voltage variations with pH (see §2.3).
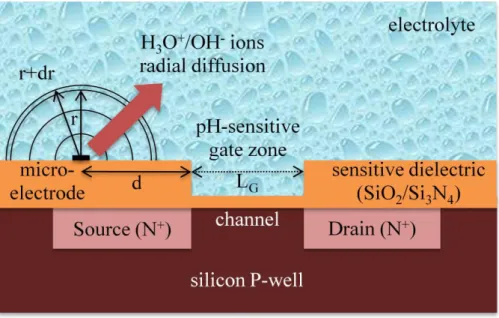
Nevertheless, in order to completely understand the ElecFET detection/transduction principles, its technological processes and the associated planar structure should be described (figure 1) [19,30]. At first, N-channel, field effect transistors (FET) were fabricated on silicon wafers using a standard P-well technology. Thus, heavily-doped, N+-type source (S) and drain (D) regions (thickness: ~ 2 μm) were fabricated on a P-type silicon substrate to form the FET channel (length LG: ~ 5 μm). Then, the
pH-ChemFET gate was created. Typically, a 50nm-thin silicon oxide SiO2 layer was thermally grown on
the silicon substrate in order to obtain optimal gate dielectric properties and a 50nm-thin Si3N4 layer
was then deposited to provide pH detection properties. Finally, the metallic microelectrode was integrated on the device, next to the SiO2/Si3N4 pH-ChemFET sensitive gate (standard distances: 30–
300 μm). Platinum was chosen since it is as an excellent catalyst for hydrogen peroxide oxidation [5,6,31]. Practically, platinum metallization (thickness: ~ 200nm) was used with a tantalum underlayer (thickness: ~ 50nm) to assure adhesion on Si3N4 surface. Overall, platinum microelectrode (area: ~ 0.3
mm2) and pH-ChemFET (sensitive gate area: ~ 4 x 10⁻³ mm2) were placed sufficiently close to one another in order to easily perform liquid phase analysis while keeping an adequate distance to avoid electrical interferences.
Concerning the operating principle, a typical electrical configuration was used [19]. On one hand, the pH-ChemFET electrical bias was achieved through a constant drain-source voltage VDS and
drain-source current IDS. Gate-source voltage VGS was measured due to a reference electrode biasing the
electrolyte to the mass (VG = VRE = Velectrolyte = 0). On the other hand, a suitable electrical polarization
(voltage VP, time tP) was applied on the integrated platinum microelectrode and a standard platinum
counter-electrode in the solution was used to complete the set-up (VCE ≈ Velectrolyte = 0).
Figure 1. Cross-section of the ElecFET device describing the one-dimensional model in
radial coordinate (scales are not respected for easiness of presentation)
The ElecFET modelling takes into account the different chemical and physical phenomena occurring in the environment around the ElecFET microdevice: electrochemical production/consumption of water-based acid/basic species (hydronium H3O+ and hydroxide OH- ions)
phenomena in water medium. We assumed that (i) the transport by electromigration of H3O+ and OH
-ions is negligible and (ii) any similar phenomenon is induced by other -ions in the electrolyte. Similarly, transport by convection was neglected. As a result, modelling procedure is described as following:
- Study of the electrochemical production of water-based ions (H3O+ and OH-) on the integrated
microelectrode,
- Study of the influence of water self-ionization,
- Study of diffusion phenomena in liquid phase, determination of water-based ion concentration profiles and pH distribution around the pH-ChemFET sensitive gate,
- Final determination of the pH-ChemFET potentiometric response (by considering only the typical "Nernst law" equation).
2.1. Modelling of the electrochemical production of water-based ions
The ElecFET detection principles were first applied to water electrolysis phenomena triggered by an electrical polarization (voltage VP, time tP) on the integrated microelectrode:
- H2O oxidation (VP > E0+): 6H2O ----> O2 + 4H3O+ + 4e-
- H2O reduction (VP < E0-): 4H2O + 4e- ----> 2H2 + 4OH
-where E0+ and E0- are equilibrium potentials of oxidation and reduction reactions for water electrolysis
respectively (E0+ ≈ 1.2 V and E0- ≈ -0.8 V [32]).
The choice of a constant voltage to bias the integrated microelectrode was not compulsory in the frame of the ElecFET modelling: a constant current bias could have also been used. It was done in order to fit with ElecFET experimental characterisations previously performed [19]. Thus, according to laws of electrochemistry applied to a standard redox reaction (ox + ne- <---> red), the current I on the electrode is related to the electrode potential V through the following equation [32]:
I=nFS kox[red]exp anF RT V æ è ç ö ø ÷ -kred[ox]exp -bnF RT V æ è ç ö ø ÷ é ë ê ù û ú (1)
where F is the Faraday constant (F = 96485 C/mol), S is the electrode surface, kox and kred are the
standard rate constants of oxidation and reduction respectively, and are the anodic and cathodic transfert coefficients respectively ( + = 1), R is the ideal gas constant (R = 8.32 J/K.mol) and T is the absolute temperature (K).
If the electrode potential V is higher than the oxidation potential E+, the reduction current can be
neglected and equation (1) becomes:
I=nFSkox[red]exp anF RT V æ è ç ö ø ÷ =nFSk+[red]exp anF RT (V-E+) æ è ç ö ø ÷ (2)
with: k+ =koxexp anF RT E+ æ è ç ö ø ÷
Thus, in the case of monovalent ions, considering an elementary volume (surface S, thickness dr), the current I is given by:
I=eNSdrd[ox]
dt (3)
where N is the Avogadro number (N= 6.02 x 10²³).
From equation (2) and (3), temporal variations of the oxidant species concentration is finally given by: d[ox] dt =n k+ dr[red]exp bnF RT (V-E+) æ è ç öø÷ (4)
In the same way, if the electrode potential V is lower than the reduction potential E-, the temporal
variations of the reducer species concentration is given by:
d[red] dt =n k -dr[red]exp bnF RT (E--V) æ è ç öø÷ (5)
with: k-=kredexp -bnF RT E -æ è ç ö ø ÷
By applying equations (4) and (5) to water oxidation and reduction respectively while considering that = = 0.5 [32], the temporal variations of H3O+ and OH- ion concentrations at the microelectrode
surface (r = 0, cf. figure 1) are finally given by:
- VP > E0+: ¶[H3O+] ¶t æ è ç ç ö ø ÷ ÷ r=0 =G+ =4k0+ dr exp 2F RT(VP -E0+) æ è ç ö ø ÷ (6) - VP < E0-: ¶[OH-] ¶t æ è ç ç ö ø ÷ ÷ r=0 =G- =4k0 -dr exp 2F RT(E0- -VP) æ è ç ö ø ÷ (7)
where k0+ and k0- are standard rate constants of oxidation and reduction respectively (estimated
respectively at 3 x 10⁻⁹ m/s and 10-7 m/s using the Tafel experimental method [32], results not shown), F is the Faraday constant (F = 96485 C/mol), R is the ideal gas constant (R = 8.32 J/K.mol) and T is the absolute temperature (K).
In presence of hydrogen peroxide in solution (concentration [H2O2]), the associated oxidation
reaction should also be taken into account on the integrated microelectrode:
where E1+ is the equilibrium potential for the H2O2 oxidation (E1+ ≈ 0.3 V for pH = 7 [32]).
As previously stated, according to equation (4), temporal variations of [H3O+] concentration at the
microelectrode surface (r = 0, cf. figure 1) are given by:
- VP > E1+: ¶[H3O+] ¶t æ è ç ç ö ø ÷ ÷ r=0 =G1+ =2[H2O2]k1+ dr exp F RT(VP -E1+) æ è ç ö ø ÷ (8)
where k1+ is the standard rate constant for the H2O2 oxidation (estimated experimentally at 5 x 10⁻⁸ m/s
from the current I0 obtained for VP = E1+ in agreement with the Tafel method [32], figure 2), F is the
Faraday constant (F = 96485 C/mol), R is the ideal gas constant (R = 8.32 J/K.mol) and T is the absolute temperature (K).
In our model, these equations were finally used to determine the electrochemical production of hydronium or hydroxide ions on the integrated microelectrode and its impact on the associated concentrations [H3O+] and [OH-].
Figure 2. Definition of the standard rate constant k1+ for the H2O2 oxidation using the
Tafel method (S = 0.3 mm2, [H2O2] = 200 mM)
2.2. Influence of water self-ionization
In parallel, since the electrical polarization on the integrated microelectrode is responsible for the mass production of H3O+ or OH- ion, water is locally set out of equilibrium from a chemical point of
view. According to water self-ionization (2H2O <----> H3O+ + OH-), the kinetics of the [H3O+] and
d[H3O+]
dt =
d[OH-]
dt (9)
Introducing a constant parameter c that depends of the initial difference between the [H3O+] and
[OH-] concentrations, the mathematical integration of equation (9) gives:
(10)
Thus, considering that the return to equilibrium is associated with a steady-state regime [29], the final concentrations of hydronium and hydroxide ions [H3O+]f and [OH-]f are characterized by the
following system (where Kw is the ionic product of water H2O):
(11)
Solving this equation system yields:
[H3O+]f2-c[H3O+]f -Kw =0 (12)
Considering the positive root of equation (12), the [H3O+]f and [OH-]f values are finally given by:
[H3O+]f =c+ c 2+4K w 2 (13) [OH-]f = c 2+4K w -c 2 (14)
Finally, the global variations of the [H3O+] and [OH-] concentrations related to the water
self-ionization reaction are expressed by:
(15)
Thus, in the developed model, any variations of [H3O+] and [OH-] concentrations were
counterbalanced according to equation (10) in order to take into account water self-ionization phenomena in solution.
It should be mentioned that the water self-ionization modelling was considered only in the case of pure water and therefore without considering any buffer properties. Such assumption is required to understand ElecFET detection/transduction principles. In practice, each solution of interest will have to be separately studied. Nevertheless, as demonstrated for urea-EnFET in the frame of haemodialysis
[26,27,33], buffer effects will influence the ElecFET detection properties but will not drastically limit its operating principle.
2.3. Modelling of diffusion phenomena in watery phase
The diffusion model was adapted from a previous one developed for the EnFET-based microsensors and based on a finite element model implemented in MATLAB™ software [26,27]. It is associated with Fick's diffusion equation, assuming a one-dimensional model in spherical coordinates (figure 1). The variable parameter is therefore the radius of the sphere r:
¶C(r,t) ¶t =D 1 r2 ¶ ¶r r2 ¶C(r,t) ¶r æ è ç ö ø ÷ +G (16)
where C(r,t) describes the concentration of H3O+ or OH- ion for the studied case, D is the associated
diffusion coefficient and G represents the chemical species generation according to the associated electrochemical reaction.
As a result, for the different studied cases, equation 11 gives:
- H2O oxidation (VP > E0+): ¶[H3O+](r,t) ¶t =DH3O+ 1 r2 ¶ ¶r r2 ¶[H3O+](r,t) ¶r æ è ç ç ö ø ÷ ÷ +G+ (17) - H2O reduction (VP < E0-): ¶[OH-](r,t) ¶t =DOH -1 r2 ¶ ¶r r2 ¶[OH-](r,t) ¶r æ è ç ç ö ø ÷ ÷ +G- (18) - H2O2 oxidation (VP > E1+): ¶[H3O+](r,t) ¶t =DH3O+ 1 r2 ¶ ¶r r2 ¶[H3O+](r,t) ¶r æ è ç ç ö ø ÷ ÷ +G1+ (19)
In order to solve diffusion equations, the following initial and boundaries conditions were chosen:
(20)
Thus, initial conditions assume spatially uniform concentrations of water-based ions and boundary conditions assume that no flux goes through the physical barrier of the sensor surface (r = 0) or far from it (r = rmax = 3 cm). By solving the mass transport equations system (equations 17, 18 and/or 19)
using MATLAB™ software, the different ion concentration distributions [H3O+](r,t) and [OH-](r,t)
were defined and the pH(r,t) function was deduced consequently.
Finally, concerning the pH-ChemFET electrical behaviour, modelling of the drain-source current IDS as a function of gate-source and drain-source voltages VGS and VDS, pH and any other interfering
parameters was not performed. Indeed, since the pH-ChemFET device is well known at a theoretical level and was thoroughly studied in previous works [14,24,25], it was decided to take only into account its global detection properties associated with the Nernst's law. Thus, since the channel length LG (typical values around 5 m [30]) is shorter than the distance d between the integrated
microelectrode and the pH-ChemFET gate sensitive area (figure 1), the pH-ChemFET threshold voltage VT variation was estimated in a very simple way according to the following equation:
dVT(t)=s0
(
pH(d,t)-pH0)
(21)where s0 is the pH-ChemFET sensitivity and d is the distance between the integrated microelectrode
and the pH-ChemFET gate sensitive area (figure 1).
3. Results and Discussion
Hereinafter, the ElecFET model is studied using the following parameters: - T = 300 K and s0 = 60 mV/pH
- KW = 10-14 (mol/l)² and pH0 = 7
- DH3O+ = 9.3 x 10⁻⁵ cm²/s and DOH- = 5.3 x 10⁻⁵ cm²/s
- S = 0.3 mm2 and d = 30 μm (if not indicated)
3.1. Modelling of water electrolysis phenomena
The first study concerned modelling of a positive bias on the integrated microelectrode (polarization voltage VP = 1.23 V and polarization time tP = 5 s). In this case, water oxidation occurs on the
integrated microelectrode, triggering the local production of H3O+ ions since VP is higher than the
water oxidation equilibrium potential E0+. Figures 3a to 3d show the temporal and spatial variations of
hydronium (H3O+) and hydroxide (OH-) ion concentrations. As expected, the [H3O+] concentration
(respectively, the [OH-] concentration) increases (respectively, decreases) very quickly by more than four decades (from 10-7 mol/l to 7 x 10⁻⁴ mol/l) and gradually takes its initial value (10-7 mol/l) as soon as the electrical bias on the integrated microelectrode is turned off (figures 3a and 3c). Furthermore, it is obvious that these variations occur at millimetric distance (figures 3b and 3d). This demonstrates that localized impulsional pH variations can be effectively obtained near the integrated microelectrode surface and can be detected at the adjacent pH-sensitive surface.
In the case of negative bias (polarization voltage VP = -0.85 V and polarization time tP = 5 s), water
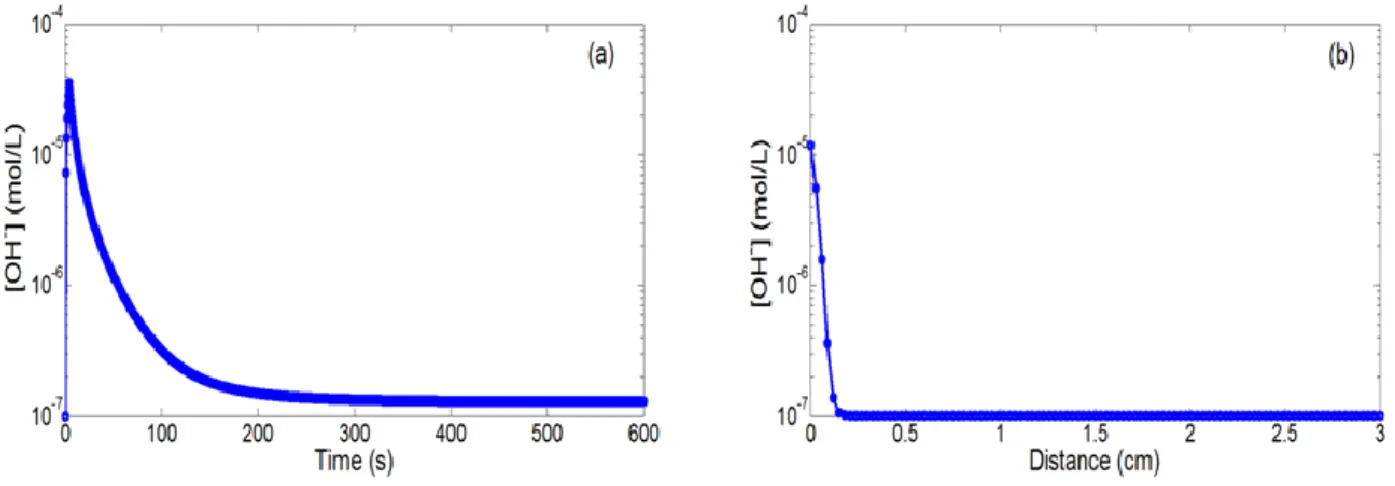
reduction is taking place on the integrated microelectrode, triggering the local production of OH- ions since the VP is lower than the water reduction equilibrium potential E0-. Figures 4a and 4b illustrate
respectively the temporal and spatial evolutions of the OH- ion concentration. An [OH-] increase (from 10-7 mol/l to 4 x 10⁻⁵ mol/l) is noticed, followed by a return to equilibrium (10-7 mol/l) when the electrical bias is turned off. Of course, the H3O+ ion concentration follows opposite variations in
therefore evidenced at the millimetric scale, confirming finally that varied localized phenomena can be effectively obtained according to the polarization sign.
Subsequently, we have studied the influences of the main parameters by focusing on the pH-ChemFET threshold voltage variations VT. Figure 5 shows the associated temporal variations for
different polarization voltages applied on the integrated microelectrode (VP = 1.21, 1.23, 1.25, 1.27
and 1.29 V) and a given polarization time tP = 5 s.
Figure 3. (a,c) Temporal (r = d = 30 µm) and (b,d) spatial variations (t = 12 s) of the
[H3O+] and [OH-] concentrations for a positive bias on the integrated microelectrode (VP =
1.23 V and tP = 5 s)
Figure 4. (a) Temporal (r = d = 30 µm) and (b) spatial variations (t = 12 s) of the [OH-] concentration for a negative bias on the integrated microelectrode (VP = -0.85 V and tP = 5 s)
As expected, the polarization voltage increase is responsible for a local pH decrease and consequently a pH-ChemFET threshold voltage decrease. This behaviour corroborates the Butler-Volmer theory adapted to water oxidation (equation 1). Finally, since H3O+ ion production kinetics is
an exponential function of VP, an increase in polarization voltage induces a quasi-linear decrease of the
minimum voltage.
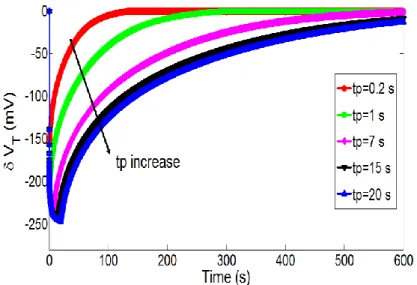
Then, the influence of polarization time tP was studied. Figure 6 illustrates the temporal variations
of pH and associated pH-ChemFET threshold voltage for different polarization times (tP = 0.2, 1, 7, 15
and 20 s) while keeping constant the polarization voltage on the integrated microelectrode (VP = 1.23
V). In agreement with the electrochemical theory (equation 1), the polarization time increase is responsible for a local pH decrease and therefore a pH-ChemFET threshold voltage decrease. Nevertheless, pH variations are lower and tend to reach saturation.
Figure 5. Temporal variations of the pH-ChemFET threshold voltage for different
polarization voltages on the integrated microelectrode (VP = 1.21, 1.23, 1.25, 1.27 and 1.29
V) and a given polarization time (tP = 5 s)
Figure 6. Temporal variations of the pH-ChemFET threshold voltage for a given
polarization voltage on the integrated microelectrode (VP = 1.23 V) and different
Figure 7. Temporal variations of the pH-ChemFET threshold voltage for different
distances between the integrated microelectrode and the pH-sensitive gate (d = 30, 90, 150 and 210 µm) and a given polarization step (VP = 1.23 V and tP = 5 s)
Since diffusion phenomena control the ElecFET detection principles, spatial configuration should influence detection properties. To demonstrate such assumption, figure 7 shows temporal variations of pH-ChemFET threshold voltage for different distances between the integrated microelectrode and the pH-ChemFET gate sensitive area (d = 30, 90, 150 and 210 μm) and for a given microelectrode polarization (VP = 1.23 V, tP = 5 s). It appears that the distance diminution is responsible for a local pH
and therefore a pH-ChemFET threshold voltage decrease. This demonstrates that the ElecFET detection principles are effectively dependent on the spatial integration of both microelectrode and pH-ChemFET microdevices. For the highest integration levels (d << 50 m), very important localized impulsional pH variations are obtained for a given microelectrode polarization step (VP, tP). On the
contrary, for the lowest integration levels (d >> 200 m), phenomena are strongly attenuated, leading to low temporal pH wave and, consequently low ElecFET response. Since such pH variations were found to occur at millimetric distance (cf. figures 3b and 3d), ElecFET detection potentialities is no longer possible when d parameter is higher than 1000 microns, i.e. when the functional integration between the microelectrode and the pH-ChemFET device is ineffective.
3.2. Modelling of hydrogen peroxide oxidation phenomena
Since hydrogen peroxide detection is of great interest and H2O2 was successfully studied using an
ElecFET-based microdevice [17,19], our model was studied by taking into account the H2O2 oxidation
on the integrated microelectrode. In this case, according to the hydrogen peroxide oxidation reaction, a positive bias on the integrated microelectrode is responsible for the electrochemical production of H3O+ ions and therefore a local pH decrease in solution (cf. §2.1). Since H2O and H2O2 molecules
have similar electrochemical behaviours, impulsional pH variations localized at the microscale (typical dimension less than 1 millimetre) were also obtained in H2O2–rich solutions as soon as an appropriate
polarization step (VP, tP) was applied (result not shown). In this case, phenomena occur at lower
voltage according to the associated equilibrium potential E1+ value (E1+ ≈ 0.3 V for pH = 7 [32]). This
is clearly evidenced on figures 8a and 8b illustrating temporal variations of pH-ChemFET threshold voltage for different polarization voltages (VP = 0.32, 0.35, 0.38, 0.42 and 0.45 V) and different
polarization times (tP = 1, 3, 5, 10 and 20 s), considering an H2O2 concentration of 45 mM. In this case,
local impulsional pH variations are not so obvious. Indeed, during the polarization duration (tP = 30s),
hydrogen peroxide oxidation is limited by the H2O2 diffusion phenomena towards the microelectrode
surface. As a result, pH variations are no longer impulsional and higher polarization durations are required to reach a steady-state regime depending on the polarization voltage VP (as well as on the
[H2O2] concentration, see hereafter). Then, as previously stated, since the H2O2 oxidation reaction is
controlled by the Butler-Volmer theory (equation 3), the polarization voltage VP increase is
responsible for a quasi-linear threshold voltage decrease while the polarization time tP increase is
associated to saturation phenomena.
Figure 8. Temporal variations of the pH-ChemFET threshold voltage for different
polarization steps, (a) VP = 0.32, 0.35, 0.38, 0.42 and 0.45 V, (b) tP = 1, 3, 5, 10 and 20 s,
and for a given H2O2 concentration ([H2O2] = 45 mM)
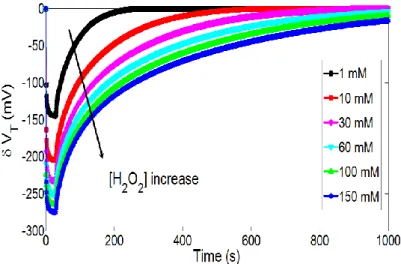
Finally, in the case of hydrogen peroxide detection, the Butler-Volmer theory emphasizes on the influence of the [H2O2] concentration on H3O+ ion production kinetics (equation 3). In order to study
this influence, figures 9 show temporal variations of the pH-ChemFET threshold voltage for different H2O2 concentrations ([H2O2] = 1, 10, 30, 60, 100 and 150 mM) and a given polarization step (VP =
0.35 V and tP = 30 s). As expected, it is obvious that the hydrogen peroxide concentration increase is
responsible for a local pH decrease and therefore a pH-ChemFET threshold voltage decrease.
In order to quantify the pH variation, its minimal value and more precisely the associated minimal threshold voltage value have been studied according to [H2O2] concentration for two integration levels,
i.e. for two distances (d = 30 and 210 μm) between the integrated microelectrode and the pH-ChemFET gate sensitive area (figures 10a and 10b respectively). Simulation results exhibit linear variations for several concentration decades (sensitivity ≈ 60 mV/decade). Such Nernstian sensitivity is related to linear variations of the [H3O+] concentration with the [H2O2] concentration at the
microelectrode surface (cf. equation 3). This result demonstrates that the pH-ElecFET microdevice can be effectively used for the potentiometric detection of hydrogen peroxide. Furthermore, by increasing the polarization voltage VP and/or the integration level, H2O2 detection range and detection limit can
be improved.
Figure 9. Temporal variations of the pH-ChemFET threshold voltage for different H2O2
concentrations ([H2O2] = 1, 10, 30, 60, 100 and 150 mM) and a given polarization step (VP
= 0.35 V and tP = 30 s)
Figure 10. H2O2 analytical responses of the ElecFET microdevice (VP = 0.32, 0.35, 0.38,
0.42, 0.45 V and tP = 30 s) for two different distances between the integrated
4. Conclusions
Using MATLAB™ software, we have investigated the modelling of the ElecFET microdevice in the case of water electrolysis and hydrogen peroxide oxidation, taking into account chemical and electrochemical and acid/basic reactions in water phase as well as diffusion phenomena of water-based ions. In the first case, results show that the ElecFET phenomena depend strongly on the polarization parameters on the microelectrode (voltage VP and time tP) as well as on dimensional characteristics
related to the ElecFET functional integration (distance between the microelectrode and the pH-ChemFET gate sensitive gate area d). On one hand, according to the polarization sign, oxidation and reduction reactions of water are responsible for impulsional pH variations localized at the microscale (typical dimension: 1 millimetre and less). On the other hand, amplified phenomena are obtained when the polarization conditions and/or the integration level are increased.
In the second case, the ElecFET microdevice was shown to be compatible with hydrogen peroxide detection while using an indirect measurement technique based on the pH-related H2O2 oxidation
products. Amplification phenomena were shown to have no influence on the detection sensitivity and Nernstian responses were finally evidenced for several concentration decades. Nevertheless, detection range variations and improved detection limits were still possible by increasing polarization conditions and/or integration level.
It should be mentioned that the ElecFET modelling was performed for solutions based on pure water and therefore without considering any buffer properties and/or any interfering pH variations. This choice was required to ElecFET detection/transduction principles, but it prevents us from comparing fully modelling and experimental results. As far as real samples are concerned, buffer properties will have to be considered to determine pH distributions in the ElecFET environment. Thus, the modelling will have to be adapted to each different buffer solution of interest. This can induce contradictory phenomena for the ElecFET behaviour. On one side, buffer properties can impede in some extents local pH changes, deteriorating detection properties in terms of sensitivity and/or detection range. On the other side, by impeding pH variations in solution, they can improve detection performances in terms of selectivity (especially to pH).
Nevertheless, the ElecFET microdevice is finally very promising in terms of applications, and modelling enables a complete comprehension of its detection principle based on a combination of
amperometry and potentiometry. It allows a combination of the pH-ChemFET-metry technique and redox phenomena. Further studies will be focused on the modelling of the detection of H2O2–related
biomolecules such as glucose as well as lactate, urate and/or glutamate ions by taking into account associated enzymatic reactions in buffered solution.
References
1. Shai X-S., Hou Q-X., Luo Q., Zhu J-Y., "Rapid determination of hydrogen peroxide in the wood pulp bleaching streams by a dual-wavelength spectroscopic method", Analytical Chimica Acta
2004, 507, 281-284.
2. Tahirovic A., Copra A., Omanovic-Miklicanin E., Kalcher K., "A chemiluminescence sensor for the determination of hydrogen peroxide", Talanta 2007, 72, 1378–1385.
3. Kiassen N.V., Marchington D., McGowan H.C.E., "H2O2 Determination by the I3- method and by
KMnO4 titration", Analytical Chimica Acta 1994, 66, 2921-2925.
4. Abbas M.E., Luo W., Zhu L., Zou J., Tang H., "Fluorometric determination of hydrogen peroxide in milk by using a Fenton reaction system", Food Chemistry 2010, 120, 327–331.
5. Evans S.A.G., Elliot J.M., Andrews L.M., Bartlett P.N., Doyle P.J., "Detection of hydrogen peroxide at mesoporous platinum microelectrodes", Analytical Chemistry 2002, 74, 1322-1326. 6. Karyakin A.A., Kuritsyna E.A., Karyakina E.E., Sukhanov V.L., "Diffusion controlled analytical
performances of hydrogen peroxide sensors: towards the sensor with the largest dynamic range",
Electrochimica Acta 2009, 54, 5048-5052.
7. Chen W., Cai S., Ren Q.Q., Wen W., Zhao Y.D., "Recent advances in electrochemical sensing for hydrogen peroxide: a review", Analyst 2012, 137, 49-58.
8. Kurowska E., Brzozka A., Jarosz M., Sulka G.D., Jaskula M., "Silver nanowire array for sensitive and rapid detection of H2O2", Electrochimica Acta 2013, 104, 439-447.
9. Kulis J., "Flow-through amperometric sensor for hydrogen peroxide monitoring in gaseous media", Sensors and Actuators 1992, 9, 143-147.
10. Benedet J., Lu D., Cizek K., La Belle J., Wang J., "Amperometric sensing of hydrogen peroxide vapor for security screening", Analytical and Bioanalytical Chemistry 2009, 395, 371-376.
11. Wiedemair J., Van Dorp H., Olthuis W., Van der Berg A., "Developing an amperometric of hydrogen peroxide sensor for an exhaled breath analysis system", Electrophoresis 2012, 33, 3181-3186.
12. Feeney R., Kounaves P., "Microfabricated microelectrodes arrays: Developments, advances and applications in environmental analysis", Electroanalysis 2000, 12, 677-684.
13. Laschi S., Mascini M., "Planar electrochemical sensors for biomedical applications", Medical
Engineering and Physics 2006, 28, 934-943.
14. Bergveld P., "Thirty years of ISFETOLOGY: what happened in the past 30 years and what may happen in the next 30 years", Sensors and Actuators B 2003, 88, 1-20.
15. Van der Schott B., Bergveld P., "An-ISFET-based microlitre titrator: integration of a chemical sensor-actuator system", Sensors and Actuators 1985, 8, 11-22.
16. Sohn B-K., Kim C-S., "A new pH-ISFET based dissolved oxygen sensor by employing electrolysis of oxygen", Sensors and Actuators B 1996, 34, 435-440.
17. Seo H-I., Kim C-S., Sohn B-K., Yeow T., Son M-T., Haskard M., "ISFET glucose sensor based on a new principle using the electrolysis of hydrogen peroxide", Sensors and Actuators B 1997, 40, 1-5.
18. Sohn B-K., Cho B-W., Kim C-S., Kwon D-H., "ISFET glucose and sucrose sensors by using platinum electrode and photo cross-linkable polymers", Sensors and Actuators B 1997, 41, 7-11. 19. Diallo A.K., Djeghlaf L., Mazenq L., Launay J., Sant W., Temple-Boyer P., "Development of
pH-based ElecFET biosensors for lactate ion detection", Biosensors and Bioelectronics 2013, 40, 291–296
20. Bousse L., De Rooij N.F., Bergveld P., "Operation of chemically-sensitive filed effect sensors as a function of the insulator-electrolyte interface", IEEE Transactions on Electron Devices 1983, 30, 1263-1270
21. Bousse L., De Rooij N.F., Bergveld P., "The influence of counter ion adsorption on the 0/pH
characteristics of insulator surface", Surface Science 1983, 135, 479-496
22. Martinoia S., Massobrio G., "A behavioural macromodel of the ISFET in SPICE", Sensors and
Actuators B 2000, 62, 182-189
23. Kühnhold R., Ryssel H., "Modeling the pH response of silicon nitride ISFET devices", Sensors
and Actuators B 2000, 68, 307-312
24. Janicki M., Daniel M., Szermer M., Napieralski A., "Ion sensitive field effect transistor modelling for multidomain simulation purposes", Microelectronics Journal 2004, 35, 831-840
25. Martinoia S., Massobrio G., Lorenzelli L., "Modeling ISFET microsensors and ISFET-based microsystems: a review", Sensors and Actuators B 2005, 105, 14-27
26. Temple-Boyer P., Le Gal J., Pourciel-Gouzy M.L., Sant W., Martinez A., "Modelling of EnFETs for the creatinine detection", Sensors and Actuators B 2006, 118, 47-52.
27. Temple-Boyer P., Benyahia A., Sant W., Pourciel-Gouzy M.L., Launay J., Martinez A., "Modelling of urea-EnFETs for haemodialysis applications", Sensors and Actuators B 2008, 131, 525-532.
28. Olthuis W., Luo J., Van der Schott B.H., Bergveld P., Bos M., Van der Linden W.E., "Modelling of non-steady-state concentration profiles at ISFET-based coulometric sensor-actuator systems",
Analytica Chimica Acta 1990, 229, 71-81.
29. Luo J., Olthuis W., Van der Schott B.H., Bergveld P. Bos M., Van der Linden W.E., "Modelling of the migration effect occuring at an ISFET-based coulometric sensor-actuator system",
Analytica Chimica Acta 1990, 237, 71-81.
30. Temple-Boyer P., Launay J., Humenyuk I., Do Conto T., Martinez A., Bériet C., Grisel A., "Study of front-side connected chemical field effect transistor for water analysis", Microelectronics
Reliability 2004, 44, 443-447
31. Talauliker P.M., Price D.A., Burmeister J.J., Nagari S., Quintero J.E., Pomerleau F., Huettl P., Hastings J.T., Gerhardt G.A., "Ceramic-based microelectrode arrays: recording surface characteristics and topographical analysis", Journal of Neurosciences Methods 2011, 198, 222-229.
32. Bard A.J., Faulkner L.R., "Electrochemical methods: fundamental and applications, second edition", New York: John Wileys & Sons Inc. (2001).
33. Sant W., Temple-Boyer P., Chanié E., Launay J., Martinez A., "On-line monitoring of urea using enzymatic field effect transistors", Sensors and Actuators B 2011, 160, 59-64.
![Figure 2. Definition of the standard rate constant k 1+ for the H 2 O 2 oxidation using the Tafel method (S = 0.3 mm 2 , [H 2 O 2 ] = 200 mM)](https://thumb-eu.123doks.com/thumbv2/123doknet/14423873.513812/7.893.236.650.626.950/figure-definition-standard-constant-oxidation-using-tafel-method.webp)
![Figure 8. Temporal variations of the pH-ChemFET threshold voltage for different polarization steps, (a) V P = 0.32, 0.35, 0.38, 0.42 and 0.45 V, (b) t P = 1, 3, 5, 10 and 20 s, and for a given H 2 O 2 concentration ([H 2 O 2 ] = 45 mM)](https://thumb-eu.123doks.com/thumbv2/123doknet/14423873.513812/14.893.80.852.782.1073/figure-temporal-variations-chemfet-threshold-different-polarization-concentration.webp)