HAL Id: hal-01771776
https://hal-amu.archives-ouvertes.fr/hal-01771776
Submitted on 8 May 2018HAL is a multi-disciplinary open access
archive for the deposit and dissemination of sci-entific research documents, whether they are pub-lished or not. The documents may come from teaching and research institutions in France or abroad, or from public or private research centers.
L’archive ouverte pluridisciplinaire HAL, est destinée au dépôt et à la diffusion de documents scientifiques de niveau recherche, publiés ou non, émanant des établissements d’enseignement et de recherche français ou étrangers, des laboratoires publics ou privés.
Direct nitrous oxide emissions in Mediterranean climate
cropping systems: Emission factors based on a
meta-analysis of available measurement data
Maria Cayuela, Eduardo Aguilera, Alberto Sanz-Cobena, Dean Adams, Diego
Abalos, Louise Barton, Rebecca Ryals, Whendee Silver, Marta Alfaro,
Valentini Pappa, et al.
To cite this version:
Maria Cayuela, Eduardo Aguilera, Alberto Sanz-Cobena, Dean Adams, Diego Abalos, et al.. Direct nitrous oxide emissions in Mediterranean climate cropping systems: Emission factors based on a meta-analysis of available measurement data. Agriculture, Ecosystems and Environment, Elsevier Masson, 2017, 238, pp.25 - 35. �10.1016/j.agee.2016.10.006�. �hal-01771776�
Direct nitrous oxide emissions in Mediterranean climate cropping systems: Emission
factors based on a meta-analysis of available measurement data
Maria L. Cayuelaa,*, Eduardo Aguilerab, Alberto Sanz-Cobenac, Dean C. Adamsd,e, Diego Abalosf, Louise Bartong, Rebecca Ryalsh, Whendee L. Silveri, Marta A. Alfaroj, Valentini A. Pappak,l, Pete Smithm, Josette Garniern, Gilles Billenn, Lex Bouwmano,p, Alberte Bondeauq, Luis Lassalettao
a
Departamento de Conservación de Suelos y Aguas y Manejo de Residuos Orgánicos, CEBAS-CSIC, Campus Universitario de Espinardo, 30100 Murcia, Spain
b
Universidad Pablo de Olavide, Ctra. de Utrera, km. 1, 41013, Sevilla, Spain c
ETSI Agronomos, Technical University of Madrid, Ciudad Universitaria, 28040 Madrid, Spain d
Department of Ecology, Evolution, and Organismal Biology, Iowa State University, Ames, IA 50010, USA e
Department of Statistics, Iowa State University, Ames, IA 50010, USA f
Department of Soil Quality, Wageningen University, PO Box 47, Droevendaalsesteeg 4, Wageningen 6700AA, The Netherlands
g
Soil Biology and Molecular Ecology Group, School of Earth and Environment, UWA Institute of Agriculture, Faculty of Science, The University of Western Australia, 35 Stirling Highway, Crawley WA 6009, Australia h
Department of Natural Resources and Environmental Management, University of Hawaii, Manoa, Honolulu HI, 96822, USA
i
Department of Environmental Science, Policy, and Management, University of California, Berkeley, CA 94707, USA
j
Instituto de Investigaciones Agropecuarias, Centro Regional de Investigación Remehue, Casilla 24-O, Osorno, Chile
k
Agricultural University of Athens, Department of Crop Science, Iera Odos 75, 11855 Athens, Greece l
Texas A&M University, 302H Williams Administration Bldg, College Station, TX 77843-3372, USA m
Institute of Biological and Environmental Sciences, University of Aberdeen, 23 St Machar Drive, Aberdeen, AB24 3UU, UK
n
Sorbonne Universités, Univ Paris 06, CNRS, EPHE, UMR 7619 METIS, 4 place Jussieu, 75005 PARIS, France o
PBL Netherlands Environmental Assessment Agency, PO Box 303314, 2500 GH The Hague, The Netherlands p
Department of Earth Sciences – Faculty of Geosciences, Utrecht University, PO Box 80021, 3508 TA Utrecht, The Netherlands
q
Institut Méditerranéen de Biodiversité et d’Ecologie marine et continentale (IMBE) Aix Marseille Université, CNRS, IRD, Avignon Université, Aix-en-Provence, France
Corresponding author. E-mail addresses: mlcayuela@cebas.csic.es, marialuz.cayuela@gmail.com, marialuz.cayuela@yahoo.es (M.L. Cayuela).
Abstract
Many recent reviews and meta-analyses of N2O emissions do not include data from Mediterranean studies. In this paper we present a meta-analysis of the N2O emissions from Mediterranean cropping systems, and propose a more robust and reliable regional emission factor (EF) for N2O, distinguishing the effects of water management, crop type, and fertilizer management. The average overall EF for Mediterranean agriculture (EFMed) was 0.5%, which is substantially lower than the IPCC default value of 1%. Soil properties had no significant effect on EFs for N2O. Increasing the N fertilizer rate led to higher EFs; when N was applied at rates greater than 400 kg N ha-1, the EF did not significantly differ from the 1% default value (EF: 0.82%). Liquid slurries led to emissions that did not significantly differ from 1%; the other fertilizer types were lower but did not significantly differ from each other. Rain-fed crops in Mediterranean regions have lower EFs (EF: 0.27%) than irrigated crops (EF: 0.63%). Drip irrigation systems (EF: 0.51%) had 44% lower EF than sprinkler irrigation methods (EF: 0.91%). Extensive crops, such as winter cereals (wheat, oat and barley), had lower EFs (EF: 0.26%) than intensive crops such as maize (EF: 0.83%). For flooded rice, anaerobic conditions likely led to complete denitrification and low EFs (EF: 0.19%). Our results indicate that N2O emissions from Mediterranean agriculture are overestimated in current national greenhouse gas inventories and that, with the new EF determined from this study, the effect of mitigation strategies such as drip irrigation or the use of nitrification inhibitors, even if highly significant, may be smaller in absolute terms.
Keywords: N2O, Greenhouse gases, Field studies, Mitigation, Systematic review
1. Introduction
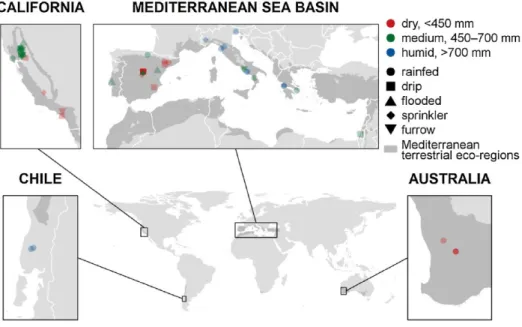
More than half of the global Mediterranean climate zone is located on the Mediterranean Sea Basin
(Aschmann, 1973); the remainder is on the Pacific coast of North America, south-western Australia, the Cape region of South Africa and the central coast of Chile (Olson et al., 2001). One of the most distinctive features of Mediterranean climates is the summer drought and relatively mild temperatures in winter. However, annual precipitation is variable, between 275 and 1000 mm, such that Mediterranean climate regions range from semi-arid to humid.
In Mediterranean climates, precipitation and temperatures are suitable in winter for cultivating a variety of rain-fed crops including cereals, grain legumes, oilseeds and horticulture (Andrews et al., 2002). Cultivation of perennial crops is common in Mediterranean climate areas. Some of these crops are resistant to summer droughts, including olives, almonds, and grapes, while others are cultivated under irrigation, such as citrus and other fruit trees. Agriculture in Mediterranean climates regions, therefore, provides a high diversity of crops.
Agricultural soils are regarded as the primary source of anthropogenic N2O emissions (Smith et al., 2008). Despite the cultural and economic importance of Mediterranean agriculture (Grigg, 1974), the number of field studies analyzing N2O emissions from Mediterranean agricultural lands is much smaller than from other temperate areas (Stehfest and Bouwman, 2006). Recent reviews and meta-analyses of N2O emissions do not include data from Mediterranean studies (e.g. Kim et al., 2013; Lesschen et al., 2011; Shcherbak et al., 2014). Estimating N2O emissions and N2O emission factors (EF, the percentage of fertilizer N applied that is
transformed and emitted on site as N2O) is essential for assessing the impact of agriculture on greenhouse gas (GHG) emissions for a particular area. Current national emission inventory methods use a direct EF for N2O, with a default value of 1% or 1.25% (depending on the country) of the N input from manure and mineral fertilizer (IPCC, 2006). However, many studies have concluded that the response of direct N2O emissions to N input is non-linear (Kim et al., 2013; Philibert et al., 2012; Shcherbak et al., 2014), and other recent studies highlighted the important role of environmental and management factors in determining N2O emissions and EFs, such as climate, soil characteristics, type of fertilizer and time of application, crop type, and irrigation system (Aguilera et al., 2013a; Bouwman et al., 2002; Gerber et al., 2016; Leip et al., 2011; Lesschen et al., 2011). For example, Aguilera et al. (2013a) suggested using a lower EF for Mediterranean areas than for other temperate regions, especially in rain-fed systems.
There are three characteristics of Mediterranean regions that are fundamental to understanding why soil N2O emissions from these regions are idiosyncratic and in-turn why the adoption of EFs which differ from other climate regions should be considered. Firstly, due to limited availability of water, irrigation is a prerequisite for the cultivation of many annual crops during summer, whereas mild, humid winters enable annual crops to be rain-fed. Different EFs are therefore needed for irrigated and rain-fed crops. Secondly, soils in the
Mediterranean zone generally have a neutral to alkaline soil pH and very low concentrations of organic C (Aguilera et al., 2013b; Verheye and de la Rosa, 2005). These conditions influence denitrification rates and N2O/N2 ratios (Li et al., 2005; Šimek and Cooper, 2002). Thirdly, soils in Mediterranean regions are rarely exposed to freeze–thaw cycles, which cause high N2O emissions, especially in fertilized soils (Schouten et al., 2012; Tenuta and Sparling, 2011), which lead to high EFs.
The aim of this study was to improve our understanding of soil N2O emissions from Mediterranean cropping systems by (i) summarizing available field data of soil N2O emissions; (ii) proposing a more robust and reliable regional EF; and (iii) identifying controlling factors of N2O EFs (soil type, climate variability, irrigation and N fertilizer management) as a basis for developing soil N2O mitigation strategies for regions with Mediterranean climates.
Fig. 1. Location of the study sites included in the dataset. The dark gray area delimits the Mediterranean biome from the collection of ecoregions mapped by the World Wildlife Fund (Olson et al., 2001).
2. Methods
2.1. Selection of studies and data extraction
There are varying definitions to demarcate Mediterranean climate regions worldwide, which are typically based on climate and plant associations. We chose the widely used delineation of the Mediterranean biome from the collection of ecoregions mapped by the World Wildlife Fund (Fig. 1). We selected studies in this area and in marginal areas defined as ‘Mediterranean’ by the authors of the original papers. Soil N2O emission data from field-based studies investigating fertilizer-induced soil N2O emissions were collected from these
Mediterranean regions, including the Mediterranean Sea Basin, California, Australia and Chile (Fig. 1). We are not aware of any field study reporting N2O emissions in the Mediterranean region of South Africa (Mary Scholes, Wits University, personal communication).
The criteria for inclusion of a study in the dataset were: (i) area-scaled N2O emissions were reported for N fertilizer treatments, (ii) the number of replicates was reported unambiguously with a minimum of three replicates per treatment, (iii) only field studies were considered and (iv) only when N2O emissions were reported for at least an entire growing season.
The cumulative N2O emissions for each N fertilizer treatment were extracted from published papers and reports, together with a measure of variance, the number of replicates and the N application rate (kg N ha-1) during the observational period. Key characteristics (location, climate data, soil type, soil management,
irrigation, type of fertilizers, etc.) were collected when available (Supplementary material 1). When data were presented graphically, WebPlot Digitizer was used to extract data points (http://
arohatgi.info/WebPlotDigitizer/). If cumulative N2O emissions or other information were not reported, the authors of the field study were contacted to supply missing information. In some cases, cumulative emissions were estimated by integrating the average daily fluxes over the measurement period (Alluvione et al., 2010; Castaldi et al., 2011; Kong et al., 2009; Ranucci et al., 2011; Vitale et al., 2013). Experiments assessing the effect of nitrification/ urease inhibitors were studied as a separate group (when evaluating the influence of the type of fertilization), but were not included to obtain the mean EF for Mediterranean crops(EFMed) because they were not considered representative of current management practices. Fifty-three studies and 223 data-sets were included in the meta-analyses (Table 1, Supplementary material 1).
Since most of the field studies in our database focus on assessing the performance of specific crop
management practices over both emissions and crop yields, they often do not include post-harvest season emissions. While full year emissions are desirable for determining EFs (IPCC, 2016), in the systems we are studying, we assume that the inclusion of growing season only emissions will have minimal influence on our calculated EFs, since emissions in the intercrop period will be a) low in summer (fallow of winter crops), when the soil is dry, due to decreased microbiological activity, and b) very low in winter (fallow of summer crops) under cold conditions without freeze–thaw cycles (Aguilera et al., 2013a). In the few studies where emissions were measured over an entire year, those during the fallow period were 10% or less of the total (e.g. Sanz-Cobena et al., 2012).
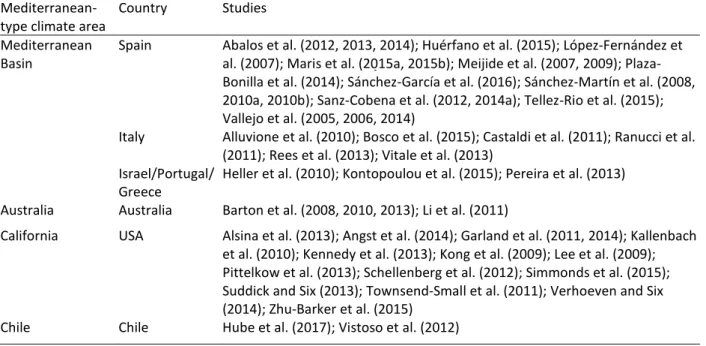
Table 1 Studies included in the meta-analyses.
Mediterranean-type climate area
Country Studies Mediterranean
Basin
Spain Abalos et al. (2012, 2013, 2014); Huérfano et al. (2015); López-Fernández et al. (2007); Maris et al. (2015a, 2015b); Meijide et al. (2007, 2009); Plaza-Bonilla et al. (2014); Sánchez-García et al. (2016); Sánchez-Martín et al. (2008, 2010a, 2010b); Sanz-Cobena et al. (2012, 2014a); Tellez-Rio et al. (2015); Vallejo et al. (2005, 2006, 2014)
Italy Alluvione et al. (2010); Bosco et al. (2015); Castaldi et al. (2011); Ranucci et al. (2011); Rees et al. (2013); Vitale et al. (2013)
Israel/Portugal/ Greece
Heller et al. (2010); Kontopoulou et al. (2015); Pereira et al. (2013) Australia Australia Barton et al. (2008, 2010, 2013); Li et al. (2011)
California USA Alsina et al. (2013); Angst et al. (2014); Garland et al. (2011, 2014); Kallenbach et al. (2010); Kennedy et al. (2013); Kong et al. (2009); Lee et al. (2009); Pittelkow et al. (2013); Schellenberg et al. (2012); Simmonds et al. (2015); Suddick and Six (2013); Townsend-Small et al. (2011); Verhoeven and Six (2014); Zhu-Barker et al. (2015)
2.2. Soil and land management data compilation
Soil and land management data was grouped into categories based on:
- soil pHH2O: (i) pH < 7.5 and (ii) pH > 7.5 (The soil pH values measured with CaCl2 were converted to values measured in distilled water using a method described by Minasny et al. (2011));
- soil texture: (i) coarse (sandy loam, sandy clay loam, loamy sand), (ii) medium (clay loam, loam, silty clay loam, silt, silt loam), and (iii) fine (clay, silt clay, sandy clay) (USDA, 1999);
- topsoil organic C concentration: low (<10 g C kg-1 soil), medium (10–20 g C kg-1 soil), and high (>20 g C kg-1 soil);
- water input and management: (i) rain-fed and annual precipitation <450 mm, (ii) rain-fed and annual precipitation >450 mm, (iii) sprinklers, (iv) flooded, (v) furrow or surface irrigation, and (vi) drip irrigation;
- type of N fertilizer: (i) synthetic (including all types of mineral fertilizers), (ii) organic-solid (compost, solid fraction of manures, solid organic residues), (iii) organic-liquid (pig/cattle slurries, liquid fraction of slurries, digestates), (iv) organic-synthetic mixture, and (v) inhibitors (nitrification and/or urease inhibitors: DCD, DMPP,NBPT);
- N fertilizer rate: (i) <100 kg N ha-1, (ii) 100–400 kg N ha-1, and (iii) >400 kg N ha-1;
- type of crop: (i) winter cereals (hereafter: ‘cereals’), (ii) horticulture, (iii) maize, (iv) rice, (v) perennials, and (vi) other.
2.3. Calculation of emission factors
Most studies included in the meta-analysis did not explicitly report EFs since they were designed with different aims. We calculated EFs as the difference between N2O emissions from a fertilized treatment (kg N2O N ha
-1 ) and the non-fertilized (control) treatment (kg N2O N-N ha
-1
) divided by applied N fertilizer (kg N ha-1). In 39% of cases, there was no control treatment and these missing data were obtained through multiple imputation by chained equations (Azur et al., 2011) with IBM SPSS Statistics 24 (for a detailed description of missing data treatment and sensitivity tests see Supplementary material 2).
2.4. Data analysis
We performed a standard pair-wise meta-analysis using emission factors (EFs) as effect sizes with MetaWin version 2 (Rosenberg et al., 2000). Mean effect sizes for each grouping and the 95% confidence intervals (CI) generated by bootstrapping (999 iterations) were calculated using a categorical random effects model (Adams et al., 1997). For a detailed description of the statistical procedure see Supplementary material 2. Mean effect sizes were considered significantly different from each other if their 95% CI did not overlap; they were
considered significantly different from the default IPCC Tier I value (1%) if the 95% CIs did not overlap with 1%. To test the possibility of publication bias (studies showing no significant effects might not be published), the Rosenthal's fail-safe N test was used (Rosenthal, 1979).
2.5. Case study: effect of EF choice on Spanish N2O emissions estimation
We chose Spain to examine the effect of applying the EFs found in this study because Spain includes both rain-fed and irrigated crops, and has one of the largest agricultural land uses within Europe. In addition, nutrient budgets at the regional scale have been well developed for Spain (Lassaletta et al., 2014; Sanz-Cobena et al., 2014b). We processed the information provided by MMARM (2010) on N fertilizer use (organic and synthetic) for rain-fed and irrigated crops (by surface) in Spanish NUTS3 (Nomenclature of territorial Units for statistics, level 3) regions to estimate the total input of fertilizer per climatic region (temperate and Mediterranean) and water management type. We then compared two methods to calculate the Spanish national N2O emissions: 1) ‘Current EF’, we applied an EF = 1.0% (IPCC, 2006) on the N inputs; 2) ‘New EFs’, the EFs obtained in this study for rain-fed, furrow, sprinkler and drip-irrigated systems in Mediterranean areas, and the IPCC (2006) EF for temperate areas in the cropping systems of northern Spain.
3. Results
3.1. Cumulative N2O emissions and EF for Mediterranean regions
A total of 53 field studies analyzing N2O emissions in Mediterranean areas have been published in the last 10 years from four of the five Mediterranean regions worldwide (see Supplementary material 2 for regional description). The cumulative emissions compiled here ranged from 0.15 kg N2O N ha
-1
in a rice crop in California (Simmonds et al., 2015) to 43.3 kg N2O N ha
-1
in a maize field in Israel (Heller et al., 2010), with a mean value of 2.8 kg N2O N ha
-1
. N2O emissions were on average largest for drip irrigation (4.6 kg N2O N ha -1
) and smallest for flooded irrigation (0.5 kg N2O N ha
-1
) systems (Table 2). Synthetic fertilizers were the dominant type of fertilizer in all irrigation systems (Fig. S2) with drip irrigation systems receiving the most N fertilizer (295 kg N ha-1), with some cases of extremely high (1500 kg N ha-1) application rates (Heller et al., 2010). Treatments with a mixture of organic-synthetic fertilizers emitted the most N2O (9.8 kg N2O N ha
-1 ), which is related to the high average N application rate in this group (535 kg N ha-1). Organic-liquid fertilizers were applied at similar rates as synthetic fertilizers, but their emissions were on average higher (4.8 vs. 1.7 kg N2O N ha
-1
). The use of organic-solid fertilizers or the addition of inhibitors led to the lowest average cumulative emissions (1.8 and 1.2 kg N2O N ha
-1
highest N2O emissions (4.7 and 3.4 kg N2O N ha -1
), while rice and cereal crops had the lowest (0.5 and 0.7 kg N2O N ha
-1
) (Table 2).
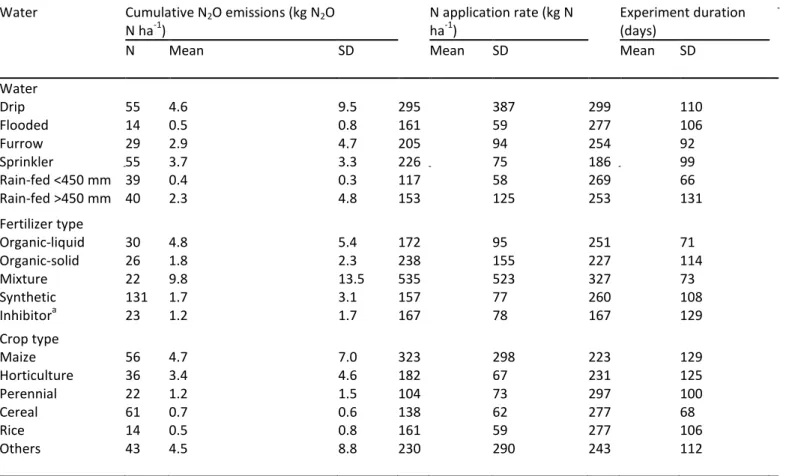
Table 2 The number of observations (N), mean and standard deviation (SD) of cumulative N2O emissions, N application
rate and experiment duration for some of the factors with a significant influence on N2O emissions from agricultural
fields.
Water Cumulative N2O emissions (kg N2O
N ha-1)
N application rate (kg N ha-1)
Experiment duration (days)
N Mean SD Mean SD Mean SD
Water Drip 55 4.6 9.5 295 387 299 110 Flooded 14 0.5 0.8 161 59 277 106 Furrow 29 2.9 4.7 205 94 254 92 Sprinkler 55 3.7 3.3 226 75 186 99 Rain-fed <450 mm 39 0.4 0.3 117 58 269 66 Rain-fed >450 mm 40 2.3 4.8 153 125 253 131 Fertilizer type Organic-liquid 30 4.8 5.4 172 95 251 71 Organic-solid 26 1.8 2.3 238 155 227 114 Mixture 22 9.8 13.5 535 523 327 73 Synthetic 131 1.7 3.1 157 77 260 108 Inhibitora 23 1.2 1.7 167 78 167 129 Crop type Maize 56 4.7 7.0 323 298 223 129 Horticulture 36 3.4 4.6 182 67 231 125 Perennial 22 1.2 1.5 104 73 297 100 Cereal 61 0.7 0.6 138 62 277 68 Rice 14 0.5 0.8 161 59 277 106 Others 43 4.5 8.8 230 290 243 112 a
inhibitor refers to treatments with synthetic and/or organic fertilizers where nitrification or urease inhibitors were applied.
The mean EF for Mediterranean crops (EFMed)—covering rain-fed and irrigated systems, arable and permanent crops, organically and synthetically fertilized systems (treatments with inhibitors excluded) for all
Mediterranean-type climate areas was 0.50% 0.12 (EFMed 95%CI, N = 200; Rosenthal’s fail-safe test: 4830). Grouping into different categories allowed us to identify which factors (soil, crop, irrigation system, type of fertilizer and application rate) had a significant impact on averaged EFs, providing key information when proposing N2O mitigation strategies.
3.2. Influence of soil characteristics on EF
Soil pH, soil organic C or soil texture did not significantly affect EFs. Soil pHs ranged from 4.8 in a rice experimental station field site in California (Simmonds et al., 2015) to 8.5 in a cereal crop in north-eastern Spain (Plaza-Bonilla et al., 2014), with most soils having a neutral to alkaline pH (in 83% of the cases, pH > 7).
The concentration of organic C in soils ranged from 4 g C kg-1 soil in California (Schellenberg et al., 2012) to 133 g C kg-1 soil in Chile (Vistoso et al., 2012), and the average soil organic C concentration was 15.9 g C kg-1 soil. EFs did not significantly differ among soils with low (EF: 0.56, N = 59), medium (EF: 0.51, N = 94) or high (EF: 0.37, N = 5) organic C concentrations. Finally, soil texture had no significant effect on average EFs, although trends suggested that larger EFs could be expected from coarse (EF: 0.58%, N = 77) and medium-textured soils (EF: 0.48%, N = 100), than from fine-textured soils (EF: 0.27%, N = 22).
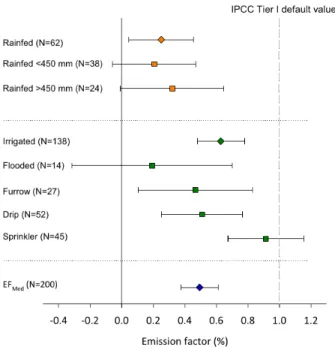
3.3. Influence of water management on EF
Rain-fed systems had an average EF of 0.27% 0.21 (N = 62) which was significantly lower than 1% (Fig. 2). Studies under dry Mediterranean conditions (average annual precipitation <450 mm) had lower EFs (EF: 0.21% 0.26, N = 38) than studies in areas with an average annual precipitation >450 mm (EF: 0.32% 0.33, N = 24).
There was high variability in EFs between types of irrigation management (Fig. 2). Drip-irrigated (including both surface and subsurface) and furrow systems had lower EFs (EF: 0.51% 0.26, N = 52 and EF: 0.47% 0.36, N = 27, respectively) than sprinklers (EF: 0.91% 0.24, N = 45), which was close and not significantly differ from the IPCC default EF.
It is important to note that drip-irrigated systems had the highest level of N fertilization (Table 2), which could have biased the results of the meta-analysis, increasing the EF for this group. Flooded systems (rice fields) had the lowest EF (0.19% 0.50, N = 14), in line with IPCC (2006) guidelines.
3.4. Influence of fertilizer type and application rate on EF
The highest EFs corresponded with organic-liquid fertilizers (EF: 0.85% 0.30, N = 30), which were mostly pig or cattle slurries, or the liquid fraction of their digestates (Fig. 3); this EF did not significantly differ from 1%. The rest of the fertilizer types had an EF significantly lower than 1% but were statistically similar to each other. The use of nitrification/urease inhibitors decreased the average EFs (EF: 0.14% 0.32, N = 23) when compared with synthetic, liquid, and mixtures of organic and synthetic fertilizers, but was similar to EFs from organic-solid fertilizers (EF: 0.19% 0.33, N = 24). Crops fertilized with organic-organic-solid fertilizers received, on average, almost double the amount of N than those with synthetic or liquid fertilizers (Table 2), which reinforces organic-solid fertilization as a strategy to decrease EFs. Although not statistically significant, higher N
application rates increased EFs. Low N application rates (<100 kg N ha-1) had the lowest EFs (EF: 0.27%, N = 40), whereas high N application rates (>400 kg N ha-1) resulted in EFs that did not significantly differ from the 1% IPCC value (EF: 0.82%, N = 15).
Fig. 2. The influence of different irrigation options on changes in N2O emission factors (EFs) in Mediterranean-type climate
areas. Symbols represent mean effect sizes [EFs (%)] with 95% confidence intervals. The numbers shown in parentheses correspond to observations in each class upon which the statistical analysis was based. For this analysis, treatments with nitrification inhibitors were excluded (see Methods).
Fig. 3. The impact of the type of N fertilizer and application rate on changes in N2O emission factors (EFs) in
Mediterranean-type climate areas. Symbols represent mean effect sizes [EFs (%)] with 95% confidence intervals. The numbers shown in parentheses correspond to observations in each class upon which the statistical analysis was based.
3.5. Influence of crop types on EF
Five out of the six considered crops presented EFs significantly lower than 1% (Fig. 4). Rice and cereals (wheat, barley, and oat) had the smallest EFs (EF: 0.19% 0.51, N = 14 for rice and 0.26% 0.22, N = 53 for cereals). Perennials (including vineyards, almonds, and olive orchards) and others (including pasture, legumes,
rapeseed, crop rotations and bare soil) had intermediate EFs (EF: 0.54%, N = 19 for perennials and EF: 0.47%, N = 33 for others). Horticultural crops (melons, onions, tomatoes, and potatoes) showed a slightly higher than average EF (EF: 0.63% 0.31, N = 34). Finally, maize had a relatively high average EF (EF: 0.83% 0.26, N = 47) which did not significantly differ from the 1% default.
3.6. Case study: effect of EF choice on Spanish N2O emissions estimation
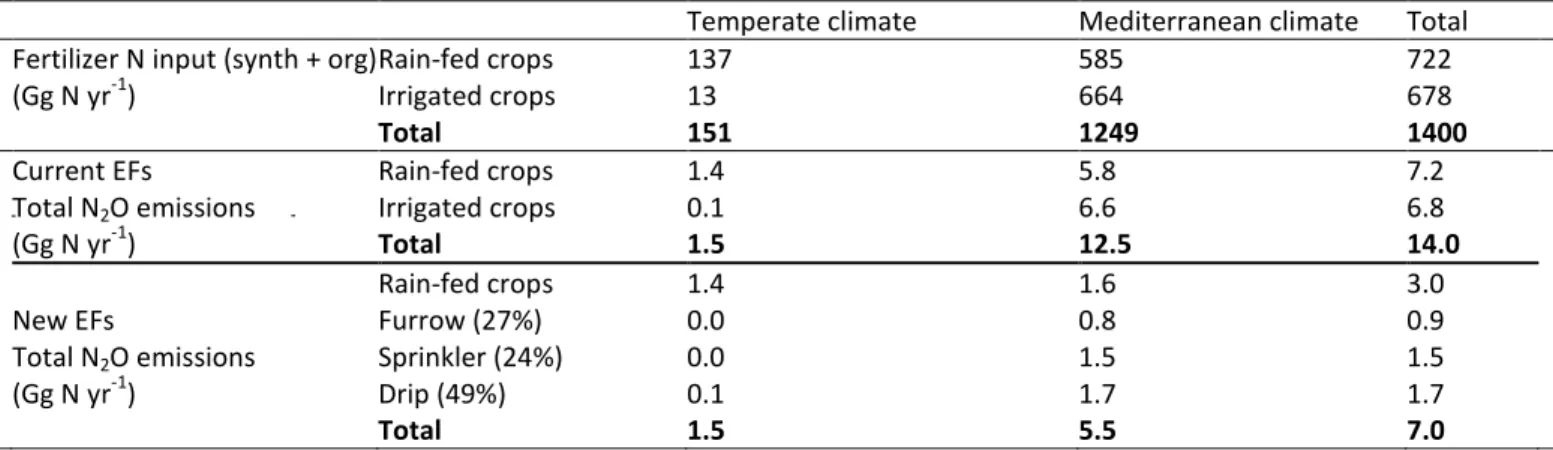
Table 3 shows ‘current EF’ used by national inventories (IPCC, 2006) and the ‘New EFs’ determined from this study for rain-fed, furrow, sprinkler and drip-irrigated systems in Mediterranean crops. Nitrous oxide emissions from Spanish agriculture vary considerably depending on the calculation method. The emissions from
Mediterranean Spanish agriculture calculated with the current EF (12.5 Gg N2O N yr -1
) exceeded the value using the new EFs (5.5 Gg N2O N yr-1) by a factor of two and this had a substantial impact on the estimates of total national emissions from cropping systems (Table 4).
Fig. 4. Average N2O emission factors (EFs) in Mediterranean-type climate areas depending on the type of crop. Symbols
represent mean effect sizes [EFs (%)] with 95% confidence intervals. The numbers shown in parentheses correspond to observations in each class upon which the statistical analysis was based. For this analysis, treatments with nitrification inhibitors were excluded (see Methods).
Table 3 Emission factors (EFs) used to estimate total N2O emissions in the Spanish cropping systems: current EFs
according to IPCC (2006) and the new values for Mediterranean areas developed in this work for different irrigation systems. The percentages in brackets show the proportion of the area under each irrigation system in Spain.
EFs Temperate climate Mediterranean climate
Current Rain-fed crops 1.0% 1.0%
Irrigated crops 1.0% 1.0%
New EFs Rain-fed crops 1.0% 0.27%
Irrigated furrow (27% surface) 1.0% 0.47% Sprinkler (24% surface) 1.0% 0.91% Drip (49% surface) 1.0% 0.51%
Table 4 Comparison of total N2O emissions in Spanish cropping systems (MMARM, 2010) after the application of the
current EFs and the new EFs obtained in this study, considering that all the irrigated crops are furrow, sprinkler or drip irrigated. The percentages in brackets show the proportion of the area under each irrigation system in Spain.
Temperate climate Mediterranean climate Total Fertilizer N input (synth + org) Rain-fed crops 137 585 722 (Gg N yr-1) Irrigated crops 13 664 678
Total 151 1249 1400
Current EFs Rain-fed crops 1.4 5.8 7.2 Total N2O emissions Irrigated crops 0.1 6.6 6.8
(Gg N yr-1) Total 1.5 12.5 14.0
Rain-fed crops 1.4 1.6 3.0
New EFs Furrow (27%) 0.0 0.8 0.9
Total N2O emissions Sprinkler (24%) 0.0 1.5 1.5
(Gg N yr-1) Drip (49%) 0.1 1.7 1.7
Total 1.5 5.5 7.0
4. Discussion
In this paper, we derived an EF for N2O emissions from Mediterranean regions (EFMed: 0.5%) and demonstrated that EFs in Mediterranean-cultivated lands are significantly lower than the 1% IPCC Tier I default value (IPCC, 2006) or the 1.25% (IPCC, 1996) used to calculate N2O emissions in response to
applying N fertilizer to land. We, therefore, recommend that Mediterranean countries, or regions, consider refining their national inventories to reflect the relatively small EF. Here, we show the implications of such a change by using the EFs obtained in this study to estimate total N2O emissions from cropping systems in Spain and compare them to estimates using the IPCC default value.
To derive statistically robust estimates of EFs, we opted to retain studies without control measurements. We performed a sensitivity test (see Supplementary material 2) which demonstrated that including these studies had no impact on the mean EFMed (EF: 0.496% including all studies and EF: 0.463% excluding cases without control, see Supplementary material 2). We, therefore, conclude that the EFMed is robust, but due to the high heterogeneity of the studies included in the dataset, it was often difficult to find significant differences between different management strategies. Further field research, measuring emissions over
the whole year and including control treatments, is merited to better quantify EFs for the various management options in Mediterranean systems.
4.1. Influence of soil characteristics on EF
Soil characteristics show very limited impact of EFs. This finding seems to contradict previous studies where soil organic C concentration and pH had a clear impact on denitrification and therefore N2O emissions (Li et al., 2005; Šimek and Cooper, 2002). However, these relationships might be difficult to find in our dataset, where most soils had a neutral or slightly alkaline pH and similar (in general low) concentrations of organic C, with other variables having a stronger effect on N2O emissions (N application rate, soil water content, type of fertilizer applied, etc.). In addition, although denitrification is generally identified as the major process generating N2O in most cropping systems, this does not necessarily stand for studies under Mediterranean conditions, where the importance of nitrifier-nitrification and nitrifier-denitrification have been documented (Sánchez-García et al., 2014; Sánchez-Martín et al., 2008). Nitrification (contrarily to denitrification) does not need an additional source of C and therefore if nitrification pathways dominate, the soil C availability may not play an important role on N2O emissions.
Although not significant, we found higher EFs in coarse/ medium-textured soils (EF: 0.58 and 0.48%) than in fine-textured soils (EF: 0.27%). Since denitrification needs anaerobic conditions, which are more likely to occur in fine-textured soils, this result seems contradictory. Our finding might be related to (i) complete denitrification (transformation to N2) in less-aerated fine-textured soils (Šimek and Cooper, 2002) or (ii) nitrification processes having an important role in N2O emissions, with higher nitrification rates in low water content, well-aerated soils (Thomsen et al., 2003). Also, previous studies found higher annual denitrification losses in loamy soils than sandy or clay-textured soils, which was interpreted as a limitation of C diffusion by adsorption to clays in fine-textured soils (Barton et al., 1999).
4.2. Influence of water management on EF
Among the irrigation technologies used in Mediterranean cropping systems, furrows are still widespread in summer-irrigated crops and sprinkler irrigation systems are on the increase in Spain (MAGRAMA, 2014). However, since many Mediterranean regions suffer from water scarcity, water-saving irrigation systems such as drip irrigation (both surface and subsurface) are being developed. The area sown to maize under drip irrigation is expected to increase due to higher water use efficiency, maintained crop yields and technical viability (Couto et al., 2013). Despite these advantages, the impact of drip irrigation systems on N2O emissions is poorly documented.
Our analyses revealed that EFs for N2O from drip-irrigated systems are much lower than those in which water is applied through sprinklers, even when the average N application rate was higher with drip
irrigation. This is consistent with other field-based research (Kallenbach et al., 2010; Sánchez-Martín et al., 2008) and a previous review under Mediterranean conditions (Aguilera et al., 2013a). The reduction in N2O emissions with drip irrigation is probably caused by a reduction in the rate of water application compared with other conventional systems (Sharma-sarkar et al., 2001). This may decrease the soil-water-filled pore space (WFPS) below the optimum range for N2O production through denitrification, which is 60–90% depending on soil type (Barton et al., 1999,Sanz-Cobena et al., 2014a). WFPS levels below this threshold are common in many of the drip irrigation studies included in this review. For instance, in Abalos et al. (2014), the WFPS was below 65% for 84% of the experimental period; it never exceeded 50% in the study of Schellenberg et al. (2012), and it ranged from 20 to 30% and 40–60% in Kallenbach et al. (2010) and Kennedy et al. (2013), respectively. Therefore, our results suggest that drip irrigation represents an effective N2O mitigation practice in Mediterranean irrigated systems. These benefits, however, should be evaluated together with other effects on the GHG balance and further socioenvironmental consequences. For example, increased infrastructure material requirements and energy needs for pressurizing the irrigation water might offset drip irrigation N2O-related emission savings in certain situations, while reduced water use (and related energy consumption) might be the main component responsible for emission reduction in other situations (Sanz-Cobena et al., 2017).
The lower EFs found under furrow irrigation compared to sprinkler irrigation might be related to a slightly lower average N application in the furrow systems included in our dataset and to a different soil wetting pattern, favoring complete denitrification to N2 after irrigation events in furrows (Sánchez-Martín et al., 2008).
Our results show that rain-fed crops with less than 450 mm rainfall and flooded systems have the lowest EFs of all systems (Fig. 2). In contrast, rain-fed crops in areas with annual precipitation greater than 450 mm have larger emissions. These findings show the strong effect of specific climatic conditions and soil
moisture on the performance of Mediterranean cropping systems in terms of N2O emissions. The
distribution of rain inputs also plays a relevant role. The first rainfall after long periods of drought (common in summers of Mediterranean areas) usually triggers N2O emissions. This pulsing effect, also observed in the dry areas of drip-irrigated crops, is due to the accumulation of mineral N in dry soils and the reactivation of water-stressed bacteria after rainfall events (Sánchez-Martín et al., 2010a; Skiba et al., 1997).
Drip irrigation may have an adverse side-effect as its use has been associated with enhanced emissions of nitric oxide (NO) (Abalos et al., 2014). This is because the lower WFPS may favor NO production from
nitrification. Pilegaard (2013) reported maximum NO emissions at intermediate soil moisture (40–60% WFPS) since NO is highly reactive and will be consumed at higher soil moisture.
4.3. Influence of fertilizer type and application rate on EF
Our results suggest that the use of liquid manures and inorganic N fertilizers results in greater N2O
emissions than organic-solid fertilizers such as composted manures and green wastes. Liquid and inorganic N fertilizers are likely to be more readily available to plants and microorganisms, whereas solid organically-bound N requires decomposition and microbial mineralization to be used in N2O-producing processes (Poodle et al., 2002). Composted organic fertilizer N is thus released more slowly, ultimately increasing N uptake by crops (Ryals et al., 2015) and decreasing the potential for N2O emissions. It is notable that not all organic fertilizers are equivalent with regard to their potential effects on N2O emissions. For example, fresh manures and manure slurries can result in relatively large N2O emissions. A recent meta-analysis found the IPCC Tier II model underestimated N2O emissions from cattle manure in the United States by an order of magnitude (Owen and Silver, 2015). Davidson (2009) also suggested that manure management was a dominant source of atmospheric N2O concentrations, accounting for more than 40% of anthropogenic N2O emissions. Liquid manures are rich in both N and C, potentially facilitating N2O production in low C
environments, mostly through denitrification. As already observed in Aguilera et al. (2013a), solid manure would result in lower N2O emissions, unlike in more humid areas with relatively high decomposition rates and N2O EFs (Owen et al., 2015).
As expected, nitrification/urease inhibitors effectively reduced EFs from Mediterranean systems (Mosier et al., 1996). In a recent review, Gilsanz et al. (2016) developed EFs of 0.42% 2.2 and 0.70% 3.3 for DCD and DMPP, respectively, two commonly used nitrification inhibitors. The lower EF found in our study (0.14% 0.32) agrees with the low baseline EFs found in the studies included in our dataset. Thus, inhibitors seem to be a good strategy to mitigate direct N2O emissions under Mediterranean conditions, although the
potential is lowered by the relatively small baseline emissions in Mediterranean systems.
In agreement with previous studies (Kim et al., 2013; Shcherbak et al., 2014), increasing fertilizer
application rates led to increased EFs. We found that applying N fertilizers over 400 kg N ha-1 resulted in EFs that did not significantly differ from the 1% IPCC Tier I default value. The lack of statistical significance between N doses is probably related to the fact that in our dataset most studies only considered one N application rate, with a limited number of cases with very low or high N fertilization rates.
4.4. Influence of crop types on EF
In a previous quantitative review of Mediterranean cropping systems, Aguilera et al. (2013a) observed that the differences in cumulative N2O emissions among crop types clearly respond to the management
characteristics of each crop type; our results confirm these conclusions. Generally, the crop types in which water and fertilizer applications are low (see Figs. S3 and S4 and Table 2), such as rain-fed crops (winter cereals), have the lowest N2O response to N applications. A low EF for rice is associated with flooding which generates anaerobic conditions favoring complete denitrification to N2, thereby reducing N2O release from the soil (Conrad, 1996). Maize has a high EF, possibly because it is irrigated without implementation of water-saving techniques and has on average higher N application rates. The wide confidence intervals observed for the EFs in perennials and rice are due to the lower number of observations within these crop categories.
4.5. Case study: effect of EF choice on Spanish N2O emissions estimation
In this work we have seen how the application of EFs adapted to Mediterranean conditions can significantly reduce the national estimates of total N2O emissions from cropping systems. Applying the new EFs has consequences for determining the effectiveness of N2O mitigation strategies in Mediterranean regions, as baseline emissions will be smaller than those suggested by Tier I emission estimates. The level of indirect emissions is, however, highly uncertain, and published information is scarce, and has thus not been assessed in this study. IPCC Tier I proposes an EF for indirect emissions of 0.75% while Garnier et al. (2009, 2013) estimated that, for the Seine temperate basin, indirect emissions represented 13– 17% of total direct emissions. Due to the regulation of water in Mediterranean agricultural areas in Spain through a dense drainage network and reservoirs (Aguilera et al., 2015), the potential for denitrification could be high and could, therefore, generate high indirect emissions. The magnitude of indirect N2O emissions in
Mediterranean areas is an interesting area for future research.
5. Concluding remarks
The average EF for nitrous oxide emissions in Mediterranean cropping systems was 50% lower than the IPCC Tier I default value (1%), which is largely based on values observed in temperate regions. The most important factors controlling the magnitude of soil N2O EFs from Mediterranean regions were water regime (irrigation technique or precipitation amount) and fertilizer type and application rate. In rain-fed systems with precipitation below 450 mm, the EF is much lower than the IPCC values. The EF for sprinkler-irrigated systems is similar to that for temperate cropping systems, whereas drip-irrigated systems have a high
potential for mitigation (EF: 0.51%). The N fertilizer rate altered EFs, suggesting a non-linear relationship between N2O emissions and N application rate. Intensive cropping systems, such as irrigated maize, tended to have higher EFs than less intensive systems such as cereals.
Applying specific EFs would lower estimates of total N2O emissions in countries with large areas of agricultural soils in Mediterranean climates. For example, applying current Tier I EFs to Spanish cropping systems leads to a total N2O emission estimate that is a factor of two higher than when applying the new EFs from our analysis (14 Gg N2O N yr
-1
vs. 7 Gg N2O N yr -1
). Our results indicate that N2O emissions from Mediterranean agriculture are much lower than expected and that with the new EFs, the effect of
mitigation strategies such as drip irrigation or using nitrification inhibitors, even if highly significant, may be smaller in absolute terms (since baseline emissions will be lower).
Acknowledgements
The authors are grateful to M. Scholes, D. Plaza-Bonilla, S. Menendez, P. Merino, S.C. Maris, H. Heller, D. Savvas, C. K. Kontopoulou, who were contacted and kindly supplied any missing information necessary for the meta-analysis. Special thanks to J.P.C. Eekhout for preparing Fig. 1 and F. Estellés for providing the basic data for the calculation of the fertilization in Spain. Also thanks to two anonymous reviewers for their helpful comments. M. L. Cayuela was supported by a ‘Ramon y Cajal’ research contract from the Spanish Ministry of Economy and Competitiveness. Thanks to Fundación Séneca, Agencia Regional de Ciencia y Tecnología de la Región de Murcia for support (grant number 19281/PI/14). Australian studies included in the meta-analysis were funded by the Australian Government, the Grains Research and Development Corporation, and the Department of Agriculture and Food WA.
Appendix A. Supplementary data
Supplementary data associated with this article can be found, in the online version, at http://dx.doi.org/10.1016/j.agee.2016.10.006.
References
Abalos, D., Sanz-Cobena, A., Misselbrook, T., Vallejo, A., 2012. Effectiveness of urease inhibition on the abatement of ammonia, nitrous oxide and nitric oxide emissions in a non-irrigated Mediterranean barley field. Chemosphere 89, 310– 318.
Abalos, D., Sanz-Cobena, A., Garcia-Torres, L., van Groenigen, J., Vallejo, A., 2013. Role of maize stover incorporation on nitrogen oxide emissions in a non-irrigated Mediterranean barley field. Plant Soil 364, 357–371.
Abalos, D., Sanchez-Martin, L., Garcia-Torres, L., van Groenigen, J.W., Vallejo, A., 2014. Management of irrigation frequency and nitrogen fertilization to mitigate GHG and NO emissions from drip-fertigated crops. Sci. Total Environ. 490, 880– 888.
Adams, D.C., Gurevitch, J., Rosenberg, S., 1997. Resampling tests for meta-analysis of ecological data. Ecology 78, 1277–1283.
Aguilera, E., Lassaletta, L., Sanz-Cobena, A., Garnier, J., Vallejo, A., 2013a. The potential of organic fertilizers and water management to reduce N2O emissions in Mediterranean climate cropping systems. A review. Agric. Ecosyst. Environ. 164, 32–52.
Aguilera, E., Lassaletta, L., Gattinger, A., Gimeno, B.S., 2013b. Managing soil carbon for climate change mitigation and adaptation in Mediterranean cropping systems: a meta-analysis. Agric. Ecosyst. Environ. 168, 25–36.
Aguilera, R., Marcé, R., Sabater, S., 2015. Detection and attribution of global change effects on river nutrient dynamics in a large Mediterranean basin. Biogeosciences 12, 4085–4098.
Alluvione, F., Bertora, C., Zavattaro, L., Grignani, C., 2010. Nitrous oxide and carbon dioxide emissions following green manure and compost fertilization in corn. Soil Sci. Soc. Am. J. 74, 384–395.
Alsina, M.M., Fanton-Borges, A.C., Smart, D.R., 2013. Spatiotemporal variation of event related N2O and CH4 emissions during fertigation in a California almond orchard. Ecosphere 4, art1.
Andrews, S.S., Mitchell, J.P., Mancinelli, R., Karlen, D.L., Hartz, T.K., Horwath, W.R., Pettygrove, G.S., Scow, K.M., Munk, D.S., 2002. On-farm assessment of soil quality in California's Central Valley. Agron. J. 94, 12–23.
Angst, T.E., Six, J., Reay, D.S., Sohi, S.P., 2014. Impact of pine chip biochar on trace greenhouse gas
emissions and soil nutrient dynamics in an annual ryegrass system in California. Agric. Ecosyst. Environ. 191, 17–26.
Aschmann, H., 1973. Distribution and peculiarity of Mediterranean ecosystems. In: Di Castri, F., Mooney, H.A. (Eds.), Mediterranean-Type Ecosystems: Origin and Structure. Springer, New York, pp. 11–19.
Azur, M.J., Stuart, E.A., Frangakis, C., Leaf, P.J., 2011. Multiple imputation by chained equations: what is it and how does it work? Int. J. Meth. Psychiatr. Res. 20, 40– 49.
Barton, L., Mclay, C.D.A., Schipper, L.A., Smith, C.T., 1999. Annual denitrification rates in agricultural and forest soils: a review. Aus. J. Soil Res. 37, 1073–1093.
Barton, L., Kiese, R., Gatter, D., Butterbach-Bahl, K., Buck, R., Hinz, C., Murphy, D.V., 2008. Nitrous oxide emissions from a cropped soil in a semi-arid climate. Glob. Change Biol. 14, 177–192.
Barton, L., Murphy, D.V., Kiese, R., Butterbach-Bahl, K., 2010. Soil nitrous oxide and methane fluxes are low from a bioenergy crop (canola) grown in a semi-arid climate. Global Change Biol. 2, 1–15.
Barton, L., Murphy, D., Butterbach-Bahl, K., 2013. Influence of crop rotation and liming on greenhouse gas emissions from a semi-arid soil. Agric. Ecosyst. Environ. 167, 23–32.
Bosco, S., Volpi, I., Nassi o Di Nasso, N., Triana, F., Roncucci, N., Tozzini, C., Villani, R., Laville, P., Neri, S., Mattei, F., Virgili, G., Nuvoli, S., Fabbrini, L., Bonari, E., 2015. LIFE + IPNOA mobile prototype for the monitoring of soil N2O emissions from arable crops: first-year results on durum wheat. Ital. J. Agron. 10, 8.
Bouwman, A.F., Boumans, L.J.M., Batjes, N.H., 2002. Emissions of N2O and NO from fertilized fields: summary of available measurement data. Glob. Biogeochem. Cy. 16 6-1–6-13.
Castaldi, S., Riondino, M., Baronti, S., Esposito, F.R., Marzaioli, R., Rutigliano, F.A., Vaccari, F.P., Miglietta, F., 2011. Impact of biochar application to a Mediterranean wheat crop on soil microbial activity and
greenhouse gas fluxes. Chemosphere 85, 1464–1471.
Conrad, R., 1996. Soil microorganisms as controllers of atmospheric trace gases (H2, CO, CH 4, OCS, N2O, and NO). Microbiol. Rev. 60, 609–640.
Couto, A., Padin, A.R., Reinoso, B., 2013. Comparative yield and water use efficiency of two maize hybrids differing in maturity under solid set sprinkler and two different lateral spacing drip irrigation systems in
Davidson, E.A., 2009. The contribution of manure and fertilizer nitrogen to atmospheric nitrous oxide since 1860. Nat. Geosci. 2, 659–662.
Garland, G.M., Suddick, E., Burger, M., Horwath, W.R., Six, J., 2011. Direct N2O emissions following
transition from conventional till to no-till in a cover cropped Mediterranean vineyard (Vitis vinifera). Agric. Ecosyst. Environ. 141, 234–239.
Garland, G.M., Suddick, E., Burger, M., Horwath, W.R., Six, J., 2014. Direct N2O emissions from a Mediterranean vineyard: event-related baseline measurements. Agric. Ecosyst. Environ. 195, 44–52.
Garnier, J., Billen, G., Vilain, G., Martinez, A., Silvestre, M., Mounier, E., Toche, F., 2009. Nitrous oxide (N2O) in the Seine river and basin: observations and budgets. Agric. Ecosyst. Environ. 133, 223–233.
Garnier, J., Vilain, G., Jehanno, S., Silvestre, M., Billen, G., Poirier, D., Martinez, A., Decuq, C., Cellier, P., Abril, G., 2013. Methane emissions from land use, livestock farming, and the river network of the Seine basin (France). Biogeochemistry 116, 199–214.
Gerber, J.S., Carlson, K.M., Makowski, D., Mueller, N.D., Garcia de Cortazar-Atauri, I., Havlík, P., Herrero, M., Launay, M., O'Connell, C.S., Smith, P., West, P.C., 2016. Spatially explicit estimates of N2O emissions from croplands suggest climate mitigation opportunities from improved fertilizer management. Global Change Biol. 22, 3383–3394. doi:http://dx.doi.org/10.1111/gcb.13341.
Gilsanz, C., Baez, D., Misselbrook, T.H., Dhanoa, M.S., Cardenas, L.M., 2016. Development of emission factors and efficiency of two nitrification inhibitors, DCD and DMPP. Agric. Ecosyst. Environ. 216, 1–8.
Grigg, D.B., 1974. Mediterranean agriculture. In: Grigg, D.B. (Ed.), The Agricultural Systems of the World. An Evolutionary Approach. Cambridge University Press, Cambridge, pp. 123–151.
Heller, H., Bar-Tal, A., Tamir, G., Bloom, P., Venterea, R.T., Chen, D., Zhang, Y., Clapp, C. E., Fine, P., 2010. Effects of manure and cultivation on carbon dioxide and nitrous oxide emissions from a corn field under Mediterranean conditions. J. Environ. Qual. 39, 437–448.
Huérfano, X., Fuertes-Mendizábal, T., Duñabeitia, M.K., González-Murua, C., Estavillo, J.M., Menéndez, S., 2015. Splitting the application of 3,4-dimethylpyrazole phosphate (DMPP): Influence on greenhouse gases emissions and wheat yield and quality under humid Mediterranean conditions. Eur. J. Agron. 64, 47–57.
Hube, S., Alfaro, M., Scheer, C., Brunk, C., Ramírez, L., Rowling, D., Grace, P., 2017. Effect of nitrification and urease inhibitors on nitrous oxide and methane emissions from an oat crop in a volcanic ash soil. Agric. Ecosyst. Environ. 238, 46–54.
IPCC, 1996. Revised 1996 IPCC Guidelines for National Greenhouse Gas Inventories. Available at: http://www.ipcc-nggip.iges.or.jp/public/gl/invs1.html. (accessed 22.01.2016).
IPCC, 2006. 2006 IPCC Guidelines for National Greenhouse Gas Inventories. Ed: H.S. Eggleston, L. Buendia, K. Miwa, T. Ngara and K. Tanabe (Hayama: Intergovernmental Panel on Climate Change, IGES). Available at: http://www. ipcc-nggip.iges.or.jp/public/2006gl/index.html. (accessed 22.01.2016).
IPCC, 2016. Emission Factor Database. http://www.ipcc-nggip.iges.or.jp/EFDB/main.php. (accessed 03.03.2016).
Kallenbach, C.M., Rolston, D.E., Horwath, W.R., 2010. Cover cropping affects soil N2O and CO2 emissions differently depending on type of irrigation. Agric. Ecosyst. Environ. 137, 251–260.
Kennedy, T.L., Suddick, E.C., Six, J., 2013. Reduced nitrous oxide emissions and increased yields in California tomato cropping systems under drip irrigation and fertigation. Agric. Ecosyst. Environ. 170, 16–27.
Kim, D.G., Hernandez-Ramirez, G., Giltrap, D., 2013. Linear and nonlinear dependency of direct nitrous oxide emissions on fertilizer nitrogen input: a meta-analysis. Agric. Ecosyst. Environ. 168, 53–65.
Kong, A.Y.Y., Fonte, S.J., van Kessel, C., Six, J., 2009. Transitioning from standard to minimum tillage Trade-offs between soil organic matter stabilization, nitrous oxide emissions, and N availability in irrigated cropping systems. Soil Tillage Res. 104, 256–262.
Kontopoulou, C.-K., Bilalis, D., Pappa, V.A., Rees, R.M., Savvas, D., 2015. Effects of organic farming practices and salinity on yield and greenhouse gas emissions from a common bean crop. Sci. Hortic. Amsterdam 183, 48–57.
López-Fernández, S., Díez, J.A., Hernáiz, P., Arce, A., García-Torres, L., Vallejo, A., 2007. Effects of fertiliser type and the presence or absence of plants on nitrous oxide emissions from irrigated soils. Nutr. Cycl. Agroecosyst. 78, 279–289.
Lassaletta, L., Billen, G., Romero, E., Garnier, J., Aguilera, E., 2014. How changes in diet and trade patterns have shaped the N cycle at the national scale: spain (1961– 2009). Reg. Environ. Change 14, 785–797.
Lee, J., Hopmans, J.W., van Kessel, C., King, A.P., Evatt, K.J., Louie, D., Rolston, D.E., Six, J., 2009. Tillage and seasonal emissions of CO2: N2O and NO across a seed bed and at the field scale in a Mediterranean climate. Agric. Ecosyst. Environ. 129, 378–390.
Leip, A., Busto, M., Winiwarter, W., 2011. Developing spatially stratified N2O emission factors for Europe. Environ. Pollut. 159, 3223–3232.
Lesschen, J.P., Velthof, G.L., de Vries, W., Kros, J., 2011. Differentiation of nitrous oxide emission factors for agricultural soils. Environ. Pollut. 159, 3215–3222.
Li, C., Frolking, S., Butterbach-Bahl, K., 2005. Carbon sequestration in arable soils is likely to increase nitrous oxide emissions, offsetting reductions in climate radiative forcing. Clim. Change 72, 321–338.
Li, Y., Barton, L., Chen, D., 2011. Simulating response of N2O emissions to fertiliser N application and climatic variability from a rain-fed and wheat cropped soil in Western Australia. J. Sci. Food Agric. 92, 1130– 1143.
MAGRAMA (Ministerio de Agricultura, Alimentación y Medio Ambiente), 2014. Inventario Nacional De Emisiones De Contaminantes a La Atmósfera in Spanish. www.magrama.gob.es/es/calidad-y-evaluacion-ambiental/temas/sistema-espanol-de-inventario-sei-/.
MMARM (Ministerion de Medioambiente, Rural y Marino), 2010. Balance del nitrógeno en la agricultura española. Año 2008. Ministerio de Medio Ambiente, Rural y Marino, Madrid.
Maris, S.C., Teira-Esmatges, M.R., Arbonés, A., Rufat, J., 2015a. Effect of irrigation, nitrogen application, and a nitrification inhibitor on nitrous oxide, carbon dioxide and methane emissions from an olive (Olea
europaea L.) orchard. Sci. Total Environ. 538, 966–978.
Maris, S.C., Teira-Esmatges, M.R., Català, M.M., 2015b. Influence of irrigation frequency on greenhouse gases emission from a paddy soil. Paddy Water Environ. 14, 199–210.
Meijide, A., Díez, J.A., Sánchez-Martín, L., López-Fernández, S., Vallejo, A., 2007. Nitrogen oxide emissions from an irrigated maize crop amended with treated pig slurries and composts in a Mediterranean climate. Agric. Ecosyst. Environ. 121, 383–394.
Meijide, A., García-Torres, L., Arce, A., Vallejo, A., 2009. Nitrogen oxide emissions affected by organic fertilization in a non-irrigated Mediterranean barley field. Agric. Ecosyst. Environ. 132, 106–115.
Minasny, B., McBratney, A.B., Brough, D.M., Jacquier, D., 2011. Models relating soil pH measurements in water and calcium chloride that incorporate electrolyte concentration. Eur. J. Soil Sci. 62, 728–732.
Mosier, A.R., Parton, W.J., Valentine, D.W., Ojima, D.S., Schimel Delgado, J.A., 1996. CH4 and N2O fluxes in the Colorado shortgrass steppe: 1. Impact of landscape and nitrogen addition. Glob. Biogeochem. Cy. 10, 387–399.
Olson, D.M., Dinerstein, E., Wikramanayake, E.D., Burgess, N.D., Powell, G.V.N., Underwood, E.C., D'Amico, J.A., Strand, H.E., Morrison, J.C., Loucks, C.J., Allnutt, T. F., Lamoreux, J.F., Ricketts, T.H., Itoua, I., Wettengel, W.W., Kura, Y., Hedao, P., Kassem, K., 2001. Terrestrial ecoregions of the world: a new map of life on Earth. Bioscience 51, 933–938.
Owen, J., Silver, W.L., 2015. Greenhouse gas emissions from dairy manure management: a review of field-based studies. Glob. Change Biol. 21, 550–565.
Owen, J., Parton, W.J., Silver, W.L., 2015. Long-term impacts of manure amendments on carbon and greenhouse gas dynamics of rangelands. Glob. Change Biol. 21, 4533–4547.
Pereira, J., Figueiredo, N., Goufo, P., Carneiro, J., Morais, R., Carranca, C., Coutinho, J., Trindade, H., 2013. Effects of elevated temperature and atmospheric carbon dioxide concentration on the emissions of methane and nitrous oxide from Portuguese flooded rice fields. Atmos. Environ. 80, 464–471.
Philibert, A., Loyce, C., Makowski, D., 2012. Quantifying uncertainties in N2O emission due to N fertilizer application in cultivated areas. PLoS One 7, e50950.
Pilegaard, K., 2013. Processes regulating nitric oxide emissions from soils. Philos. T. Roy. Soc. B 368, 20130126.
Pittelkow, C.M., Adviento-Borbe, M.A., Hill, J.E., Six, J., van Kessel, C., Linquist, B.A., 2013. Yield-scaled global warming potential of annual nitrous oxide and methane emissions from continuously flooded rice in response to nitrogen input. Agric. Ecosyst. Environ. 177, 10–20.
Plaza-Bonilla, D., Álvaro-Fuentes, J., Arrúe, J.L., Cantero-Martínez, C., 2014. Tillage and nitrogen fertilization effects on nitrous oxide yield-scaled emissions in a rainfed Mediterranean area. Agric. Ecosyst. Environ. 189, 43–52.
Poodle, D.D., Horwath, W.R., Lanini, W.T., Temple, S.R., van Brugge, A.H.C., 2002. Comparison of soil N availability and leaching potential crop yields and weeds in organic, low-input and conventional farming systems in northern California. Agric. Ecosyst. Environ. 90, 125–137.
Ranucci, S., Bertolini, T., Vitale, L., Di Tommasi, P., Ottaiano, L., Oliva, M., Amato, U., Fierro, A., Magliulo, V., 2011. The influence of management and environmental variables on soil N2O emissions in a crop system in Southern Italy. Plant Soil 343, 83–96.
Rees, R.M., Augustin, J., Alberti, G., Ball, B.C., Boeckx, P., Cantarel, A., Castaldi, S., Chirinda, N., Chojnicki, B., Giebels, M., Gordon, H., Grosz, B., Horvath, L., Juszczak, R., Kasimir Klemedtsson, Å., Klemedtsson, L., Medinets, S., Machon, A., Mapanda, F., Nyamangara, J., Olesen, J.E., Reay, D.S., Sanchez, L., Sanz Cobena, A., Smith, K.A., Sowerby, A., Sommer, M., Soussana, J.F., Stenberg, M., Topp, C.F.E., van Cleemput, O., Vallejo, A., Watson, C.A., Wuta, M., 2013. Nitrous oxide emissions from European agriculture; an analysis of variability and drivers of emissions from field experiments. Biogeosciences 10, 2671–2682.
Rosenberg, M.S., Adams, D.C., Gurevitch, J., 2000. MetaWin: Statistical Software for Meta-Analysis. Version 2.0. Sinauer Associates, Sunderland, Massachusetts.
Rosenthal, R., 1979. The file drawer problem and tolerance for null results. Psychol. Bull. 86, 638–641.
Ryals, R., Hartman, M., Parton, W.J., DeLonge, M., Silver, W.S., 2015. Long-term climate change mitigation potential with organic matter management on grasslands. Ecol. Appl. 25, 531–545.
Sánchez-García, M., Roig, A., Sánchez-Monedero, M.A., Cayuela, M.L., 2014. Biochar increases N2O emissions under nitrification mediated pathways. Front. Env. Sci. 2
doi:http://dx.doi.org/10.3389/fenvs.2014.00025.
Sánchez-García, M., Sánchez-Monedero, M.A., Roig, A., López-Cano, I., Moreno, B., Benitez, E., Cayuela, M.L., 2016. Compost vs. biochar amendment: a two-year field study evaluating soil C build-up and N
dynamics in an organically managed olive crop. Plant Soil doi:http://dx.doi.org/10.1007/s11104-016-2794-4 (in press).
Sánchez-Martín, L., Arce, A., Benito, A., Garcia-Torres, L., Vallejo, A., 2008. Influence of drip and furrow irrigation systems on nitrogen oxide emissions from a horticultural crop. Soil Biol. Biochem. 40, 1698–1706.
Sánchez-Martín, L., Meijide, A., Garcia-Torres, L., Vallejo, A., 2010a. Combination of drip irrigation and organic fertilizer for mitigating emissions of nitrogen oxides in semiarid climate. Agric. Ecosyst. Environ. 137, 99–107.
Sánchez-Martín, L., Sanz-Cobena, A., Meijide, A., Quemada, M., Vallejo, A., 2010b. The importance of the fallow period for N2O and CH4 fluxes and nitrate leaching in a Mediterranean irrigated agroecosystem. Eur. J. Soil Sci. 61, 710–720.
Sanz-Cobena, A., Sanchez-Martín, L., García, L., Vallejo, A., 2012. Gaseous emissions of N2O and NO and NO3 leaching from urea applied with urease and nitrification inhibitors to a maize (Zea mays) crop. Agric. Ecosyst. Environ. 149, 64–73.
Sanz-Cobena, A., Abalos, D., Sánchez-Martin, L., Meijide, A., Vallejo, A., 2014a. Soil moisture content determines the effect of the urease inhibitor NBPT on N2O emissions. Mitig. Adapt. Strategies Glob. Change . http://link.springer.com/ article/10.1007/s11027-014-9548-5.
Sanz-Cobena, A., Lassaletta, L., Estellés, F., Prado, A.D., Guardia, G., Abalos, D., Aguilera, E., Pardo, G., Vallejo, A., Sutton, M.A., Garnier, J., Billen, G., 2014b. Yield-scaled mitigation of ammonia emission from N fertilization: the Spanish case. Environ. Res. Lett. 9, 125005.
Sanz-Cobena, A., Lassaletta, L., Aguilera, E., del Prado, A., Garnier, J., Billen, G., Iglesias, A., Sánchez, B., Guardia, G., Abalos, D., Plaza-Bonilla, D., Puigdueta, I., Moral, R., Galán, E., Arriaga, H., Merino, P., Infante-Amate, J., Meijide, A., Pardo, G., Alvaro-Fuentes, J., Gilsanz, C., Báez, D., Doltra, J., González, S., Cayuela, M.L., Menendez, S., Diaz-Pines, E., Le-Noe, J., Quemada, M., Estellés, F., Calvet, S., van Grinsven, H., Yáñez, D., Westhoek, H., Sanz, M.J., Sánchez-Jimeno, B., Vallejo, A., Smith, P., 2017. Strategies for greenhouse gas emissions mitigation in Mediterranean agriculture: A review. Agric. Ecosyst. Environ. 238, 5–24.
Schellenberg, D.L., Alsina, M.M., Muhammad, S., Stockert, C.M., Wolff, M.W., Sanden, B.L., Brown, P.H., Smart, D.R., 2012. Yield-scaled global warming potential from N2O emissions and CH4 oxidation for almond (Prunus dulcis) irrigated with nitrogen fertilizers on arid land. Agric. Ecosyst. Environ. 155, 7–15.
Schouten, S., van Groenigen, J.W., Oenema, O., Cayuela, M.L., 2012. Bioenergy from cattle manure? Implications of anaerobic digestion and subsequent pyrolysis for carbon and nitrogen dynamics in soil. GCB Bioenergy 4, 751–760.
Sharmasarkar, F.C., Sharmasarkar, S., Miller, S.D., Vance, G.F., Zhang, R., 2001. Assessment of drip and flood irrigation on water and fertilizer use efficiencies for sugar beets. Agric. Water Manage. 46, 241–251.
Shcherbak, I., Millar, N., Robertson, G.P., 2014. Global metaanalysis of the nonlinear response of soil nitrous oxide (N2O) emissions to fertilizer nitrogen. Proc. Natl. Acad. Sci. USA 111, 9199–9204.
Šimek, M., Cooper, J.E., 2002. The influence of soil pH on denitrification: progress towards the understanding of this interaction over the last 50 years. Eur. J. Soil Sci. 53, 345–354.
Simmonds, M.B., Anders, M., Adviento-Borbe, M.A., van Kessel, C., McClung, A., Linquist, B.A., 2015. Seasonal methane and nitrous oxide emissions of several rice cultivars in direct-seeded systems. J. Environ. Qual. 44, 103–114.
Skiba, U., Fowler, D., Smith, K.A., 1997. Nitric oxide emissions from agricultural soils in temperate and tropical climates: sources, controls and mitigation options. Nutr. Cycl. Agroecosyst. 48, 139–153.
Smith, P., Martino, D., Cai, Z., Gwary, D., Janzen, H., Kumar, P., McCarl, B., Ogle, S., O'Mara, F., Rice, C., Scholes, B., Sirotenko, O., Howden, M., McAllister, T., Pan, G., Romanenkov, V., Schneider, U., Towprayoon, S., Wattenbach, M., Smith, J., 2008. Greenhouse gas mitigation in agriculture. Philos. Trans. R. Soc. B 363, 789–813.
Stehfest, E., Bouwman, L., 2006. N2O and NO emission from agricultural fields and soils under natural vegetation: summarizing available measurement data and modeling of global annual emissions. Nutr. Cycl. Agroecosyst. 74, 207–228.
Suddick, E.C., Six, J., 2013. An estimation of annual nitrous oxide emissions and soil quality following the amendment of high temperature walnut shell biochar and compost to a small scale vegetable crop rotation. Sci. Total Environ. 465, 298–307.
Tellez-Rio, A., García-Marco, S., Navas, M., López-Solanilla, E., Tenorio, J.L., Vallejo, A., 2015. N2O and CH4 emissions from a fallow?wheat rotation with low N input in conservation and conventional tillage under a Mediterranean agroecosystem. Sci. Total Environ. 508, 85–94.
Tenuta, M., Sparling, B., 2011. A laboratory study of soil conditions affecting emissions of nitrous oxide from packed cores subjected to freezing and thawing. Can. J. Soil Sci. 91, 223–233.
Thomsen, I.K., Schjønning, P., Olesen, J.E., Christensen, B.T., 2003. C and N turnover in structurally intact soils of different texture. Soil Biol. Biochem. 35, 765–774.
Townsend-Small, A., Pataki, D.E., Czimczik, C.I., Tyler, S.C., 2011. Nitrous oxide emissions and isotopic composition in urban and agricultural systems in southern California. J. Geophys. Res. 116, G01013.
USDA, 1999. Soil Taxonomy: A Basic System of Soil Classification for Making and Interpreting Soil Surveys. US Government printing Office, Washington DC.
Vallejo, A., García-Torres, L., Díez, J.A., Arce, A., López-Fernández, S., 2005. Comparison of N losses (NO3 , N2O, NO) from surface applied, injected or amended (DCD) pig slurry of an irrigated soil in a Mediterranean climate. Plant Soil 272, 313–325.
Vallejo, A., Skiba, U.M., García-Torres, L., Arce, A., López-Fernández, S., Sánchez-Martín, L., 2006. Nitrogen oxides emission from soils bearing a potato crop as influenced by fertilization with treated pig slurries and composts. Soil Biol. Biochem. 38, 2782–2793.
Vallejo, A., Meijide, A., Boeckx, P., Arce, A., García-Torres, L., Aguado, P.L., Sanchez-Martin, L., 2014. Nitrous oxide and methane emissions from a surface drip-irrigated system combined with fertilizer management. Eur. J. Soil Sci. 65, 386– 395.
Verheye, W., de la Rosa, D., 2005. Mediterranean Soils, in Land Use and Land Cover, from Encyclopedia of Life Support Systems (EOLSS), Developed Under the Auspices of the UNESCO. Eolss Publishers, Oxford, UK.
Verhoeven, E., Six, J., 2014. Biochar does not mitigate field-scale N2O emissions in a Northern California vineyard: an assessment across two years. Agric. Ecosyst. Environ. 191, 27–38.
Vistoso, E., Alfaro, M., Saggar, S., Salazar, F., 2012. Effect of nitrogen inhibitors on nitrous oxide emissions and pasture growth after an autumn application in volcanic soil. Chil. J. Agric. Res. 72, 133–139.
Vitale, L., Ottaiano, L., Polimeno, F., Maglione, G., Amato, U., Arena, C., Di Tommasi, P., Mori, M., Magliulo, V., 2013. Effects of 3,4-dimethylphyrazole phosphate-added nitrogen fertilizers on crop growth and N2O emissions in Southern Italy. Plant Soil Environ. 59, 517–523.
Zhu-Barker, X., Horwath, W.R., Burger, M., 2015. Knife-injected anhydrous ammonia increases yield-scaled N2O emissions compared to broadcast or band-applied ammonium sulfate in wheat. Agr. Ecosyst. Environ. 212, 148–157.