HAL Id: hal-01833329
https://hal.archives-ouvertes.fr/hal-01833329
Submitted on 13 Jul 2018
HAL is a multi-disciplinary open access
archive for the deposit and dissemination of
sci-entific research documents, whether they are
pub-lished or not. The documents may come from
teaching and research institutions in France or
abroad, or from public or private research centers.
L’archive ouverte pluridisciplinaire HAL, est
destinée au dépôt et à la diffusion de documents
scientifiques de niveau recherche, publiés ou non,
émanant des établissements d’enseignement et de
recherche français ou étrangers, des laboratoires
publics ou privés.
reducing O-GlcNAcylation
Roselle Gélinas, Florence Mailleux, Justine Dontaine, Laurent Bultot,
Bénédicte Demeulder, Audrey Ginion, Evangelos P. Daskalopoulos, Hrag
Esfahani, Emilie Dubois-Deruy, Benjamin Lauzier, et al.
To cite this version:
Roselle Gélinas, Florence Mailleux, Justine Dontaine, Laurent Bultot, Bénédicte Demeulder, et al..
AMPK activation counteracts cardiac hypertrophy by reducing O-GlcNAcylation. Nature
Communi-cations, Nature Publishing Group, 2018, 9 (1), pp.374. �10.1038/s41467-017-02795-4�. �hal-01833329�
AMPK activation counteracts cardiac hypertrophy
by reducing O-GlcNAcylation
Roselle Gélinas
1
, Florence Mailleux
1
, Justine Dontaine
1
, Laurent Bultot
1
, Bénédicte Demeulder
1
, Audrey Ginion
1
,
Evangelos P. Daskalopoulos
1
, Hrag Esfahani
2
, Emilie Dubois-Deruy
2
, Benjamin Lauzier
3
, Chantal Gauthier
3
,
Aaron K. Olson
4,5
, Bertrand Bouchard
5
, Christine Des Rosiers
5,6
, Benoit Viollet
7,8,9
, Kei Sakamoto
10
,
Jean-Luc Balligand
2
, Jean-Louis Vanoverschelde
1,11
, Christophe Beauloye
1,11
, Sandrine Horman
1
& Luc Bertrand
1
AMP-activated protein kinase (AMPK) has been shown to inhibit cardiac hypertrophy. Here,
we show that submaximal AMPK activation blocks cardiomyocyte hypertrophy without
affecting downstream targets previously suggested to be involved, such as p70 ribosomal S6
protein kinase, calcineurin/nuclear factor of activated T cells (NFAT) and extracellular
signal-regulated kinases. Instead, cardiomyocyte hypertrophy is accompanied by increased protein
O-GlcNAcylation, which is reversed by AMPK activation. Decreasing O-GlcNAcylation by
inhibitors of the glutamine:fructose-6-phosphate aminotransferase (GFAT), blocks
cardio-myocyte hypertrophy, mimicking AMPK activation. Conversely, O-GlcNAcylation-inducing
agents counteract the anti-hypertrophic effect of AMPK. In vivo, AMPK activation prevents
myocardial hypertrophy and the concomitant rise of O-GlcNAcylation in wild-type but not in
AMPK
α2-deficient mice. Treatment of wild-type mice with O-GlcNAcylation-inducing agents
reverses AMPK action. Finally, we demonstrate that AMPK inhibits O-GlcNAcylation by
mainly controlling GFAT phosphorylation, thereby reducing O-GlcNAcylation of proteins
such as troponin T. We conclude that AMPK activation prevents cardiac hypertrophy
pre-dominantly by inhibiting O-GlcNAcylation.
DOI: 10.1038/s41467-017-02795-4
OPEN
1Pole of Cardiovascular Research, Institut de Recherche Expérimentale et Clinique, Université catholique de Louvain, Brussels, 1200, Belgium.2Pole of
Pharmacotherapy, Institut de Recherche Expérimentale et Clinique, Université catholique de Louvain, Brussels, 1200, Belgium.3l’institut du thorax, INSERM, CNRS, Univ. Nantes, Nantes, 44007, France.4Department of Pediatrics, University of Washington School of Medicine and Seattle Children’s Research Institute, Seattle, 98105-0371 WA, USA.5Montreal Heart Institute, Montreal, H1T 1C8, Canada.6Department of Nutrition, Université de Montréal, Montreal, H3T 1A8, Canada.7Institut Cochin, INSERM U1016, 75014 Paris, France.8CNRS UMR8104, 75014 Paris, France.9Université Paris Descartes
Sorbonne Paris Cité, Paris, 75014, France.10Nestlé Institute of Health Sciences SA, Lausanne, 1015, Switzerland.11Division of Cardiology Cliniques
Universitaires Saint-Luc, Brussels, 1200, Belgium. Roselle Gélinas and Florence Mailleux contributed equally to this work. Correspondence and requests for materials should be addressed to L.B. (email:[email protected])
123456789
P
athological cardiac hypertrophy is considered to be a
compensatory mechanism that aims to maintain cardiac
function in the face of mechanical or neurohormonal
stresses
1. However, sustained pathological cardiac hypertrophy
eventually becomes maladaptive and is a predictor of heart
fail-ure
2. Intracellular signaling pathways regulating cardiac
hyper-trophy development are multiple and complex
3,4. Amongst them,
the most extensively studied ones are the calcineurin/nuclear
factor of activated T cells (NFAT) and mitogen-activated protein
kinase ERK pathways promoting gene expression, as well as the
mammalian target of rapamycin (mTOR)/p70 ribosomal S6
protein kinase (p70S6K) and eukaryotic elongation factor-2
(eEF2) pathways involved in the stimulation of protein
synthesis
3,5.
AMP-activated protein kinase (AMPK) is a cellular fuel gauge,
which can detect energetic disequilibrium occurring under
metabolic stress
6,7. Once activated, AMPK inhibits various
ana-bolic pathways, including protein synthesis via its action on both
mTOR/p70S6K and eEF2 pathways
8,9, and enhances catabolic
pathways, such as glycolysis, to restore energetic balance required
for cell survival
7,10. Because of its dampening action on protein
synthesis, AMPK has been suggested to be a putative inhibitor of
cardiac hypertrophy. In line with this interpretation, AMPK
activation
by
activators
such
as
5-Aminoimidazole-4-carboxamide ribonucleoside (AICAr), metformin or resveratrol
prevents hypertrophy induced by phenylephrine (PE) in cultured
cardiomyocytes
11,12. This not only correlates with alteration of
p70S6K and eEF2 phosphorylation and decrease in protein
synthesis, but also with inhibition of ERK and NFAT
signaling
11, 13, 14. Likewise, AMPK activation by AICAr,
met-formin or adiponectin attenuates cardiac hypertrophy and
improves cardiac function in rodent models subjected to
trans-verse aortic constriction (TAC) or isoproterenol treatment, and
this is concomitant with inhibition of the afore-mentioned
sig-naling pathways
13,15–17. However, there is no robust evidence
demonstrating that all these downstream signaling pathways are
involved in the anti-hypertrophic action of AMPK.
O-linked
N-acetylglucosamine
(O-GlcNAc)
is
a
post-translational protein modification occurring on Ser/Thr
resi-dues. A small but significant part of cellular glucose enters the
hexosamine biosynthesis pathway (HBP), under the control of
glutamine:fructose-6-phosphate aminotransferase (GFAT),
finally
producing UDP-GlcNAc, which then serves as substrate for
O-GlcNAcylation. Besides GFAT, O-GlcNAcylation is regulated by
two other enzymes, O-GlcNAc transferase (OGT) and
β-N-acetylglucosaminidase (OGA)
18. OGT adds and OGA removes
the O-GlcNAc moiety, respectively
18. HBP is involved in multiple
physiological processes but is also associated with undesirable
cellular events in chronic diseases, such as diabetes inducing
adverse effects in the heart
18,19. In relation to cardiac pathologies,
O-GlcNAcylation levels are increased during acute myocardial
ischemia and chronic heart failure, but in these cases, with a
cardioprotective effect
18, 20, 21. The role of O-GlcNAc during
cardiac hypertrophy development is complex and still remains
partly unclear
18,21. Action of O-GlcNAc largely depends on the
context of cardiac hypertrophy with distinctive roles in
hyper-trophy development when linked to diabetes or to physiological
exercise or to pressure overload pathological conditions
18, 21.
Regarding our topic, cardiac GlcNAc signaling and
O-GlcNAcylation levels are increased in rats with pressure
overload-mediated cardiac hypertrophy and in patients with
aortic stenosis
22,23. Similarly, O-GlcNAc is increased in neonatal
rat
ventricular
myocytes
(NRVMs)
submitted
to
pro-hypertrophic stimuli, and pharmacological inhibition of
O-GlcNAc signaling reverses the hypertrophic transcriptional
reprogramming
23.
The present study was undertaken to better define the
inhibi-tory role of AMPK in pathological cardiac hypertrophy
devel-opment and to unambiguously identify the key cellular events
involved in this process. Using low concentrations of AMPK
activators, including the direct activator A769662
24, we show that
AMPK activation efficiently inhibits cardiomyocyte hypertrophy
without affecting any of the previously-described AMPK
down-stream targets, suggesting that AMPK regulates cardiac
hyper-trophy via a not-yet-identified mechanism. Inasmuch as AMPK is
a known regulator of glucose metabolism
7,10, we sought potential
links between AMPK, cardiac hypertrophy prevention and
O-GlcNAcylation process. Here, we report that an increase in
pro-tein O-GlcNAcylation is required for cardiac hypertrophy
development. More importantly, we demonstrate that AMPK
activation prevents both cardiomyocyte hypertrophy in vitro and
cardiac hypertrophy in vivo by inhibiting O-GlcNAc signaling via
its actions on GFAT and OGT.
Taken together, our results demonstrate that AMPK activation
prevents both in vitro and in vivo cardiac hypertrophy
develop-ment predominantly by decreasing protein O-GlcNAcylation.
Results
AMPK activation by A769662 prevents NRVM hypertrophy.
First, we assessed the ability of A769662, a selective and direct
allosteric activator of AMPK
25to activate the AMPK pathway in
NRVMs. We started by using a concentration of 100
µM giving
maximal AMPK activation in adult cardiomyocytes
26. We
showed that, at this concentration, A769662 rapidly increased
AMPK activity, which was maximal at 5 min and persisted for at
least 24 h (Supplementary Fig.
1
a). The same applied for the
phosphorylation of its bona
fide substrate acetyl-CoA carboxylase
(ACC) (Supplementary Fig.
1
b).
Next, we verified the capacity of A769662 to prevent
PE-induced NRVM hypertrophy. NRVMs were treated for 24 h with
20
µM PE to promote hypertrophy
12, 27, in the presence or
absence of 100
µM A769662 (Supplementary Fig.
1
c).
A769662-mediated phosphorylation of AMPK and of ACC was similar in
cells treated with or without PE (Supplementary Fig.
1
d, e). PE
induced a significant increase in cell size (~2-fold, p < 0.05
two-way ANOVA with bonferroni post-test), as revealed by
α-actinin
immunostaining (Supplementary Fig.
1
f, g), which was abolished
by A769662 treatment. Moreover, mRNA level of Nppb, a genetic
marker of pathological cardiac hypertrophy
28, was significantly
elevated by PE (~2-fold, p
< 0.05, two-way ANOVA with
bonferroni post-test), this increase being prevented by A769662
(Supplementary Fig.
1
h).
We next examined AMPK downstream targets previously
proposed to be involved in the context of cardiac hypertrophy
and we
first analyzed p70S6K and eEF2, which are involved in the
regulation of protein synthesis (Supplementary Fig.
1
i-k). As
reported by others
12,29, PE increased p70S6K phosphorylation at
its activating site Thr389 and decreased eEF2 phosphorylation at
its inhibitory site Thr56. A769662 counteracted the action of PE
on phosphorylation of both p70S6K and eEF2. In agreement,
PE-induced cardiomyocyte hypertrophy was accompanied by a 2-fold
increase in protein synthesis (monitored by radiolabeled amino
acid incorporation into proteins), which was abrogated by
co-treatment with 100
µM A769662 (Supplementary Fig.
1
l).
Regarding pathways regulating gene expression, PE induced the
phosphorylation of both ERK1 and ERK2 isoforms at their
dual-activating phosphorylation sites Thr202/Tyr204
30, and this was
inhibited by A769662 (Supplementary Fig.
1
i, m). Next, we
examined the calcineurin/NFAT pathway by measuring NFAT
transcriptional activity with a luciferase reporter gene
31. PE
transcriptional activity, which was fully inhibited by A769662
(Supplementary Fig.
1
n). Because NFAT activation results in its
translocation to the nucleus
31, we examined the cellular
localization of NFATc3, one of the NFAT isoforms involved in
the hypertrophic signal downstream of calcineurin
32. NFATc3
was translocated to the nucleus upon PE stimulation and this was
blocked by A769662 (Supplementary Fig.
1
o, p).
AMPK prevents hypertrophy independently of known targets.
To rule out a possible AMPK-independent action of A769662, as
previously reported at high concentrations
33, 34, dose-response
curves of A769662 were performed (Fig.
1
a–h). Even at the lowest
concentration used (12.5
µM), A769662 stimulated the AMPK
signaling pathway (Fig.
1
a) and fully inhibited PE-induced
hypertrophy (Fig.
1
b, c). To confirm AMPK involvement in
A769662’s action at this low concentration, both AMPKα1 and
AMPKα2 catalytic subunits were knocked-down with small
interfering RNA (siRNA) transfection (Fig.
1
i–l). The 95%
decrease in expression of AMPKα catalytic subunits (Fig.
1
i) was
accompanied by loss of A769662 action on AMPK signaling
(Fig.
1
j). This AMPK deletion, which was similar in control and
PE-treated cells (Supplementary Fig.
2
), abolished the
anti-hypertrophic action of A769662 (Fig.
1
k, l). This confirmed that
A769662-mediated inhibition of NRVM hypertrophy is an
AMPK-dependent mechanism.
Unexpectedly, none of the proposed AMPK targets was altered
at low concentration (Fig.
1
d–h). Indeed, while 12.5 µM A769662
fully curtailed cardiomyocyte hypertrophy, no inhibition of
NFAT activity, ERK, and p70S6K phosphorylation, as well as
amino acid incorporation into proteins could be observed at this
concentration. Interestingly, this observation also occurred with
other pro-hypertrophic stimulus and AMPK activators. Indeed,
A769662-mediated inhibition of hypertrophy occurred without
modification of known AMPK targets when Angiotensin II
(AngII) (100 nM) was used as pro-hypertrophic agent
(Supple-mentary Fig.
3
). Besides, we chose to utilize AICAr and a member
of the biguanide family, phenformin as other AMPK activators,
such compounds having been used in the past at high
concentration to inhibit hypertrophy
11, 12. Similar to what was
observed with A769662, AICAr (Fig.
2
a–e and Supplementary
Fig.
4
a-c) and phenformin (Fig.
2
f–j and Supplementary Fig.
4
d–f)
abolished PE-induced cardiomyocyte hypertrophy at
concentra-tions ranging from 0.25 to 0.03 mM, respectively. Only higher
doses of these compounds were able to block some of p70S6K,
ERK, NFAT signaling and protein synthesis, whereas lower
effective doses were unable to do so. Collectively, these results
support the idea that low doses of AMPK activators are capable of
preventing cardiomyocyte hypertrophy without acting on the
aforementioned AMPK targets, suggesting the involvement of
another mechanism.
AMPK activation decreases protein O-GlcNAcylation. Since
HBP stimulation and O-GlcNAcylation (Fig.
3
a), are known to
occur during cardiac hypertrophy development
22, we assessed
O-GlcNAc levels in NRVMs treated with PE. O-O-GlcNAc levels were
rapidly increased following PE supplementation (before 2 h of PE
treatment) (Fig.
3
b, c). As previously shown in aortic banding
induced-cardiac hypertrophy
22, this increase in O-GlcNAc levels
correlated with an increase in protein level of GFAT, the
rate-limiting step of HBP (Fig.
3
b, d). This was rapidly followed by an
increase in cell size (Fig.
3
e), suggesting a link between O-GlcNAc
levels and hypertrophy development.
Remarkably, AMPK activation by 12.5
µM A769662 blunted
the increase in O-GlcNAc levels that occurs 24 h after PE
treatment (Fig.
3
f–i). Inasmuch as it has been recently shown that
AMPK can phosphorylate GFAT on Ser243 inducing its
inactivation
35, we evaluated the impact of 12.5
µM A769662 on
GFAT Ser243 phosphorylation and found a significant increase
after 1 h of A769662 incubation (Fig.
3
j). In agreement with the
partial inhibition mediated by AMPK on GFAT
35, the effect of
A769662 on cardiomyocyte size and O-GlcNAc levels were only
observable after 8 h of treatment (Fig.
3
k–l). We can reasonably
hypothesize that this delay is due to the time necessary for GFAT
inhibition to blunt HBP pathway. Nevertheless, those results
show a perfect correlation between cardiomyocyte size and
O-GlcNAc levels, reinforcing the link between O-O-GlcNAc increased
and hypertrophy development.
We can conclude from these observations that hypertrophy is
accompanied by an increase in GFAT expression promoting
O-GlcNAcylation and that concomitant AMPK activation promotes
GFAT phosphorylation leading to HBP inhibition and O-GlcNAc
level reduction.
O-GlcNAc inducers block the anti-hypertrophic effect of
AMPK. We then evaluated the putative key role of
HBP/O-GlcNAc inhibition in the anti-hypertrophic action of AMPK by
using O-GlcNAc inducers. Two different ways are commonly
used to increase cellular O-GlcNAc levels (Fig.
3
a). The
rate-limiting HBP enzyme GFAT can be bypassed by feeding
glu-cosamine (GlcN) to cells
18. Alternatively, OGA can be
inhib-ited pharmacologically by compounds such as
O-(2-acetamido-2-deoxy-D-glucopyranosylidene)amino N-phenyl carbamate
(PUGNAc)
18. Both strategies have been used in our in vitro
model. GlcN efficiently increased O-GlcNAc levels under basal
condition (2-fold and 4-fold increase for PE and GlcN
treat-ments, respectively, p
≤ 0.05 vs. control, Student’s t-test) and,
more importantly, prevented the reduction in O-GlcNAc levels
induced by A769662 under PE-treatment (75
± 14% for PE +
A769662 vs. 140
± 60% for PE + A769662 + GlcN, relative to
PE treatment) (Fig.
4
a). This occurred without affecting AMPK
signaling (assessed by measuring ACC phosphorylation, which
is increased 2-fold by A769662 in the presence or absence of
GlcN) (Fig.
4
a). Interestingly, GlcN had no effect on cell size
when incubated alone showing that the increase in O-GlcNAc
levels is not sufficient to induce cardiac hypertrophy by itself
(Fig.
4
b). However, when treated in combination with PE and
A769662, GlcN remarkably blunted the anti-hypertrophic
effect of the AMPK activator (Fig.
4
b). The same applied to
the two other AMPK activators, phenformin and AICAr
demonstrating no dependency to the AMPK activator used
(Fig.
4
b).
GFAT inhibition by AMPK being partial
35, such inhibition
should not fully blunt HBP
flux. In agreement with this
hypothesis, OGA inhibition by PUGNAc was able to increase
O-GlcNAc levels even in the presence of A769662 (78
± 22% for
PE + A769662 vs. 247
± 98% for PE + A769662 + PUGNAc,
relative to PE treatment, p
≤ 0.05, Student’s t-test) (Fig.
4
c).
Supporting data obtained with GlcN, PUGNAc nicely
counter-acted the anti-hypertrophic action of the three AMPK activators
(Fig.
4
d).
Next, we examined whether pharmacological HBP inhibition
can recapitulate AMPK action and block cardiac hypertrophy
development. Strikingly, 6-diazo-5-oxo-norleucine (DON) and
Azaserine (Aza), two GFAT inhibitors known to reduce
O-GlcNAc levels, blunted PE-induced hypertrophy, perfectly
mimicking AMPK activators (Fig.
4
e). GlcN treatment prevented
the anti-hypertrophic action of DON and Aza, indicating that
their anti-hypertrophic actions were clearly related to O-GlcNAc
and that these events played an important role in cardiac
a
pACC PE (20 μM) 0 12.5 25 100 A769662 (μM) – – – – 0 12.5 25 100 + + + + ACC 170 kDa 170 kDa Cardiomyoc yte area ( μ m 2)b
A769662 (μM) 0 200 400 600 800 1000 1200 0 12.5 25 100 * Relative [ 14 C] Phenylal an ine Incorporation 0.0 0.5 1.0 1.5 2.0 2.5 0 12.5 25 100 0 12.5 25 100 * * A769662 (μM)h
NFAT/lucifera se activity 3.0 0.0 0.5 1.0 1.5 2.0 2.5 * * 0 12.5 25 100 A769662 (μM)e
Relative p70S6K (Thr389) phosphorylati o n A769662 (μM) 0 10 20 30 40 50 * # *g
Relative ERK (Thr202/Tyr 2 0 4) phosphorylati o n A769662 (μM) 0 5 10 15 20 * * 0 12.5 25 100d
pp70S6K p70S6K PE (20 μM) 0 12.5 25 100 A769662 (μM) – – – – 0 12.5 25 100 + + + + 72 kDa 72 kDa pERK ERK 43 kDa 43 kDa Control PEf
A769662 (μM) Cardiomyoc yte area (μ m 2) 0 1000 2000 3000 0 12.5 0 12.5 * # A769662 (μM) 0 1000 2000 3000 * * Cardiomyoc yte area (μ m 2) eEF2 AMPKα Untransfected siRNA Non-targeting siRNA AMPK α 1/ α 2 Total AMPK α express ion 0.0 0.5 1.0 1.5 *i
72kDa 95kDa pACC ACC siRNA Non-targeting siRNA AMPK α1/α2 0 Relative ACC (Ser79) phosphorylati o n 2 4 6 8 10 – + – + * $j
A769662 170 kDa 170 kDa siRNA Non-targeting siRNA AMPK α 1/ α 2c
k
l
pAMPK AMPKα 72 kDa 72 kDa C C A C AA PE PE+A PE PE+AA12.5 A25 A100
PE+A25 PE+A100
PE+A12.5 PE
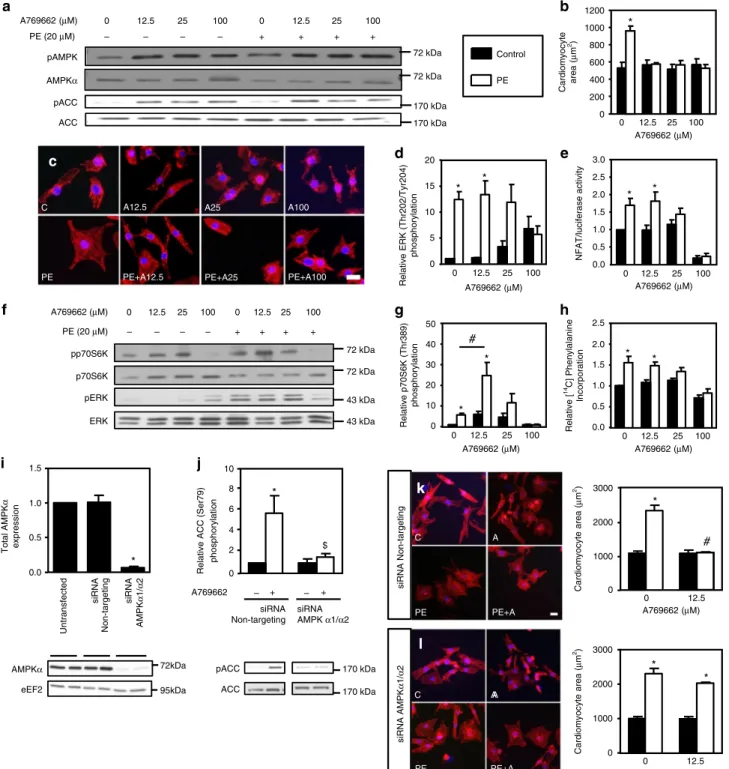
Fig. 1 A769662 prevents NRVM hypertrophy. a–h NRVMs were treated with (open bars) or without (solid bars) phenylephrine (PE, 20 µM) in the presence or absence of increasing concentration of A769662 (from 12.5 to 100µM) for 24 h except for ERK1/2 phosphorylation which has been evaluated after 1 h.a Representative immunoblot of AMPKThr172and ACCSer79phosphorylation.b, c Representative images and quantification of cardiomyocyte area evaluated afterα-actinin immunostaining. Scale bar, 20 µm. N = 3. d Quantification of ERKThr202/Tyr204phosphorylation.N = 3. e Evaluation of NFAT transcriptional activity by luciferase activity.N = 3. f Representative immunoblots of p70S6KThr389and ERKThr202/Tyr204phosphorylation.g Quantification of p70S6KThr389phosphorylation.N = 4. h Amino acids incorporation into proteins measured by [14C]-phenylalanine incorporation.N = 3. i–l NRVMs were transfected with control non-targeting siRNA or AMPKα1/α2 siRNA (50 nM) for 66 h. Then, NRVMs were treated with (open bars) or without (solid bars) phenylephrine (PE, 20μM) in the presence or absence of A769662 (12.5 μM) for 24 h. i Representative immunoblot and quantification of total AMPKα. N = 3. j Representative immunoblot and quantification of ACCSer79phosphorylation.N = 3. k Representative images and quantification of cardiomyocyte area
evaluated afterα-actinin immunostaining of NRVMs transfected with non-targeting siRNA. Scale bar, 20 µm. N = 3. l Representative images and quantification of cardiomyocyte area evaluated after α-actinin immunostaining of NRVMs transfected with AMPKα1/α2 siRNA. Scale bar, 20 µm. N = 3. Data in (a–l) are mean ± s.e.m. The data were analyzed using One-way ANOVA followed by Bonferroni post-test in (i) and Two-way ANOVA followed by Bonferroni post-test in (b, d, e, g, h, and j–l). *p < 0.05 vs. untreated cells,#p < 0.05 vs. corresponding PE-treated cells,$p < 0.05 vs. cells transfected with non-targeting siRNA. eEF2 was used as a loading control
0 500 1000 1500
*
*
Phenformin (mM) Cardiomyocyte area ( μ m 2) pACC ACC PE Phenformin(mM) 170 kDa 170 kDa pERK ERK 43 kDa 43 kDa pp70S6K p70S6K 72 kDa 72 kDa 0.0 0.5 1.0 1.5 2.0*
*
Phenformin (mM) NFAT/luciferase activity 0.0 0.5 1.0 1.5*
*
Relative [ 14 C] phenylalanine incorporation Phenformin (mM) pACC ACC PE 0 0.25 1 AICAr(mM) – – – 0 0.25 1 + + + 170 kDa 170 kDa pERK ERK 43 kDa 43 kDa pp70S6K p70S6K 72 kDa 72 kDa 0 0.06 0.125 0.25 0.5 1 0 500 1000 1500*
*
*
AICAr (mM) Cardiomyocyte area ( μ m 2) 0.0 0.5 1.0 1.5 2.0 AICAr (mM)*
*
Relative [ 14 C] phenylalanine incorporation 1 0 0.25 0 1 0 0.01 0.03 0.1 0.3 1 0 0.03 1 0 0.03 1 – – – + + + 0 0.03 1 0 0.03 1 0.25 0 1 2 3 4 AICAr (mM)*
*
*
NFAT/luciferase activityb
d
e
c
a
f
g
i
j
h
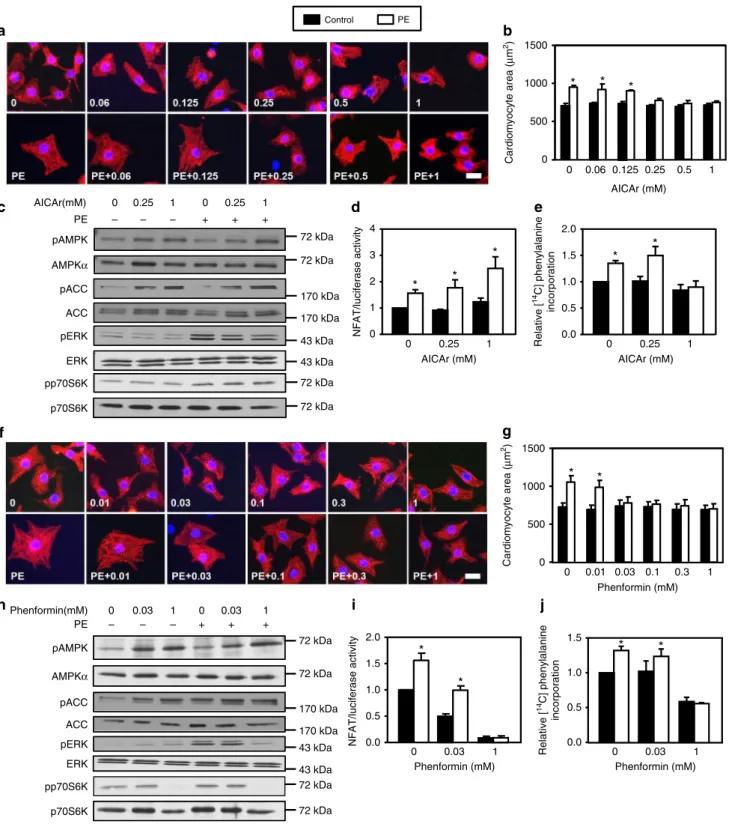
Control PE 72 kDa 72 kDa pAMPK AMPKα pAMPK AMPKα 72 kDa 72 kDaFig. 2 AICAr and phenformin mimick A769662 effects. a–e NRVMs were treated with (open bars) or without (solid bars) phenylephrine (PE, 20 µM) in the presence or not of AICAr (from 0.06 to 1 mM) for 24 h except for ERK1/2 phosphorylation which has been evaluated after 1 h.a, b Representative images and quantification of cardiomyocyte area evaluated after α-actinin immunostaining. Scale bar, 20 µm. N = 3. c Representative immunoblots of AMPKThr172,
ACCSer79, ERKThr202/Tyr204and p70S6KThr389phosphorylation.d Evaluation of NFAT transcriptional activity by luciferase activity.N = 3. e Amino acids incorporation into proteins measured by [14C]-phenylalanine incorporation.N = 5. f–j NRVMs were treated with (open bars) or without (solid bars) phenylephrine (PE, 20µM) in the presence or not of phenformin (from 0.01 to 1 mM) for 24 h except for ERK1/2 phosphorylation which has been evaluated after 1 h.f, g Representative images and quantification of cardiomyocyte area evaluated after α-actinin immunostaining. Scale bar, 20 µm. N = 3. h Representative immunoblots of AMPKThr172, ACCSer79, ERKThr202/Tyr204, and p70S6KThr389phosphorylation.i Evaluation of NFAT transcriptional activity by luciferase activity.N = 3. j Amino acids incorporation into proteins measured by [14C]-phenylalanine incorporation.N = 4. Data in (a–j) are mean ± s.e.
O-GlcNAc Low exposure O-GlcNAc High exposure GAPDH 0 2 4 8 95 55 170 43 PE (h) 37 130 72 55 kDa GFAT 72
b
GAPDH 37 High MW Mid MW 170 130 95 72 55 O-GlcNAc eEF2 95 PE A769662 + + + – + – – –f
Total O-GlcNAc levels 0.0 0.5 1.0 1.5 2.0 2.5
*
#g
Control PE 0 12.5 A769662 (μM) 0.0 0.5 1.0 1.5 2.0 2.5 High MW O-GlcNAch
*
# 0 12.5 A769662 (μM) 0.0 0.5 1.0 1.5 2.0 2.5 Mid MW O-GlcNAc ii
*
# 0 12.5 A769662 (μM) Relative GFAT(Ser24 3 ) phosphorylati on Controls A769662 pGFAT GFAT 72 kDa 72 kDa 0 1 2 3 4*
j
kDa GlcN DON Azaserinea
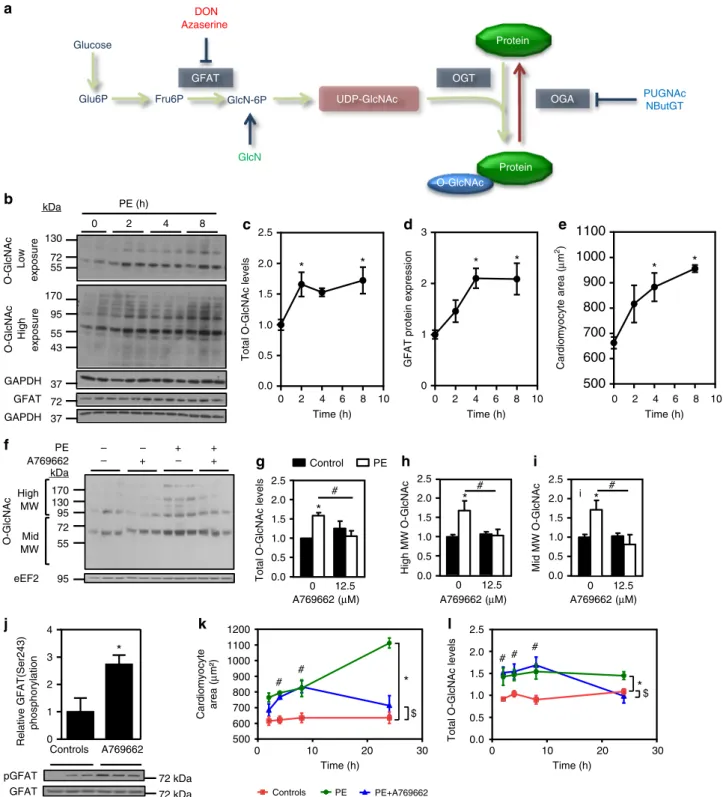
OGT OGA GFAT GlcN-6P UDP-GlcNAc Fru6P Glu6P Glucose Protein Protein O-GlcNAc PUGNAc NButGT 0 2 4 6 8 10 0.0 0.5 1.0 1.5 2.0 2.5 Time (h) Total O-GlcNAc levels*
*
0 2 4 6 8 10 0 1 2 3 Time (h)*
*
0 2 4 6 8 10500
600
700
800
900
1000
1100
Time (h)*
*
GFAT protein expressi
on Cardiomyocyte area (μ m 2)
c
d
e
Controls PE PE+A769662 0 10 20 30 500 600 700 800 900 1000 1100 1200 Time (h) #*
# $ Cardiomyocyte area ( μ m²)k
l
0 10 20 30 0.0 0.5 1.0 1.5 2.0 2.5 Time (h) # # #*
$ Total O-GlcNAc levelsFig. 3 AMPK activation reduces protein O-GlcNAcylation. a Schematic representation of the HBP/O-GlcNAcylation pathway. b–e NRVMs were treated with phenylephrine (PE, 20µM) for increasing time periods (from 2 to 8 h). b Representative immunoblots of protein O-GlcNAcylation levels and GFAT protein expression.c Quantification of protein O-GlcNAcylation levels. N = 5. d Quantification of GFAT protein expression. N = 5. e Quantification of cardiomyocyte area evaluated afterα-actinin immunostaining. N = 3. f–i NRVMs were treated with (open bars) or without (solid bars) phenylephrine (PE, 20µM) in the presence or not of A769662 (12.5 µM) for 24 h. Representative immunoblot and quantification of protein O-GlcNAcylation levels. N = 3. j Representative immunoblot and quantification of GFATSer243phosphorylation in NRVMs treated 1 h with A769662.N = 3. k–l NRVMs were treated with phenylephrine (PE, 20µM) in the presence or absence of A769662 (12.5 µM) for increasing time periods (from 2 to 24 h). k Quantification of cardiomyocyte area evaluated afterα-actinin immunostaining. N = 3–6. l Quantification of protein O-GlcNAcylation levels. N = 5–7. Data in (c–l) are mean ± s.e.m. The data were analyzed using Two-way ANOVA followed by Bonferroni test in (g–i) and (k, l), One-way Anova followed by Bonferroni post-test in (c–e) and unpaired Student’s t-test in (j). *p < 0.05 vs. untreated cells,#p < 0.05 vs. PE-treated cells for (c–e and j. *p < 0.05 global effect of PE vs.
controls,$p < 0.05 global effect of PE + A vs. controls and#p < 0.05 PE + A vs. controls at each time point for (k, l). GAPDH and eEF2 were used as loading control, MW molecular weight
NRVMs were maintained and tested in the presence of high
glucose (25 mM). Because O-GlcNAc levels are known to be
dependent of extracellular glucose concentration
36, the same
experiments were conducted on NRVMs incubated in the
presence of 5 mM glucose (Supplementary Fig.
5
a, b). The
anti-hypertrophic action of A769662 was equally abolished by
PUGNAc and GlcN, ruling out any unspecific effects due to
particular glucose availability in medium.
Similarly, we evaluated the effect of A769662 on hypertrophied
adult rat ventricular myocytes (ARVMs) in the presence of 5 mM
glucose (Supplementary Fig.
6
a-d). As described previously
37,
treatment of ARVMs with 100
µM PE induced 15% hypertrophy
and this was totally blunted by low-dose of A769662
(Supple-mentary Fig.
6
a, b). This was associated with a decrease in
GlcNAcylation, and PUGNAc reversed A769662’s effects on
O-GlcNAc levels and ARVM size (Supplementary Fig.
6
a-d).
Taken altogether, these results in cultured cardiomyocytes
provide strong evidence that AMPK inhibits hypertrophy by
targeting GFAT and lowering O-GlcNAcylation induced by
pro-hypertrophic agents. Conversely, increased HBP/O-GlcNAc
signaling is sufficient to counteract the anti-hypertrophic action
of AMPK activators.
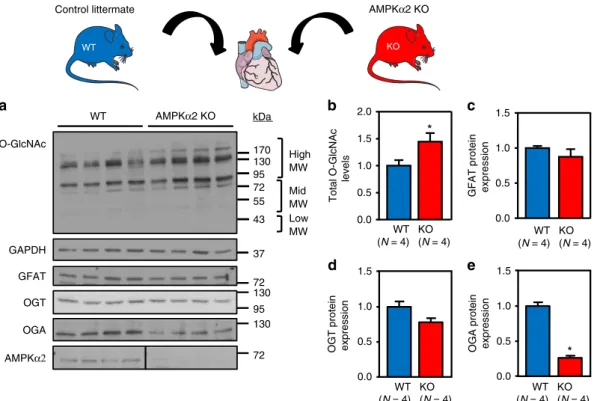
O-GlcNAc inhibition by AMPK blocks hypertrophy in vivo.
Our hypothesis was also tested in vivo. First, we took advantage of
mice deficient in AMPKα2 (AMPKα2 KO), the main isoform of
the AMPK catalytic subunit expressed in the heart, to evaluate the
impact of AMPK deletion on basal cardiac O-GlcNAc levels
(Fig.
5
a-e and Supplementary Fig.
7
). Even though AMPKα2 KO
mice have been shown to possess a normal basal cardiac
phenotype
29, 38, O-GlcNAc levels were significantly elevated in
the hearts of these mice compared to their wild type (WT) control
littermates (Fig.
5
a, b and Supplementary Fig.
7
) and this was
associated with a decreased in OGA protein level whereas GFAT
and OGT expression was unchanged (Fig.
5
c–e). Similar to the
0 500 1000 1500 2000 Cardiomyoc yte area (μ m 2)
Control A769662 Phen AICAR
b
*
*
*
*
*
GlcN Control PE PE GlcN PE+GlcN GlcN pACC PE A769662 + + – – + + + + + + – – – + + + + – – – – – – – O-GlcNAc eEF2 170 130 95 72 55 kDa 170 95a
ACC 170 Cardiomyoc yte area (μ m 2) 0 500 1000 1500 2000 Control A769662*
*
*
Phen*
AICAR*
PUGNAcd
Control PUGNAc PE+PUGNAcControl GlcN Aza Aza
+GlcN DON DON +GlcN 0 500 1000 1500 2000 Cardiomyoc yte area (μ m 2)
*
*
*
*
e
170 130 95 72 55 kDa 43 95 O-GlcNAc pACC eEF2 170 ACC 170 PUGNAc PE A769662 + + + + + + + + – – – – + + + + – – – – – – – –c
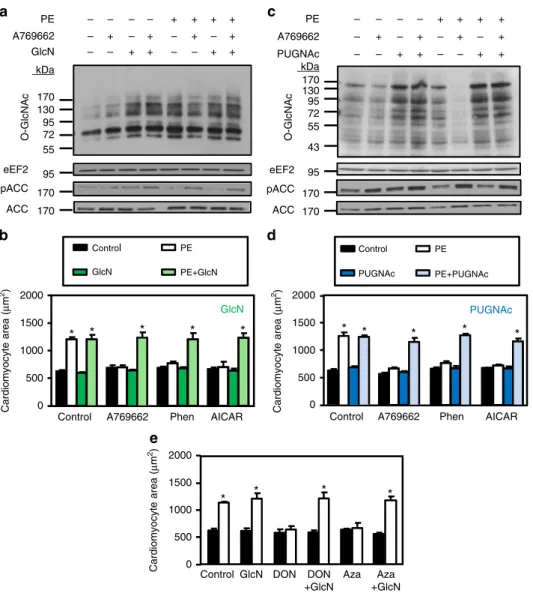
Fig. 4 Glucosamine or PUGNAc prevents the anti-hypertrophic action of AMPK. a–d NRVMs were treated with (open bars) or without (solid bars) phenylephrine (PE, 20µM) in the presence or absence of A769662 (12.5 µM), phenformin (phen, 0.03 mM), AICAr (0.25 mM), PUGNAc (50 µM) and/or glucosamine (GlcN, 5 mM) for 24 h.a Representative immunoblot of protein O-GlcNAcylation levels and ACCSer79phosphorylation in GlcN experiments.b
Effect of GlcN on the anti-hypertrophic action of AMPK activators.N = 3. c Representative immunoblot of protein O-GlcNAcylation levels and ACCSer79 phosphorylation in PUGNAc experiments.d Effect of PUGNAc on the anti-hypertrophic action of AMPK activators.N = 3. e Quantification of
cardiomyocyte area of NRVMs treated with (open bars) or without (solid bars) phenylephrine (PE, 20µM) in the presence or not of Azaserine (Aza, 5 µM), DON (20µM) and/or glucosamine (GlcN, 5 mM) for 24 h. N = 3. Data in (b, d and e) are mean ± s.e.m. The data were analyzed using Two-way ANOVA followed by Bonferroni post-test in (b, d and e). *p < 0.05 vs. untreated cells. eEF2 was used as loading control, MW molecular weight
data obtained in cultured cells with GlcN or PUGNAc alone,
these data reveal that an increase in basal O-GlcNAc levels
induced by AMPK deletion are not sufficient to induce cardiac
hypertrophy per se.
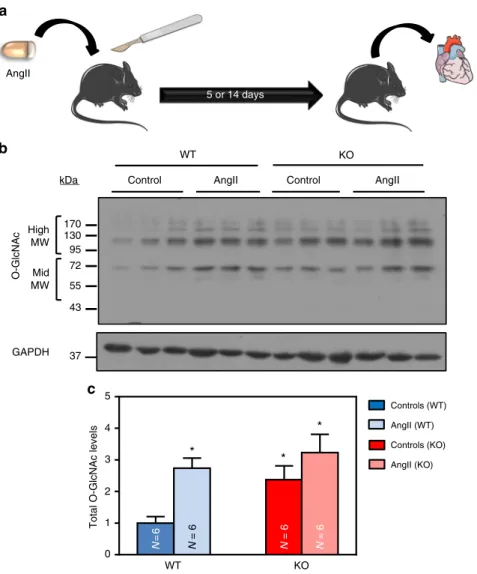
Next, we subjected WT and AMPKα2 KO mice to continuous
infusion of AngII, a pro-hypertrophic treatment frequently used
39(Fig.
6
a). In agreement with data obtained with other
pro-hypertrophic treatments
29, 38, AngII promoted left ventricular
(LV) hypertrophy in both mouse strains (Supplementary Table
1
).
More importantly, cardiac O-GlcNAc levels were significantly
augmented in WT animals after 5 days of AngII treatment
compared to the untreated controls (Fig.
6
b, c and Supplementary
Fig.
7
). These results are in agreement with our in vitro data
obtained in NRVMs/ARVMs and concur similarly to what has
been reported by Lunde and colleagues in other models of cardiac
hypertrophy
22. Conversely, O-GlcNAc levels in AMPKα2 KO
hearts, which were already elevated under basal conditions, were
unchanged upon AngII treatment (Fig.
6
b, c and Supplementary
Fig.
7
), suggesting that AMPK deletion promotes global
O-GlcNAc modifications that are very similar to those induced by
pro-hypertrophic agents.
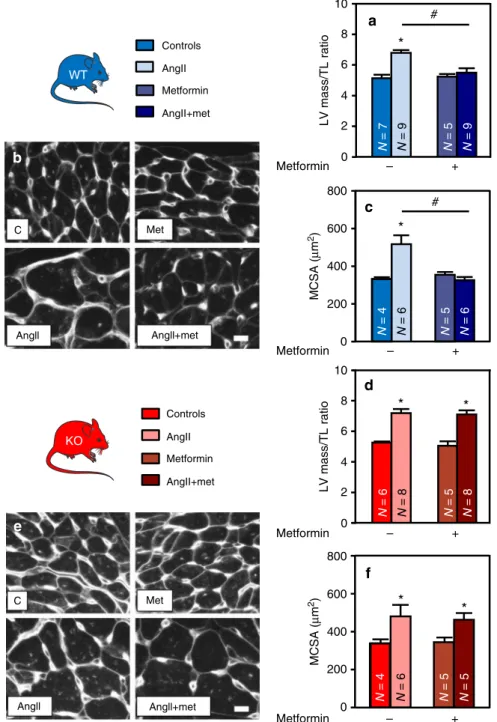
To evaluate the impact of AMPK activation on those
phenomena, both WT and KO mice, treated or not with AngII,
were co-treated with metformin. In contrast to A769662,
characterized by poor oral bioavailability
24, metformin is a more
efficient cardiac AMPK activator in vivo
40, 41. As expected,
metformin efficiently increased AMPK signaling (followed by
ACC phosphorylation) in WT but not in AMPKα2 KO hearts
(Supplementary Fig.
8
). It also inhibited the AngII-induced
increase in LV mass and cardiomyocyte size of WT animals
(Fig.
7
a–c and Supplementary Table
1
) without any significant
effect on systolic blood pressure (129
± 2, 149 ± 10 and 162 ± 8
mmHg for control, AngII and AngII + metformin, respectively).
Absence of those anti-hypertrophic effects in AMPKα2 KO hearts
demonstrate an AMPK dependency of the metformin action
(Fig.
7
d-f and Supplementary Table
1
).
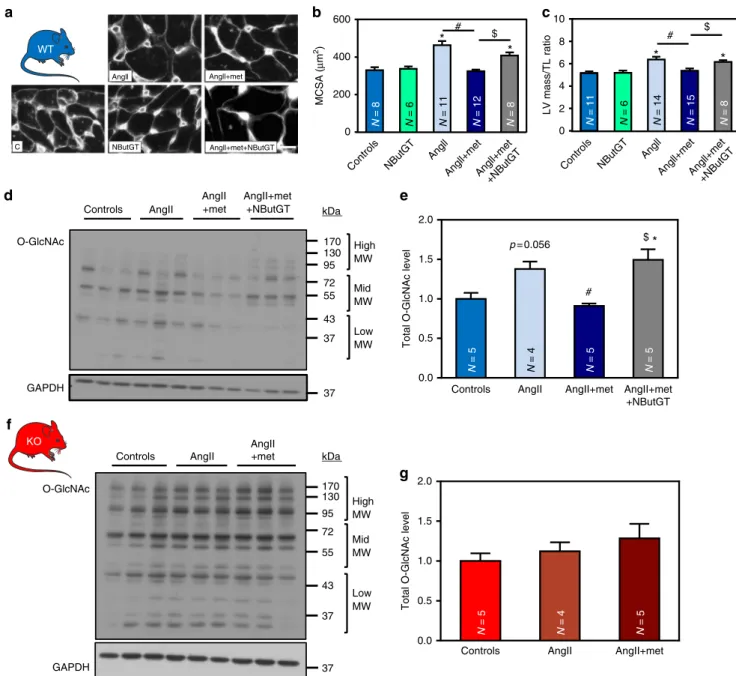
The next step was to confirm the role of O-GlcNAcylation in
the anti-hypertrophic action of AMPK in vivo (Fig.
8
a–g). In line
with in vitro data, the anti-hypertrophic effect of metformin in
WT mice was associated with a reduction of cardiac O-GlcNAc
levels (Fig.
8
d, e and Supplementary Fig.
7
). In contrast,
O-GlcNAc levels were not affected by metformin treatment in hearts
from AMPKα2 KO animals confirming the role of AMPK in
metformin effect on O-GlcNAcylation regulation (Fig.
8
f, g and
Supplementary Fig.
7
). To further substantiate that AMPK
primarily regulates cardiac hypertrophy by modulating
O-GlcNAcylation, a group of WT mice were co-treated with
1,2-dideoxy-2′-propyl-alpha-d-glucopyranoso-[2,1-D]-Delta
2′-thia-zoline (NButGT), an OGA inhibitor compatible with chronic
utilization in vivo. We
first confirmed that intraperitoneal
injection of this compound promoted cardiac protein
O-GlcNAcylation (Supplementary Fig.
9
). Like for GlcN or
PUGNAc in vitro, NButGT alone did not induce cardiac
hypertrophy development (Fig.
8
a–c) providing robust evidence
that an increase in global O-GlcNAcylation is not sufficient to
promote cardiac hypertrophy without pro-hypertrophic
co-treatment. More importantly, NButGT reduced the impact of
metformin on protein O-GlcNAcylation levels (Fig.
8
d, e and
Supplementary Fig.
7
) and prevented its anti-hypertrophic effect
in the presence of AngII (Fig.
8
a–c), confirming the central role of
O-GlcNAcylation in the anti-hypertrophic action of AMPK.
Similar studies were conducted in a model of cardiac
hypertrophy induced after TAC surgery. This TAC-induced
model of cardiac hypertrophy has been previously characterized
in terms of LV mass and function
42. Three weeks of TAC induced
a significant increase in cardiomyocyte size in WT mice
(Supplementary Fig.
10
a, b). Like for AngII studies, metformin
significantly
reduced
this
TAC-mediated
increase
in
a
Control littermate AMPKα2 KO
0.0 0.5 1.0 1.5
d
OGT protein express
ion 0.0 0.5 1.0 1.5
*
e
OGA protein express
ion WT KO 170 130 95 72 55 43 kDa High MW Mid MW Low MW O-GlcNAc OGT OGA AMPKα2 GAPDH WT AMPKα2 KO 130 95 130 72 0.0 0.5 1.0 1.5
GFAT protein express
ion GFAT 72
c
37 WT (N = 4) KO (N = 4) WT (N = 4) KO (N = 4) WT (N = 4) KO (N = 4) 0.0 0.5 1.0 1.5 2.0*
Total O-GlcNAc levelsb
WT (N = 4) KO (N = 4)Fig. 5 O-GlcNAc levels are increased in AMPKα2 KO mice. a–e Representative immunoblot and quantification of protein O-GlcNAcylation levels (b), GFAT (c), OGT (d), OGA (e) and AMPKα2 expression in AMPKα2 KO mice compared to control littermates (WT). N = 4. Data in b–e are expressed as mean ± s. e.m. The data were analyzed using unpaired Student’s t-test. *p < 0.05 vs. WT. GAPDH was used as loading control, MW molecular weight
cardiomyocyte size in WT mice and NButGT counteracted
metformin action (Supplementary Fig.
10
a, b). In contrast,
cardiomyocyte size was not affected by metformin in KO mice
(Supplementary Fig.
10
c, d). So, the interplay between AMPK and
O-GlcNAc signaling in cardiac hypertrophy prevention could be
seen not only in hormonal model of cardiac hypertrophy, but also
in pressure induced-cardiac hypertrophy.
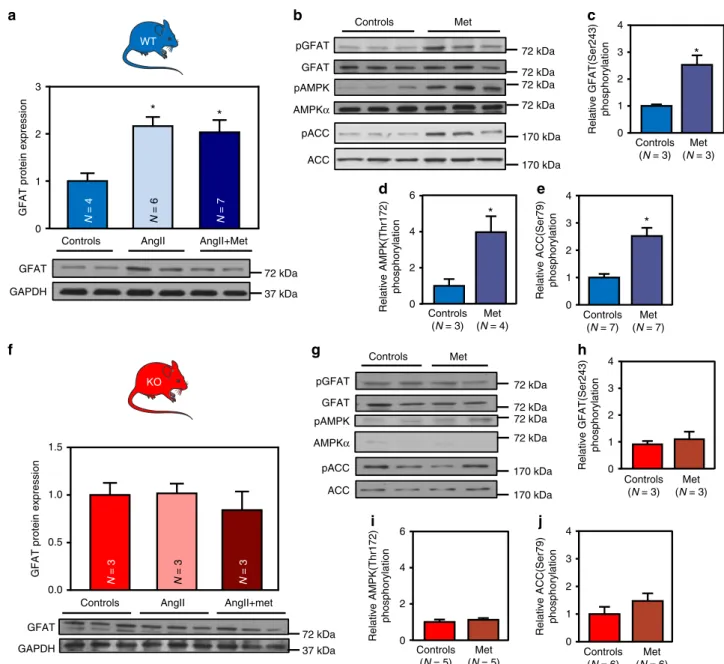
AMPK decreases O-GlcNAcylation in vivo via GFAT and OGT.
Similarly to what we observed in vitro, it has already been shown
that O-GlcNAcylation occurring during cardiac hypertrophy
correlated with an increase in GFAT protein level
22, 43. We
confirm these data in our AngII model (Fig.
9
a). As observed
in vitro using A769662, metformin did not reverse this increase in
GFAT expression (Fig.
9
a) but promoted its phosphorylation on
its inhibitory Ser243 site in an AMPK-dependent manner
(Fig.
9
b–e), as this increase in phosphorylation disappeared in
AMPKα2 KO mouse hearts (Fig.
9
f–j). Even if GFAT regulation
appears as a critical piece of the puzzle in regulation of
O-GlcNAcylation by AMPK, our in vivo study highlighted another
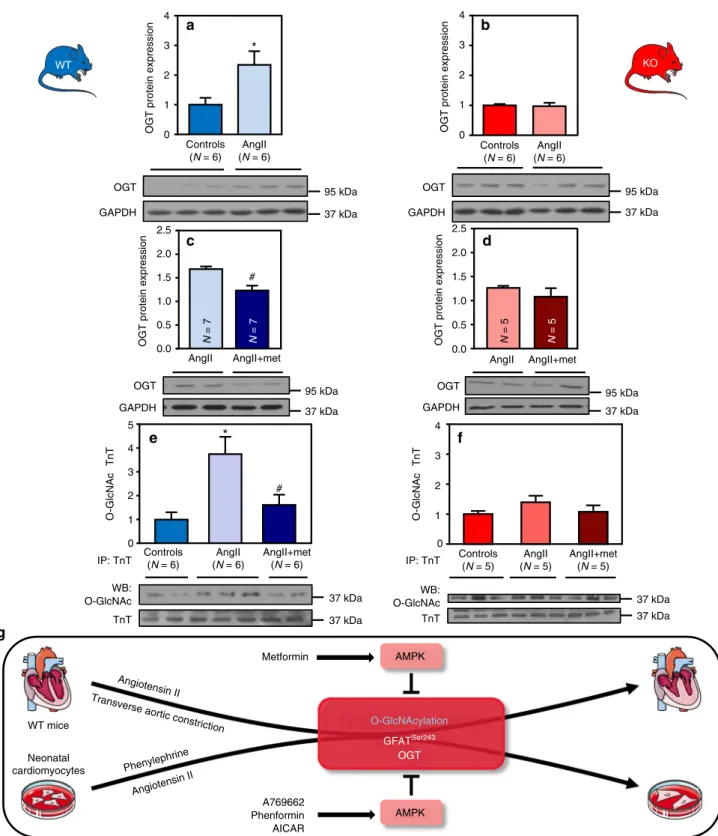
enzyme involved in the interaction between HBP and AMPK.
Indeed, AngII-mediated increase in O-GlcNAcylation was also
associated with elevation of OGT protein level in WT but not
AMPKα2 KO hearts (Fig.
10
a). Metformin reduced this increase
in OGT protein level in WT mice (Fig.
10
c) but not in AMPKα2
KO hearts (Fig.
10
b, d). By contrast, OGA expression was
unal-tered by AngII and metformin (Supplementary Fig.
11
).
AMPK activation prevents the O-GlcNAcylation of troponin T.
The exact role of O-GlcNAcylation in cardiac hypertrophy
development is still largely unclear. However, growing evidences
in the literature show that important players of cardiac
hyper-trophy are potentially O-GlcNAcylable
18. For this reason, we
evaluated the O-GlcNAcylation level of troponin T (TnT) for
which increased O-GlcNAcylation was associated with
develop-ment of adverse cardiac remodeling
44. Interestingly,
O-GlcNAcylation level of TnT was increased by AngII whereas
metformin treatment prevented this increase in WT mice
(Fig.
10
e). This metformin-mediated inhibition of TnT
O-GlcNAcylation disappeared in AMPKα2 KO mouse hearts
AngII 5 or 14 daysa
O-GlcNAc Control AngII GAPDH Control AngII WT KO 170 130 95 72 55 43 37 High MW Mid MWb
kDa Controls (WT) AngII (WT) Controls (KO) AngII (KO) N =6 N = 6 N = 6 N = 6 WT KO 0 1 2 3 4 5Total O-GlcNAc levels
*
*
*
c
Fig. 6 AngII treatment increases O-GlcNAc levels in the presence of AMPK. WT (in blue) and AMPKα2 KO (in red) mice were treated with or without angiotensin II (AngII, 2 mg/kg/d) for 5 days in order to evaluate O-GlcNAcylated protein levels.a Schematic representation of the experimental protocol where mice were treated for 5 or 14 days in order to evaluate O-GlcNAcylated protein levels or cardiac hypertrophy respectively.b Representative immunoblot of protein O-GlcNAcylation levels in WT and AMPKα2 KO mouse hearts. c Quantification of protein O-GlcNAcylation levels in WT and AMPKα2 KO mouse hearts. N = 6. Data in c are expressed as mean ± s.e.m and were analyzed using Two-way ANOVA followed by Bonferroni post-test. *p < 0.05 vs. untreated WT mice. GAPDH is used as loading control, MW molecular weight
(Fig.
10
f), proving that TnT is one of the indirect downstream
targets of AMPK in this process.
Discussion
The major
findings of this study are that: (i) AMPK activation
by A769662 blocks cardiac hypertrophy development; (ii) three
different AMPK activators, used at low concentrations,
con-sistently inhibit cardiomyocyte hypertrophy without detectable
changes of downstream targets previously suggested to
partici-pate in this phenomenon; (iii) increase in protein
O-GlcNAcylation is required for cardiomyocyte hypertrophy
in vitro; (iv) inhibition of cardiac hypertrophy by AMPK is
tightly associated with reduction of increased O-GlcNAcylation
in vitro as well as in vivo; (v) such association disappeared in
AMPK-deficient mouse model; (vi) counteracting inhibition of
O-GlcNAcylation abolished AMPK’s anti-hypertrophic action
in WT cellular and animal models of cardiac hypertrophy.
Altogether, our results establish a new concept in which AMPK
blocks cardiac hypertrophy by predominantly modulating
O-GlcNAcylation (summarized in Fig.
10
g).
0 200 400 600 800 N = 4 N = 5 N = 6 N = 6
*
#c
MCSA ( μ m 2) 0 200 400 600 800 MCSA ( μ m 2)f
Controls AngII N = 7 N = 5 N = 9 N = 9 0 2 4 6 8 10*
# LV mass/TL ratioa
N = 4 N = 5 N = 6 N = 5*
*
N = 6 N = 5 N = 8 N = 8 0 2 4 6 8 10*
*
LV mass/TL ratiod
Metformin AngII+met Controls AngII Metformin AngII+met – + Metformin – + Metformin – + Metformin – + Metformin WT KOb
e
C Met Angll+met Angll C Met Angll+met AngllFig. 7 Metformin prevents cardiac hypertrophy in an AMPK-dependent manner. a–f WT (in blue) and AMPKα2 KO (in red) mice were treated with or without angiotensin II (AngII, 2 mg/kg/d) in the presence or absence of metformin (met, 200 mg/kg/d) for 14 days in order to evaluate cardiac hypertrophy.a Left ventricular (LV) mass on tibia length (TL) ratio in WT mice.N = 5–9 b–c Representative images and quantification of myocyte cross sectional area evaluated after WGA staining in WT mouse hearts. Scale bar, 10µm. N = 4–6 d LV mass on TL ratio in AMPKα2 KO mice. N = 5–8 e–f Representative images and quantification of myocyte cross sectional area evaluated after WGA staining in AMPKα2 KO mouse hearts. Scale bar, 10 µm. N = 4–6. Data in (a, c, d, and f) are expressed as mean ± s.e.m. and were analyzed using Two-way ANOVA followed by Bonferroni post-test. *p < 0.05 vs. untreated mice,#p < 0.05 vs. AngII-treated mice
Pharmacological agents previously known to prevent
PE-induced cardiomyocyte hypertrophy, such as AICAr or the
biguanide metformin
11,12, act as AMP analogs or increase AMP
concentration through inhibition of mitochondrial respiration,
and, thus, are not specific to AMPK
45. Our study was initially
conducted to investigate the anti-hypertrophic action of the more
specific AMPK activator A769662. Here, we show that this
compound
successfully
blocks
cardiomyocyte
hypertrophy
induced by PE or AngII. It is interesting to note that A769662
does not equally bind all AMPK heterotrimers but rather
pre-ferentially activates cardiac AMPK heterotrimeric complexes
containing
β1 subunit
46. In other words, the activation of these
β1-containing AMPK heterotrimers is probably sufficient to block
hypertrophy. This should be considered in conjunction with our
in vivo data but also previous studies
13, 15, demonstrating that
deletion of the AMPKα2 catalytic isoform is sufficient to prevent
hypertrophy inhibition induced by AMPK activators. Inasmuch
as we also recently reported that AMPKα2 binds preferentially to
AMPKβ1 in cardiomyocytes
26, this makes AMPKα2/β1 pivotal
target to reduce cardiac hypertrophy.
More importantly, our dose-response studies using A769662,
but also phenformin and AICAr, allowed us to establish a novel
concept (Fig.
10
g). We showed that these three AMPK activators
prevent NRVM hypertrophy without affecting
previously-proposed AMPK targets, including p70S6K, NFAT, and ERK.
We conclude from these in vitro data that these major
pro-hypertrophic pathways are required but not sufficient to induce
cardiomyocyte hypertrophy. In other words, other
pro-a
N = 11 N = 6 N = 14 N = 15 N = 8 0 2 4 6 8 10*
*
LV mass/TL ratioc
$ # N = 8 N = 6 N = 11 N = 12 N = 8 0 200 Controls NButGT Angll Angll+metAngll+met +NButGT Controls NButGT Angll Angll+metAngll+met +NButGT 400 600*
*
# $ MCSA ( μ m 2)b
O-GlcNAc GAPDH High MW Mid MW Low MW AngIId
170 130 95 72 55 43 kDa High MW Mid MW Low MW GAPDH O-GlcNAc AngII +met AngIIf
KO 37 Controls 170 130 95 72 55 43 37 37 Controls AngII +met AngII+met +NButGT kDa WT 37 N = 5 N = 4 N = 5Controls AngII AngII+met
0.0 0.5 1.0 1.5 2.0 Total O-GlcNAc level
g
p = 0.056 N = 5 N = 4 N = 5 N = 5Controls AngII AngII+met AngII+met
+NButGT 0.0 0.5 1.0 1.5 2.0 $ # Total O-GlcNAc level
*
e
Angll Angll+met Angll+met+NButGT NButGT CFig. 8 NButGT prevents the anti-hypertrophic effect of metformin. a–g WT (in blue) and AMPKα2 KO (in red) mice were treated with or without angiotensin II (AngII, 2 mg/kg/d) in the presence or absence of metformin (met, 200 mg/kg/d). Two groups of WT mice also received NButGT (50 mg/ kg/d).a, b Representative images and quantification of myocyte cross sectional area after WGA staining in WT mouse heart. Scale bar, 10 µm. N = 6–12 (c) Left ventricular (LV) mass on tibia length (TL) ratio in WT mice.N = 6–15 d, e Representative immunoblot and quantification of total O-GlcNAc levels in WT mouse hearts.N = 4–5 f, g Representative immunoblot and quantification of total O-GlcNAc levels in AMPKα2 KO mouse hearts. N = 4–5. Data in (b, c, e, and g) are expressed as mean± s.e.m. and were analyzed using One-way ANOVA followed by Bonferroni post-test. *p < 0.05 vs. untreated mice,#p < 0.05 vs. AngII-treated mice,$p < 0.05 vs. AngII + met-treated mice. GAPDH was used as loading control, MW molecular weight
hypertrophic mechanisms co-exist, are equally important and
should be targeted by AMPK activators at low concentration. In
our quest to
find this missing link, our attention was drawn to
O-GlcNAcylation process. O-O-GlcNAcylation was
first mentioned in
the context of cardiac hypertrophy by Young and colleagues
43and this has been confirmed by several other groups
22,23,47,48.
However, its exact role remains largely unclear. Interestingly,
several important players of cardiac hypertrophy including
pro-teins involved in autophagy, in atrogenic pathway, in calcium
handling, in endoplasmic/sarcoplasmic reticulum stress and in
contractile machinery have been discovered to be potentially
O-GlcNAcylated in the heart under particular pathophysiological
contexts
18, 49, 50. Here, we demonstrate that protein
O-GlcNAcylation is promoted by pro-hypertrophic treatments in
both NRVMs and ARVMs as well as in the heart in vivo.
Moreover, it appears from our data that O-GlcNAcylation
ele-vation is not just a marker of cardiac hypertrophy but could also
be considered as a prerequisite for this pathological process. First,
O-GlcNAcylation occurs early in the hypertrophic process
(within 2 h of pro-hypertrophic treatment in our in vitro NRVM
model and within the
first 5 days of in vivo treatment in
AngII-treated mice). Second, O-GlcNAc levels perfectly correlate to
Controls (N = 3) Met (N = 4) 0 2 4 6*
Relative AMPK(Thr172) phosphorylati o nd
Controls (N = 3) Met (N = 3) 0 1 2 3 4 Relative GFAT(Ser24 3) phosphorylati o nh
Controls (N = 5) Met (N = 5) 0 2 4 6 Relative AMPK(Thr172) phosphorylati o ni
Controls (N = 3) Met (N = 3) 0 1 2 3 4 Relative GFAT(Ser24 3) phosphorylati on*
c
pAMPK AMPKα pGFAT GFAT 72 kDa 72 kDa 72 kDa 72 kDa 72 kDa 72 kDa 72 kDa 72 kDa GFAT AngII AngII+Met Controls GAPDH 72 kDa 37 kDa N = 4 N = 6 N = 7 0 1 2 3*
*
GFAT protein expressi ona
N = 3 N = 3 N = 3Controls AngII AngII+met
0.0 0.5 1.0 1.5 GFAT protein expressi o n pGFAT GFAT pAMPK AMPKα GFAT GAPDH 72 kDa 37 kDa Controls Met Controls Met
f
WT KOb
g
pACC ACC 170 kDa 170 kDa pACC ACC 170 kDa 170 kDa Controls (N = 7) Met (N = 7) 0 1 2 3 4*
Relative ACC(Ser79) phosphorylati one
Controls (N = 6) Met (N = 6) 0 1 2 3 4 Relative ACC(Ser79) phosphorylati onj
Fig. 9 AMPK activation promotes GFAT phosphorylation in vivo. a–j WT (in blue) and AMPKα2 KO (in red) mice were treated with or without angiotensin II (AngII, 2 mg/kg/d) in the presence or absence of metformin (met, 200 mg/kg/d).a Representative immunoblot and quantification of GFAT protein expression in WT mouse hearts.N = 4–7 b Representative immunoblots of GFATSer243, AMPKThr172, and ACCSer79phosphorylation in WT mouse hearts.c Quantification of GFATSer243phosphorylation in WT mouse hearts.N = 3 d Quantification of AMPKThr172phosphorylation in WT mouse hearts.N = 3–4 e Quantification of ACCSer79phosphorylation in WT mouse hearts.N = 7 f Representative immunoblot and quantification of GFAT protein expression in AMPKα2 KO mouse hearts. N = 3 g Representative immunoblots of GFATSer243, AMPKThr172, and ACCSer79phosphorylation in AMPKα2 KO mouse
hearts.h Quantification of GFATSer243phosphorylation in AMPKα2 KO mouse hearts. N = 3 i Quantification of AMPKThr172phosphorylation in AMPKα2 KO mouse hearts.N = 5 j Quantification of ACCSer79phosphorylation in AMPKα2 KO mouse hearts. N = 6. Data in (a–j) are expressed as mean ± s.e.m. The data were analyzed using One-way ANOVA followed by Bonferroni post-test in (a, f) and unpaired Student’s t-test in (c–e and h–j). *p < 0.05 vs. untreated mice. GAPDH was used as loading control
95 kDa 37 kDa 95 kDa 37 kDa AngII AngII+met 0.0 AngII AngII+met 0.0 N = 7 N = 7 0.5 1.0 1.5 2.0 2.5 #
OGT protein expression N = 5 N
= 5 0.5 1.0 1.5 2.0 2.5
OGT protein expression
c
d
OGT GAPDH 95 kDa 37 kDaa
OGT GAPDH OGT GAPDH TnT WB: O-GlcNAc 37 kDa 37 kDa Controls (N = 6) AngII (N = 6) AngII+met (N = 6) IP: TnT Controls (N = 5) AngII (N = 5) AngII+met (N = 5) 0 0 1 2 3 4 5*
# O-GlcNAc TnTe
1 2 3 4 O -GlcNAc TnTf
37 kDa 37 kDa TnT WB: O-GlcNAc IP: TnT WT KO AMPK AMPK Metformin Phenylephrine Angiotensin II Angiotensin IITransverse aortic constriction
A769662 Phenformin AICAR
g
Neonatal cardiomyocytes WT mice O-GlcNAcylation GFATSer243 OGT Controls (N = 6) AngII (N = 6) 0 1 2 3 4*
OGT protein expression
OGT GAPDH 95 kDa 37 kDa Controls (N = 6) AngII (N = 6) 0 1 2 3 4
OGT protein expression
b
Fig. 10 AMPK activation regulates OGT expression and troponin T O-GlcNAc level. a, b WT (in blue) and AMPKα2 KO (in red) mice were treated with or without Angiotensin II (AngII, 2 mg/kg/d) for 5 days.a Representative immunoblot and quantification of OGT protein expression in WT mouse hearts. N = 6 b Representative immunoblot and quantification of OGT protein expression in AMPKα2 KO mouse hearts. N = 6 c, d WT (in blue) and AMPKα2 KO (in red) mice were treated with or without Angiotensin II (AngII, 2 mg/kg/d) in the presence or absence of metformin (met, 200 mg/kg/d) for 5 days.c Representative immunoblot and quantification of OGT protein expression in WT mouse hearts. N = 7 d Representative immunoblot and quantification of OGT protein expression in AMPKα2 KO mouse hearts. N = 5 e Representative immunoblot and quantification of O-GlcNAcylated troponin T (TnT) in WT mouse hearts.N = 6 f Representative immunoblot and quantification of O-GlcNAcylated TnT in AMPKα2 KO mouse hearts. N = 5 g Schematic model of the proposed interplay in the regulation of cardiac hypertrophy by O-GlcNAcylation and AMPK. Data in (a–f) are expressed as mean ± s.e.m. The data were analyzed using One-way ANOVA followed by Bonferroni post-test in (e, f) and unpaired Student’s t-test in (a–d). *p < 0.05 vs. untreated mice,#p < 0.05 vs. AngII-treated mice. GAPDH was used as a loading control
cardiomyocyte size in all our experiments. Third, preventing this
increase in O-GlcNAcylation by inhibiting GFAT via the use of
DON or Aza is sufficient to block NRVM hypertrophy. In
agreement, it has been shown that GFAT inhibition by DON
prevents PE-induced hypertrophic markers to progress in
NRVMs
23. In contrast to these in vitro data, it has to be
men-tioned that a very recent study performed by the same research
group and using inducible/cardio-specific OGT-deficient mice
submitted to TAC surgery revealed that OGT does not appear to
be essential for cardiac hypertrophy development
20. However, the
inducible animal model used in this study, the classical
α-MHC-driven mutated estrogen receptor-flanked Cre recombinase,
allowed only partial OGT deletion
20. It is tempting to hypothesize
that such partial deletion is not sufficient to have a significant
impact on hypertrophy development. Nevertheless, further
stu-dies will be necessary to reach a definitive conclusion regarding
this issue.
Even if required, at least in vitro, O-GlcNAcylation is not
sufficient to promote hypertrophy per se. Indeed, GlcN, PUGNAc
(in vitro) and NButGT (in vivo) are unable to induce hypertrophy
in the absence of pro-hypertrophic agents. The same applies for
AMPKα2 KO mice, which are characterized by increased levels of
O-GlcNAc under basal state without any significant effect on
heart size under basal conditions. This highly suggests that
O-GlcNAcylation must be combined with other molecular events,
such as the increase in protein synthesis and modifications in
gene transcription to promote cardiac hypertrophy.
Beyond and above all other consideration, the most significant
findings of our study reside in two other observations. First,
AMPK activation (regardless of the activator used) reverses the
increase in protein O-GlcNAcylation occurring during cardiac
hypertrophy development in all in vitro and in vivo models
investigated so far. Second, counteracting this AMPK-mediated
inhibition of O-GlcNAcylation with GlcN and/or OGA inhibitors
(PUGNAc and NButGT) totally neutralizes the anti-hypertrophic
effect of this protein kinase in vitro as well as in vivo. As far as we
know, this is the
first proof of a crucial role of O-GlcNAcylation
downstream of AMPK in its action against cardiac hypertrophy
development. Our study is supported by evidence of crosstalk
between O-GlcNAc and AMPK in different cell types, including
myotubes, adipocytes, hepatocytes, neuronal, and endothelial
cells
51–56.
Insofar as maximal AMPK activation inhibits not only
O-GlcNAcylation but also other downstream targets (e.g., p70S6K,
NFAT, ERK), one may wonder regarding the relative importance
of O-GlcNAcylation inhibition in the overall anti-hypertrophic
action of AMPK. Results from our in vivo study help to answer
this question. Indeed, in our work, mice were treated with a
relatively high dose of metformin. Such dose has been previously
shown to inhibit classical AMPK downstream targets, including
pathways regulating protein synthesis
15. In spite of this
con-comitant inhibition of the other AMPK downstream targets, the
OGA inhibitor NButGT remains capable of fully blocking the
anti-hypertrophic action of AMPK activator. This strongly
sug-gests that O-GlcNAc inhibition remains the main mechanism by
which AMPK blocks cardiac hypertrophy.
We identified two molecular mechanisms that explain how
AMPK regulates HBP and O-GlcNAcylation during cardiac
hypertrophy development. First, AMPK increases GFAT
phos-phorylation at Ser243. This AMPK phosphos-phorylation site has been
previously reported to decrease GFAT activity in different cellular
models
35, 55. GFAT being the rate limiting step of HBP, its
inhibition by AMPK has great consequence in HBP and
O-GlcNAcylation downstream events. In addition to GFAT
reg-ulation, we also ascertained a decrease in OGT protein expression
after AMPK activation in our in vivo model of cardiac
hypertrophy. We ruled out a possible modification in Ogt mRNA
(Supplementary Fig.
12
). We could thus hypothesize that AMPK
regulates OGT protein stability and consequently its expression.
Supporting our data, a possible OGT phosphorylation by AMPK
has been demonstrated
54. It has to be mentioned that this
AMPK-mediated OGT regulation does not seem mandatory. Indeed,
OGT protein level was modified neither by PE nor by A769662 in
our in vitro model of NRVMs (Supplementary Fig.
13
). We
postulate that OGT regulation requires more time in vivo than in
our cellular model (24 h). Finally, we showed that, independently
of hypertrophy, OGA protein level is modified in AMPK deficient
mice. However, it is difficult to know if such AMPK/OGA
reg-ulation exists naturally in actual pathophysiological conditions.
By regulating major enzymes involved in O-GlcNAc signaling,
AMPK modulates global protein O-GlcNAcylation levels. Several
proteins involved in cardiac hypertrophy development have
already been described as undergoing O-GlcNAcylation. Among
them, we can for instance name the transcription factor
c-Myc
57, 58and the contractile components troponin I
59and
TnT
44. Here, we demonstrated that TnT is one of the
down-stream targets of this AMPK-mediated regulation of
O-GlcNAcylation. We are tempted to speculate that, by regulating
global HBP, AMPK prevents O-GlcNAcylation processes linked
to the activity of many other proteins. We can hypothesize that
another mechanism controlled by AMPK and O-GlcNAcylation
is autophagy. Indeed, our study revealed that AMPK activation
might prevent hypertrophy in the face of ongoing elevated
pro-tein synthesis. Increasing autophagy is certainly a suitable way to
counteract this increase in protein synthesis. Beclin1 and Bcl2
have been shown to be O-GlcNAcylated in diabetic hearts
sub-mitted to TAC, impairing autophagy
60. We can presume that
such proteins can be targeted by AMPK via O-GlcNAcylation
regulation, even if AMPK can also directly promote autophagy
61.
In addition, we cannot exclude direct additional specific targeting
of
pro-hypertrophic
mediators
by
AMPK,
where
O-GlcNAcylation and phosphorylation can compete for the same
Ser/Thr site
62.
In summary, our study clearly highlights that AMPK inhibits
cardiac hypertrophy mainly, if not solely, by regulating HBP and
O-GlcNAcylation processes (Fig.
10
g). This work provides novel
insights into mechanisms linking cardiac hypertrophy and
AMPK, with the emergence of O-GlcNAcylation as a novel
putative therapeutic target. Additional studies are required to
identify all the O-GlcNAcylated proteins involved in this
phenomenon.
Methods
Animal care. This study was approved by the Animal Research Committee of the Université catholique de Louvain and conformed to the American Heart Asso-ciation Guidelines for Use of Animal in Research. All animals, housed with a 12 h/ 12 h light/dark cycle, had free access to water and standard chow (except if spe-cified otherwise).
Antibodies reagents and chemicals. All antibodies used in the present study are listed in the Supplementary Table2. AngII was from Merck. PE, metformin, PUGNAc, Aza, DON, AICAr, phenformin, and GlcN were from Sigma. Wheat germ agglutinin (WGA)/rhodamine was from Vector Biolab. A769662 was from R&D Systems.
Preparation and treatment of NRVMs in primary culture. NRVMs were isolated and cultured under aseptic conditions63. After sacrifice of 1- to 3-days old Wistar rat pups, hearts were harvested, placed in Hank’s balanced salt solution (HBSS) and cut in 4 pieces. They were transferred into a 50ml-flask containing 30 ml of 1 g/L trypsin solution in HBSS and incubated 4 h at 4 °C under agitation. A second digestion was performed with a 0.5 g/L collagenase solution in Iscove’s modified dulbecco’s medium (IMDM). The digested hearts were centrifuged (1220 g, 5 min, 4 °C), resuspended in IMDM and placed on top of a 39% Percoll isotonic solution. Following centrifugation (3660 g, 30 min, 15 °C), cardiomyocytes were resuspended by pipetting them in IMDM containing 10% foetal bovin serum (FBS) and 2%