HAL Id: hal-02921216
https://hal.archives-ouvertes.fr/hal-02921216
Submitted on 26 Aug 2020
HAL is a multi-disciplinary open access
archive for the deposit and dissemination of
sci-entific research documents, whether they are
pub-lished or not. The documents may come from
teaching and research institutions in France or
abroad, or from public or private research centers.
L’archive ouverte pluridisciplinaire HAL, est
destinée au dépôt et à la diffusion de documents
scientifiques de niveau recherche, publiés ou non,
émanant des établissements d’enseignement et de
recherche français ou étrangers, des laboratoires
publics ou privés.
Some Types of Carbon-based Nanomaterials as Contrast
Agents for Photoacoustic Tomography
Kateryna Dubyk, Lesia Chepela, Sergei Alekseev, Andrey Kuzmich, Boris
Zousman, Olga Levinson, Aleksey Rozhin, Alain Geloen, Mykola Isaiev,
Vladimir Lysenko
To cite this version:
Kateryna Dubyk, Lesia Chepela, Sergei Alekseev, Andrey Kuzmich, Boris Zousman, et al.. Some
Types of Carbon-based Nanomaterials as Contrast Agents for Photoacoustic Tomography. Journal
of Nano and Electronic Physics, Sumy State University (Sumy, Ukraine), 2020, 12 (4), pp.04033.
�10.21272/jnep.12(4).04033�. �hal-02921216�
Some Types of Carbon-based Nanomaterials as Contrast Agents for Photoacoustic Tomography
Kateryna Dubyk1,2, Lesia Chepela1, Sergei Alekseev1,2, Andrey Kuzmich1,2, Boris Zousman3,
Olga Levinson3, Aleksey Rozhin4, Alain Geloen5, Mykola Isaiev6, Vladimir Lysenko7,8 1 Taras Shevchenko National University of Kyiv, 64/13, Volodymyrska St., 01601 Kyiv, Ukraine
2 Science Park Kyiv Taras Shevchenko University, 60, Volodymyrska St., 01033 Kyiv, Ukraine 3 Ray Techniques Ltd., Hebrew University of Jerusalem, P.O.B. 39162, Israel
4 Aston Institute of Photonic Technologies, Aston University, Aston Triangle,
Birmingham B4 7ET, United Kingdom
5 University of Lyon, CarMeN Laboratory, UMR INSERM 1060, INSA de Lyon, University of Lyon,
69361 Lyon, France
6 Université de Lorraine, CNRS, LEMTA (UMR 7563), Nancy, F-54000, France
7 Nanotechnology Institute of Lyon (INL), UMR CNRS 5270, University of Lyon, 69361 Lyon, France 8 Light Matter Institute, UMR-5306, Claude Bernard University of Lyon/CNRS, Université de Lyon,
69622 Villeurbanne cedex, France
(Received 29 April 2020; revised manuscript received 20 August 2020; published online 25 August 2020) This paper is devoted to the study of various carbon-based nanomaterials as photoacoustic contrast agents. The research work was performed on agarose-based tissue phantom containing inclusions with and without carbon-based nanomaterials. The inclusion was created with the higher density compared to phan-tom in order to simulate a tumor. A specially designed photoacoustic probe was introduced for measuring a level of photoacoustic signal and its enhancement caused by the nanoinclusions presence. The probe con-sists of a buffer for time separation of the signal coming from the excitation source, piezoelectric transduc-er, and amplifier. A point-by-point measurement of the signal was performed to obtain a two-dimensional map from magnitude of photoacoustic signal and phase delay of the signal registration. From phase delay the 3D photoacoustic images were reconstructed by evaluation of the depth coordinate based on the tissue sound velocity. As an excitation source the light radiation from Nd:YAG laser with a 16 ns pulse duration and a 1064 nm wavelength was used. Firstly, we considered tissue phantom with a tumor covered by gra-phene oxide as a reference one. It has been shown that the use of gragra-phene oxide leads to significant im-provement of the image contrast. Further, the tumors labelled with nanodiamonds (NDs) and carbon fluoroxide (CFO) nanoparticles (NPs) were studied systematically. Amplitude of the photoacoustic signals registered from such tumor phantoms are one order of magnitude lower than the signal ensured by gra-phene oxide. All three types of the studied carbon-based nanomaterials (GO, NDs, CFO) give stable photo-acoustic signal, this allows to consider them as good candidates for further in-vitro experiments in photoa-coustic imaging for biological applications. The dependences of the signal level as a function of the NPs concentration were measured for types of NPs. Considering much more efficient penetration of NDs and CFO NPs inside the cells as well as their extremely low cytotoxicity, these both types of carbon nano-materials could be used for further in-vivo experiments.
Keywords: Carbon nanomaterials, Tissue phantoms, 3D imaging, Photoacoustic tomography.
DOI: 10.21272/jnep.12(4).04033 PACS numbers: 81.05.Uw, 42.30.Wb
1. INTRODUCTION
Optical imaging is one of the main tools for visuali-zation in medicine, which is based on interaction of elec-tromagnetic radiation with a studied object. The ad-vantage of optical techniques is the relatively high reso-lution (1-10 m) which increases with decrease in wave-length. However, strong optical absorption of biological tissues in the range of short wavelengths is a crucial limitation. An optimal spectral range corresponds to near-infrared region, but in this region strong light scat-tering leads to significant reduction of optical image quality especially for the objects localized at depths larger than the scattering length (~ 3 cm). On the other hand, ultrasound imaging based on propagation of acoustic waves in bio-tissues can overcome this limita-tion. The ultrasound imaging quality is poorer and less resolved in comparison with optical one. The photoa-coustic tomography aims to use the advantages of both optical and ultrasound imaging approaches [1, 2].
Photoacoustic effect is a generation of pressure per-turbations in a media as a result of interaction of the media with modulated intensity electromagnetic radia-tion. The main mechanism of the photoacoustic trans-formation is based on the heating of the media because of non-radiative relaxation of photoexcited excitations which is followed by the thermoselastic expansion of the media. It should be emphasized that the significant advantage of photoacoustic technique is the sensitivity only to absorbed portion of electromagnetic radiation. Let us note that the study of photoacoustic phenomena in multiphase systems is a complicated issue [3-5].
As it was mentioned above, the absorption coefficient of biological tissues for the near-infrared wavelengths and their corresponding photoacoustic responses is ra-ther low. The use of nanoparticles (NPs) as contrast agents significantly improves photoacoustic imaging [6] and allows to perform a deeper imaging within the tis-sue with enhanced contrast. The good choice corresponds
K. DUBYK,L. CHEPELA,S. ALEKSEEV ET AL. J.NANO-ELECTRON.PHYS. 12, 04033 (2020)
04033-2 to the NPs with peak absorption in the NIR range, where optical attenuation by tissues is relatively low. Additionally, nanomaterials due to their excellent biocom-patibility provide a versatile platform for theranostics to perform simultaneous therapy and diagnostics [7].
Carbon nanomaterials have significant therapeutic potential because of their biocompatibility, low toxicity, easy penetration inside living cells, photoluminescence features [8]. Furthermore, most of carbon nanomaterials possess strong absorption in the infrared or near infra-red regions, which is useful for photothermal therapy of cancer [9, 10]. In the biomedical field, carbon nano-materials were highly anticipated to provide unique and new opportunities for the development of novel biosen-sors, nanocarriers for drug delivery, cell imaging and photo-therapy treatment of cancer [11, 12].
The study of efficiency of various NPs as contrast agents in phantom tissues is an important preliminary step for the following in-vivo diagnostics [13, 14]. Addi-tionally, such phantoms allow testing and optimization of new methods in a controlled way, comparing perfor-mances of photoacoustic imaging, ultrasound systems as well as to assist in the development of new acoustic, ultrasound transducers, systems or diagnostic tech-niques. A large number of phantoms were already de-veloped to mimic optical and acoustic properties of bio-logical tissues [15]. In particular, agarose gel is widely used as a phantom of human tissue because its elastic characteristics are similar to those of human body [16].
Our paper is devoted to the study of different carbon-based nanomaterials as photoacoustic sensitizers. More specifically, we consider nanodiamonds (NDs) and carbon fluorooxide (CFO) NPs. Additionally, graphene oxide (GO) contrast agent was used for reference measurements. We have fabricated an agarose-based tissue phantom with inclusions of a higher density to mimic a tumor site. The inclusion was covered by nano-carbon materi-als before its incorporation inside the tissue phantoms. 3D photoacoustic tomography of the inclusion with and without carbon nanomaterials was performed to esti-mate the level of image contrast improvement.
2. MATERIALS AND METHODS 2.1 Sample Preparation
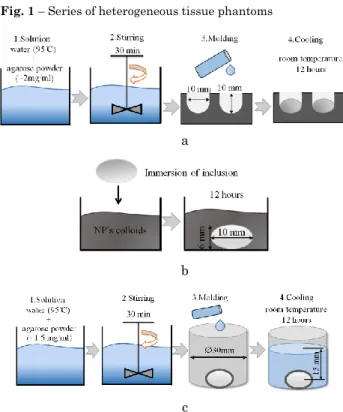
In our work, gels with 2 w/v % agarose concentra-tions were prepared to mimic a soft tissue [17]. Three types of agarose-based phantom samples were prepared for our measurements: (i) homogenous tissue phantom; (ii) tissue phantom with tumor; (iii) tissue phantom with tumor covered by carbon nanomaterials. Tissue phantom and tumor were fabricated from agarose gel. Density difference of the inclusions and the phantom were set by variation of concentration of agarose pow-der, and it was around 30 %. Size of bulk inclusions 5 3 mm, 10 6 mm, 20 10 mm should correspond to cancer sites at different development state of the can-cer. Schematically, a series of the fabricated phantom samples is illustrated in Fig. 1.
Schemes of phantoms fabrication procedure are shown in Fig 2. The first step includes tumor fabrica-tion (Fig 2a). For this purpose, agarose powder (A9539, Sigma Aldrich) was dissolved in water heated to 95 C and stirred for 20 min. Concentration of agarose
pow-der in gel was about 2 wt. %. The solution was poured into a mold to perform inclusion with a desired shape. Then, it was left for cooling and solidification for 2 h at room temperature. After that, inclusions were removed from the mold.
Fig. 1 – Series of heterogeneous tissue phantoms
a
b
c
Fig. 2 – Schemes of tissue phantom fabrication: (a) tumor fabri-cation; (b) covering of tumor by nanomaterials; (c) incorporation of tumor in tissue phantom
During the next step, the covering of the tumor by nanomaterials (Fig. 2b) was performed. As it was men-tioned previously, we studied efficiency of GO, NDs and CFO as photoacoustic sensitizers. The structure of the selected objects is fundamentally different: (i) CFO has a molecular nature (high molecular compound); (ii) GO is a 2D nanomaterial; (iii) NDs are 3D nanocrystals. GO water dispersion was bought in the stock Gra-phenea [18]. NDs were synthesized by controlled meth-od of Light Hydro-Dynamic Pulse (LHDP) and charac-terized in [19]. The surface of NDs was chemically mod-ified in a mixture of inorganic acids to replace diverse radicals by hydroxyl functional surface groups. Then, to provide better disaggregation and colloidal stability, NDs were heated at 420 C for 1 h and dispersed in water by a simple stirring (without using any surfac-tant) and additionally ultrasonicated in a bath-type system. The basic properties and procedure of CFO solution preparation were described in detail in [20]. Concentration range of the nanomaterials in solution was about 0.01-1 mg/ml. Thus, inclusions were added to the prepared solutions with fixed concentration and left for 12 h. After this time, the inclusions were removed from the solution and left to dry for 30 min.
Finally, the third step was the incorporation of the tumor in a tissue phantom (Fig 2c). The inclusions were incorporated in agarose gel (concentration is equal to 1.5 wt.%) and left for cooling and solidification for 12 h at room temperature. The thickness of final tissue phantoms is about 20 mm. Photos of fabricated tissue phantom with tumor without contrast agents (a); tumor covered by NDs (b); tumor covered by CFO (c); tumor covered by GO (d) are shown in Fig. 3.
a b
c d
Fig. 3 – Photos of fabricated tissue phantoms with tumor: (a) with-out contrast agents; (b) tumor covered by NDs; (c) tumor covered by CFO; (d) tumor covered by GO. Concentration of carbon nano-materials for all tissue phantoms is equal to 0.1 mg/ml
3. EXPERIMENTAL DETAILS 3.1 Excitation
The sketch of the used experimental setup is shown schematically in Fig. 4. The light radiation from a Q-switched Nd:YAG laser with a 16 ns pulse duration and a 1064 nm wavelength was used as an excitation source. Pulse energy was tuned by filters to avoid any sample damage. The intensity of the laser beam was controlled with a photodiode and laser fluency was equal to 300 mJ/cm2. The diameter of laser beam
focus-ing was approximately equal to 1-2 mm. 3.2 Registration
The beam was directed toward a photoacoustic buff-er shown in Fig. 4a. The photoacoustic buffbuff-er consists of a transparent buffer (30 mm thick glass piece) and a piezoelectric sensor being in rigid contact with the buff-er. The photoacoustic buffer was contacted with tissue phantom through a transmission gel. The piezoelectric transducer PIC151 (Piezo Technology) with a ring shape has outer/inner diameters and thickness equal to 10/ 20 mm and 1 mm, respectively, and frequency 2 MHz. Generated photoacoustic signals were amplified by Tes-sonics SAP Amplifier and detected by a digital oscillo-scope Tektronix TDS 2024B. The final oscillogram was averaged over 64 pulses. Typical shape of photoacoustic response from the studied phantom with tumor covered by nanomaterials is shown in Fig. 4b. To obtain 3D im-aging of a sample, peak-to-peak amplitude of the
photo-acoustic signal (A) was measured point by point with 2D
x-y stage. The scanning area was about 12 12 mm with a step of 250 m. The third (z) coordinate was recon-structed by measuring the times of arrival of the ultra-sound waves at the studied sample with the use of pre-viously determined speed of sound in phantom tissue.
a
b
Fig. 4 – Experimental setup of pulse-induced photoacoustic response in tissue phantom (a). Typical shape of photoacoustic response from tissue phantom with tumor covered by GO (con-centration is equal to 0.1 mg/ml) (b)
4. RESULTS AND DISCUSSION
Experiments were performed for all types of agarose-based phantoms shown in Fig. 1. Photoacoustic meas-urements were carried out for (i) homogeneous tissue phantoms without any inclusions and (ii) tissues with tumor without carbon nanomaterials (Fig. 5). All meas-urements have three repetitions. It is obvious that level of acoustic signal for homogeneous samples without inclusion (a) and for phantoms with inclusions of differ-ent sizes (b) is small. It is worth noting that despite the low level of the signal from considered samples, the signal registered from tissue phantom with inclusion of higher agarose density is still distinguishable bigger. These experimental facts additionally confirm the ne-cessity of the introduction of contrast agents inside tissue phantoms to increase the amplitude of the de-tected photoacoustic signal.
We have measured photoacoustic signals for phan-toms with the same inclusion size, but for different con-centrations of GO to obtain a calibration dependence of signal amplitude on the concentration of NPs that cover the tumor. Thus, Fig. 6 compares averaged photoacous-tic responses for heterogeneous tissue phantoms with various concentrations of NPs.
Calibration dependence of amplitude of photoacous-tic signal on the concentration of NPs, which cover the tumor, is represented in Fig. 7. The range of concentra-tion of GO is equal to 0.001-0.1 mg/ml. As one can see, an experimental dependence is linear. Thus, by meas-uring the signal level, we can evaluate the concentra-tion of NPs which are present in the sample.
After that, photoacoustic measurements of cancer tissues with carbon nanomaterials (GO, Graphenea) were performed. The concentration of GO is equal to
K. DUBYK,L. CHEPELA,S. ALEKSEEV ET AL. J.NANO-ELECTRON.PHYS. 12, 04033 (2020)
04033-4 0.025 mg/ml. Fig. 8 demonstrates typical photoacoustic signal for tissue phantoms with different size of tumors covered by NPs. Amplitude of signals for all sizes of tu-mor inclusions has approximately the same level. It also should be noted, that since the inclusions are in a healthy phantom at different depths due to their vari-ous sizes, then the photoacvari-oustic response should arrive with a delay. This feature is clearly observed experi-mentally (Fig. 8). Particularly, in the case of the small-est switch-on size, the photoacoustic response is record-ed approximately in 12 s, while the signal for the larg-est bulk inclusions arrives approximately in 10 s after the laser pulse irradiation.
These features allow us to construct 3D images of heterogeneous tissue phantoms with inclusions covered with various carbon nanomaterials.
a
b
Fig. 5 – Fragment of oscillogram of photoacoustic measurements for a homogenous tissue phantom (a) and a tissue phantom with different size of tumor, but without contrast agents (b)
Fig. 6 – Typical photoacoustic signal for tissue phantoms with tumor covered by GO with different concentrations
Fig. 7 – Experimental dependence of the signal amplitude on the concentration of GO which covers the tumor. Solid line is the linear approximation of experimental data
Fig. 8 – Typical photoacoustic signal for tissue phantoms with tumor covered by GO with the same concentration
Fig. 9 – Amplitude of photoacoustic responses for agarose-based phantom tissues with tumor covered by carbon nanomaterials with different concentration. The selected area shows the con-centration of nanomaterials that were selected for reconstruc-tion of 3D images
Since, a level of acoustical signal is small for a ho-mogenous tissue phantom and a tissue phantom with tumor and without contrast agents, 3D tomographies were reconstructed for tissue phantom with tumor cov-ered by carbon nanomaterials.
Firstly, peak-to-peak averaged amplitude of the pho-toacoustic signal was measured for several concentra-tions of carbon NPs varying in the range 0.01 mg/ml to 1 mg/ml. Fig. 9 shows an experimental increase in am-plitude with an increase in concentration of various pho-toacoustic contrast agents. GO leads to more important enhancement of the photoacoustic response in compari-son with NDs and CFO. Therefore, tissue phantom with
tumor covered by GO is the most preferable candidate for in-vitro and ex-vivo studies. Nevertheless, degree of toxicity and typical size of the GO NPs (~ 600 nm) are not really suitable for in-vivo experiments.
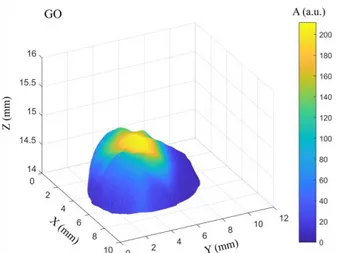
Fig. 10 demonstrates reconstructed 3D photoacoustic tomography of the tissue phantom with tumor covered by GO (concentration is equal to 0.05 mg/ml). As seen in Fig. 10, the experimental 3D imaging fully agrees with real photo (Fig. 3d). Particularly, GO is mainly concen-trated in the center of the phantom tumor, which corre-sponds to the maximum photoacoustic signal amplitude. It should be mentioned that the signals detected from the different phantom tumors covered with GO with the same concentration have the same amplitude.
The images of tissue phantoms with tumor covered by NDs and CFO were also reconstructed (Fig. 11). As one can state from the figure, the signal level is one or-der of magnitude less compared to the case of GO. On the other hand, the experimental amplitude is quite sufficient to record a stable laser ultrasound signal with an excellent repeatability.
Since all three types of the studied nanomaterials (GO, NDs, CFO) give stable photoacoustic responses, this allows to consider them as excellent candidates for fur-ther experiments in photoacoustic imaging of biological objects. Despite the fact that the use of GO ensures the highest amplitude of the photoacoustic signal and the better visual contrast of the phantom tissue images, it is necessary to take into account various additional factors (toxicity, cell penetration, clearance rate) for future use of this kind of nanomaterials for in-vivo experiments.
Fig. 10 – 3D reconstruction of tissue phantom with tumor cov-ered by GO with concentration of 0.05 mg/ml
5. CONCLUSIONS
In conclusions, 3D photoacoustic tomography can be carried out with the use of nanocarbon-based sensitizers having different structures: (i) CFO NPs with molecular nature; (ii) GO as a 2D nanomaterial and (iii) 3D NDs. GO leads to a more important photoacoustic response in comparison with NDs and CFO. In particular, for the case of NDs and CFO covering the tumor, the magni-tude of the photoacoustic signals is about, respectively,
10 % and 5 % of the response obtained with application of GO. Nevertheless, even such photoacoustic signals generated by CFO and NDs are quite sufficient to visu-alize a tumor phantom at a selected excitation wave-length. In general, all the considered carbon-based na-nomaterials are excellent candidates for ex-vivo study. In our opinion, only NDs and CFO are much more suit-able for further in-vivo experiments due to their effi-cient penetration inside the cells and low cytotoxicity.
a
b
Fig. 11 – 3D reconstruction of tissue phantom with tumor covered by: (a) NDs; (b) CFO (concentration for the both type of contrast agents were equal to 0.05 mg/ml)
ACKNOWLEDGEMENTS
This research work was carried out in frames of CARTHER project (proposal #690945) of Marie Skłodowska-Curie Research and Innovation Staff Exchange program. The publication contains the results obtained in the frames of the research work "Features of photothermal and photoacoustic processes in low-dimensional silicon-based semiconductor systems" (Ministry of Education and Science of Ukraine, state registration number 0118U000242).
The authors appreciate Dr. Karyna Isaieva from la-boratory IADI of University of Lorraine and INSERM.
K. DUBYK,L. CHEPELA,S. ALEKSEEV ET AL. J.NANO-ELECTRON.PHYS. 12, 04033 (2020)
04033-6 REFERENCES
1. Z. Chen, S. Yang, Y. Wang, D. Xing, Opt. Lett. 40, 2838 (2015). 2. K. Voitenko, V. Veleschuk, M. Isaiev, A. Kuzmich, O. Lyashenko,
O. Vlasenko, M. Melnychenko, E. Malyarenko, S. Zhelnakov, V. Lysenko, R. Burbelo, AIP Adv. 6, 105306 (2016).
3. K. Dubyk, L. Chepela, P. Lishchuk, A. Belarouci, D. Lacroix, M. Isaiev, Appl. Phys. Lett. 115, 021902 (2019).
4. K. Dubyk, T. Nychyporuk, V. Lysenko, K. Termentzidis, G. Castanet, F. Lemoine, D. Lacroix, M. Isaiev, J. Appl. Phys. 127, 225101 (2020).
5. D. Wu, L. Huang, M.S. Jiang, H. Jiang, Int. J. Mol. Sci. 15,
23616 (2014).
6. H. Peng, X. Liu, G. Wang, M. Li, K.M. Bratlie, Q. Wang,
J. Mater. Chem. B. 3, 6856 (2015).
7. Z. Liu, X.J. Liang, Theranostics 2, 235 (2012).
8. B. Kang, D. Yu, Y. Dai, S. Chang, D. Chen, Y. Ding, Small 5, 1292 (2009).
9. J. Zhong, S. Yang, X. Zheng, T. Zhou, D. Xing, Nanomedicine 8, 903 (2013).
10. Y. Liu, D. Yu, C. Zeng, Z. Miao, L. Dai, Langmuir 26, 6158
(2010).
11. Y.-K. Kim, M.-H. Kim, D.-H. Min, Chem. Commun. 47, 3195
(2011).
12. A. De La Zerda, C. Zavaleta, S. Keren, S. Vaithilingam, S. Bodapati, Z. Liu, J. Levi, B.R. Smith, T.-J. Ma, O. Oralkan, Z. Cheng, X. Chen, H. Dai, B.T. Khuri-Yakub, S.S. Gambhir,
Nat. Nanotechnol. 3, 557 (2008).
13. J.-W. Kim, E.I. Galanzha, E.V. Shashkov, H.-M. Moon, V.P. Zharov, Nat. Nanotechnol. 4, 688 (2009).
14. M.O. Culjat, D. Goldenberg, P. Tewari, R.S. Singh, Ultra-sound Med. Biol. 36, 861 (2010).
15. P. Zarrintaj, S. Manouchehri, Z. Ahmadi, M.R. Saeb, A.M. Urbanska, D.L. Kaplan, M. Mozafari, Carbohydr. Polym. 187, 66 (2018).
16. F. Adams, T. Qiu, A. Mark, B. Fritz, L. Kramer, D. Schlager, U. Wetterauer, A. Miernik, P. Fischer, Ann. Biomed. Eng. 45,
963 (2017). 17. Graphenea,
https://www.graphenea.com/collections/graphene-oxide
18. M.V. Baidakova, Y.A. Kukushkina, A.A. Sitnikova, M.A. Yagovkina, D.A. Kirilenko, V.V. Sokolov, M.S. Shestakov, A.Y. Vul’, B. Zousman, O. Levinson, Phys. Solid State 55,
1747 (2013).
19. S. Alekseev, D. Korytko, M. Iazykov, S. Khainakov, V. Lysenko,
J. Phys. Chem. C. 119, 20503 (2015).
Порівняльний аналіз застосування деяких карбонових матеріалів як контрастних речовин для фотоакустичної томографії
Kateryna Dubyk1,2, Lesia Chepela1, Sergei Alekseev1,2, Andrey Kuzmich1,2, Boris Zousman3,
Olga Levinson3, Aleksey Rozhin4, Alain Geloen5, Mykola Isaiev6, Vladimir Lysenko7,8 1 Taras Shevchenko National University of Kyiv, 64/13, Volodymyrska St., 01601 Kyiv, Ukraine
2 Science Park Kyiv Taras Shevchenko University, 60, Volodymyrska St., 01033 Kyiv, Ukraine 3 Ray Techniques Ltd, Hebrew University of Jerusalem, P.O.B. 39162, Israel
4 Aston Institute of Photonic Technologies, Aston University, Aston Triangle, Birmingham B4 7ET, United Kingdom 5 University of Lyon, CarMeN Laboratory, UMR INSERM 1060, INSA de Lyon, University of Lyon,
69361 Lyon, France
6 Université de Lorraine, CNRS, LEMTA (UMR 7563), Nancy, F-54000, France
7 Nanotechnology Institute of Lyon (INL), UMR CNRS 5270, University of Lyon, 69361 Lyon, France 8 Light Matter Institute, UMR-5306, Claude Bernard University of Lyon/CNRS, Université de Lyon
69622 Villeurbanne cedex, France
Ця стаття присвячена вивченню різних наноматеріалів на основі вуглецю як фотоакустичних конт-растних речовин. Дослідницька робота проводилася на фантомі тканини на основі агарози, що містить включення з карбоновими наноматеріалами та без них. Включення було створено з більш високою гус-тиною порівняно з фантомом з метою імітування пухлини. Для вимірювання рівня фотоакустичного сигналу та його підсилення, спричиненого наявністю нановключень, було використано спеціально роз-роблений фотоакустичний зонд. Зонд складається з буфера для часового розділення сигналу, що над-ходить від джерела збудження, п'єзоелектричного перетворювача та підсилювача. Точкові вимірюван-ня сигналу проводилися для отриманвимірюван-ня двовимірної карти величини фотоакустичного сигналу та фа-зової затримки реєстрації сигналу. На основі затримки фази реконструювали фотоакустичні 3D зобра-ження шляхом оцінки координати глибини на основі швидкості звуку в тканині. Як джерело збуджен-ня було використано світлове випромінюванзбуджен-ня від Nd:YAG лазера з тривалістю імпульсу 16 нс та дов-жиною хвилі 1064 нм. По-перше, ми розглядали тканинний фантом із пухлиною, покритою оксидом графена (GO) в якості контрольного. Показано, що використання GO призводить до значного поліп-шення контрасту зображення. Далі систематично вивчалися пухлини, покриті нанодіамантами (NDs) та наночастинками фтороксиду вуглецю (CFO). Амплітуда фотоакустичних сигналів, зареєстрованих від таких фантомів пухлини, на порядок менша, ніж сигнал, одержуваний від GO. Всі три типи дослі-джуваних наноматеріалів на основі вуглецю (GO, NDs, CFO) дають стабільний фотоакустичний сигнал, що дозволяє вважати їх хорошими кандидатами для подальших експериментів in vitro у фотоакустич-ній візуалізації для біологічних застосувань. Залежності рівня сигналу від концентрації наночастинок вимірювали для окремих типів наночастинок. Враховуючи набагато ефективніше проникнення NDs та CFO наночастинок всередину клітин, а також їх надзвичайно низьку цитотоксичність, ці обидва типи вуглецевих наноматеріалів можуть бути використані для подальших експериментів in vivo. Ключові слова: Вуглецеві наноматеріали, Фантоми тканин, 3D-зображення, Фотоакустична томографія.