HAL Id: hal-01805239
https://hal.archives-ouvertes.fr/hal-01805239
Submitted on 16 Sep 2020
HAL is a multi-disciplinary open access
archive for the deposit and dissemination of
sci-entific research documents, whether they are
pub-lished or not. The documents may come from
teaching and research institutions in France or
abroad, or from public or private research centers.
L’archive ouverte pluridisciplinaire HAL, est
destinée au dépôt et à la diffusion de documents
scientifiques de niveau recherche, publiés ou non,
émanant des établissements d’enseignement et de
recherche français ou étrangers, des laboratoires
publics ou privés.
Distributed under a Creative Commons Attribution| 4.0 International License
Focus on extreme events and the carbon cycle
Chuixiang Yi, Elise Pendall, Philippe Ciais
To cite this version:
Chuixiang Yi, Elise Pendall, Philippe Ciais. Focus on extreme events and the carbon cycle.
Envi-ronmental Research Letters, IOP Publishing, 2015, 10 (7), �10.1088/1748-9326/10/7/070201�.
�hal-01805239�
Environmental Research Letters
EDITORIAL • OPEN ACCESS
Focus on extreme events and the carbon cycle
To cite this article: Chuixiang Yi et al 2015 Environ. Res. Lett. 10 070201
View the article online for updates and enhancements.
Related content
A few extreme events dominate global interannual variability in gross primary production
Jakob Zscheischler, Miguel D Mahecha, Jannis von Buttlar et al.
-Extreme late-summer drought causes neutral annual carbon balance in southwestern ponderosa pine forests and grasslands
Thomas Kolb, Sabina Dore and Mario Montes-Helu
-Effects of drought and ice rain on potential productivity of a subtropical coniferous plantation from 2003 to 2010 based on eddy covariance flux observation
Kun Huang, Shaoqiang Wang, Lei Zhou et al.
-Recent citations
Time resolved data unveils the complex DOM dynamics in a Mediterranean river
Simona Retelletti Brogi et al
-Aboveground Biomass Allometric Models for Evergreen Broad-Leaved Forest Damaged by a Serious Ice Storm in Southern China
Houben Zhao et al
-A global-scale evaluation of extreme event uncertainty in the <i>eartH2Observe</i> project
Toby R. Marthews et al
Environ. Res. Lett. 10 (2015) 070201 doi:10.1088/1748-9326/10/7/070201
EDITORIAL
Focus on extreme events and the carbon cycle
Chuixiang Yi1,2, Elise Pendall3and Philippe Ciais41 School of Earth and Environmental Sciences, Queens College, City University of New York, NY 11367, USA
2 Department of Meteorology, Bert Bolin Centre for Climate Research, Stockholm University, Stockholm S-106 91, Sweden 3 Hawkesbury Institute for the Environment, University of Western Sydney, Locked Bag 1797, Penrith, NSW 2751, Australia 4 Laboratoire des Sciences du Climat et de l’Environnement, CEA CNRS UVSQ, 91191 Gif sur Yvette, France
E-mail:[email protected]
Keywords: extreme events, ecological disturbance, droughts, hurricane, bark beetles, carbon cycle, climate mitigation
Abstract
Climate physics indicates that warming climate is a likely cause of extreme weather and more frequent
and intense climate events. These extreme events can disrupt terrestrial carbon dynamics dramatically
by triggering ecological disturbances and potentially forcing climate–carbon feedbacks. In this paper
we synthesize the
findings of 26 papers that focus on collecting evidence and developing knowledge of
how extreme events disturb terrestrial carbon dynamics.
1. Introduction
The World Meteorological Organization reported recently ‘that the world experienced unprecedented high-impact climate extremes during the 2001–2010 decade, which was the warmest since the start of modern measurements in 1850 and continued an extended period of pronounced global warming’ (World Meteor-ological Organization 2013). Even though since 2000, the warming rate is less than during the previous decade (the Hiatus period) extreme hot days have continued to increase in frequency and severity (Seneviratne et al2014). Although global mean annual temperature is not increasing every year, global decadal mean tempera-ture has increased every decade since 1970s. On the other hand, it is clearly evident that the frequency and intensity of extreme events of weather and climate have been increasing in this warming world (World
Meteor-ological Organization 2011, Coumou and
Rahm-storf 2012). Does global warming generate more
extreme weather events? There has been no direct answer yet. However, the link between extreme weather and warming climate can be understood by the physics of climate. In principle, the ability of atmosphere to hold water is dictated by the Clausius-Clapeyron equation;
e T T T ( ) 6.1094 exp 17.625 243.04 , (1) s ⎜ ⎟ ⎛ ⎝ ⎞ ⎠ = +
where, esis saturation vapor pressure in hPa,
repre-senting the maximum amount of water vapor that air
can hold at a given temperature T (°C) (Ahrens2000). The Clausius–Clapeyron equation (1) is derived from thefirst and second law of thermodynamics and has been broadly verified under both laboratory and natural conditions. It predicts that the water-holding capacity of the atmosphere increases by about 7% for every 1 °C rise in temperature, which is close to satellite-based observations that recorded a rate of change in the atmospheric water vapor content 6% °C−1(Kininmonth2010).
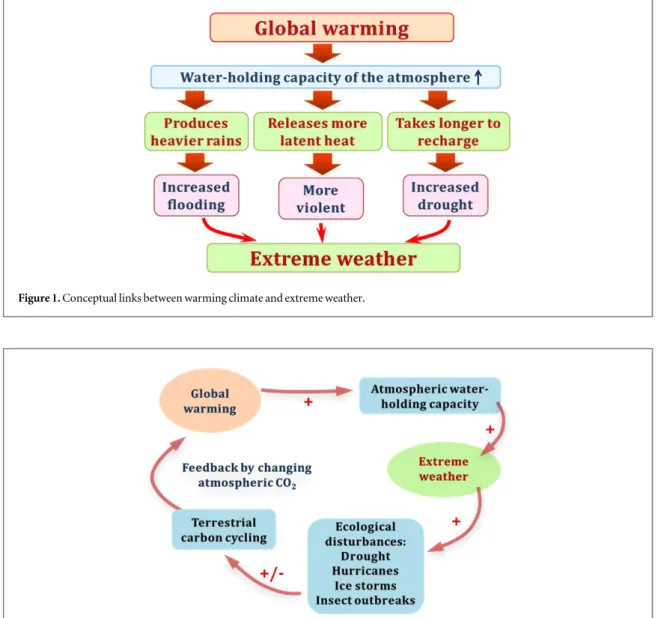
Figure1illustrates conceptual links between global warming and extreme weather. Warming air has higher saturation vapor pressure, i. e. larger size of the ‘room’ for water to evaporate from soils and water bodies and transpire from plants. In addition to increased saturation vapor pressure in the atmo-sphere, warming directly increases plant evapo-transpiration demand, leading to more water emitted by vegetated surfaces to the atmosphere unless soil moisture gets too depleted. This is likely to cause extreme precipitation events as the probability of water molecules condensing increases. Meanwhile, weather systems accompanied with extreme precipita-tion events can become more violent as more latent heat is released. It will also take longer to recharge the atmosphere with moisture as its capacity to hold water increases. Thus, duration between rain events becomes longer and hence drought would increase. We cannot be certain that any particular extreme weather event is caused by global warming. However,
OPEN ACCESS
RECEIVED
29 April 2015
ACCEPTED FOR PUBLICATION
14 May 2015
PUBLISHED
2 July 2015
Content from this work may be used under the terms of theCreative Commons Attribution 3.0 licence.
Any further distribution of this work must maintain attribution to the author(s) and the title of the work, journal citation and DOI.
we are certain that global warming amplifies the risk factors for extreme weather events from the principle of thermodynamics—hot air can hold more water molecules. Global warming increases atmospheric evaporative demand, which is supported by observa-tional data; about half of the land in warm regions (annual temperature >16 °C) has been drying with increasing temperature since the 1970s (Jung et al2010, Yi et al2014).
The high risk consequence of these warming-induced extreme events is that they often lead to ecolo-gical disturbances which can affect land–atmosphere exchanges of carbon and water dramatically, poten-tially contributing to climate–carbon feedback (Cox et al2013), illustrated infigure2. Most climate-related disturbance events have negative impacts on the health and carbon balance of ecosystems, especially in forests, because they kill trees, inducing a large carbon source to the atmosphere followed by a slow recovery sink (figure3). Some ecosystems are more resistant to dis-turbance; for instance, deserts and grasslands are
adapted to water stress. However, mega-drought and heat-waves can cause damage to plants that results in mortality, and more frequent drought can in the long-term change ecosystem structure (Breshears et al2005, Edburg et al2012;figure3).
In addition to altering the carbon balance, extreme events cause feedbacks to climate due to changed albedo and roughness, and because of altered sensible and latent heat emissions. Stand replacing fires in northern regions causes an increase in winter albedo due to higher snow cover over the short vegetation that covers the ground when the forest has burned. This has a net cooling climate effect (Randerson et al2006). Extreme drought generally suppresses eva-potranspiration and increases sensible heat (Teuling et al2013), which acts to increase air temperature and decrease rain probability. This causes a positive back on heat and drought. Thus, the direction of feed-back between ecological disturbance and global warming is challenging to predict, warranting the
Figure 1. Conceptual links between warming climate and extreme weather.
Figure 2. Schematic map of a potential climate-carbon feedback loop. This focus issue collects evidence on the links between extreme weather/climate and the carbon cycle.
2
investigations across a range of disturbance types and ecosystems presented in this focus issue.
The aim of this focus issue is not to verify the exis-tence of feedbacks but to collect evidence on how these extreme events, such as heat waves, droughts, hurri-canes and insect outbreaks change land–atmosphere exchanges, and to use quantitative approaches to iden-tify these events and explore driving forces behind their ecological consequences.
2. Drought
Fourteen papers in this focus provide lines of evidence of how ongoing extreme droughts affect terrestrial ecosystem exchange of CO2with the atmosphere from tower-based flux measurements and satellite-based
modeling. Net ecosystem–atmosphere exchange
(NEE) of CO2is a small imbalance between two large CO2fluxes with opposite directions: uptake from the atmosphere by gross primary production (GPP) and release back to the atmosphere by terrestrial ecosystem respiration (TER). These papers demonstrate that impact of extreme droughts on these two components is different and also varies from season to season and from biome to biome.
2.1. Spring drought
Soil moisture availability in spring is usually higher than in summer because soil reservoirs have been recharged by winter precipitation, in many summer-dry northern regions. However, lower precipitation combined with warmer winter temperatures can lead to spring droughts. Based on eddy-flux data collected in Switzerland, Wolf et al (2013) found that grasslands and forests respond differently to spring droughts because these ecosystems exhibit different water use
strategies. The ratio of CO2uptake (GPP) to water loss (transpiration) is called water use efficiency (WUE), which can be optimized at the ecosystem level under water limited conditions as plants can regulate the size of stomatal openings (Claesson and Nycander2013). The eddy-flux data indicate that forests increased their WUE during the spring drought, while grasslands’ WUE did not change substantially during the spring drought (Wolf 2013).
The response of ecosystems to drought is different from biome to biome. For peatlands, drought condi-tions will not only reduce soil wetness (reducing GPP) but also lower the water table, increasing the depth of the aerobic respiration layer (increasing TER). The data collected in a south Swedish nutrient-poor
peat-land by eddy-flux measurements indicate that
droughts can turn a temperate peatland from a carbon sink to a carbon source (Lund et al2012). The effect of drought on the peatlands depends on drought dura-tion. A prolonged drought in the early growing season resulted in reduced rates of GPP, while a short but severe drought in the middle of the growing season resulted in increased rates of TER (Lund et al2012), demonstrating the contrasting effects of extreme cli-mate events on components of the carbon cycle.
The 2010 spring drought in southwestern China was the most severe and long-lasting of the last half century. Satellite-based observations show that severe and extended spring droughts substantially reduced the enhanced vegetation index (EVI) and GPP and both did not recover from drought stress until August (Zhang et al2012). This spring drought event also low-ered the water levels of rivers, reservoirs and lakes, and even dried up some water bodies, which affected agri-cultural irrigation and hence crop production. Other satellite-based observations also show that spring drought induced by the El Niño/La Niña-Southern
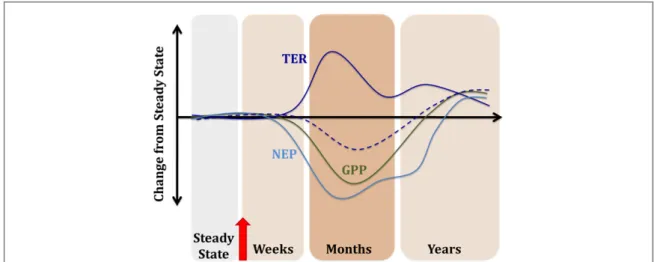
Figure 3. Hypothetical framework showing how ecological disturbance (red arrow) can perturb the ecosystem carbon cycle. First, vegetation is killed and its potential for C uptake via gross primary production (GPP, green line) declines. Disturbance may enhance C losses from ecosystem respiration (TER, dark blue solid line) if increased inputs of dead biomass stimulate decomposition.
Alternatively, TER may be reduced as autotrophic respiration is eliminated (dark blue dashed line). Net ecosystem production (NEP, light blue line), or net C storage on land, declines rapidly but recovers more slowly, even up to decades. Eventually, gains and losses are balanced and the ecosystem returns to steady state (Odum1969). Based on afigure in Edburg et al (2012), originally published in Frontiers in Ecology and the Environment.
3
Oscillation (ENSO) delayed vegetation onset time and reduced annual net primary production (NPP) in the subtropical island of Taiwan (Chang et al2013). 2.2. Late-summer drought
Kolb et al (2013) found that impacts of extreme late-summer drought on net ecosystem production (NEP) of semi-arid forest in the southern west United State (SWUS) differed between disturbed and undisturbed ecosystems based on six-year eddy-covariance mea-surements. The late-summer drought shifted August NEP at the undisturbed site from a carbon sink to source because the reduction of GPP (70%) exceeded the reduction of TER (35%). At the burned site, late-summer drought shifted August NEP from a weak carbon source to neutral because the reduction of TER (40%) exceeded the reduction of GPP (20%). The results illustrate the sensitivity of semi-arid forest carbon sequestration to extreme drought and suggest that warming-associated drought may interact with disturbances such asfire, possibly weakening semi-arid forest carbon sinks.
The contrasting impact of drought on GPP and TER between grazed and ungrazed desert steppe was also evidenced by data collected with tower-based eddy covariance approach on the Mongolian Plateau (Shao et al2013). This two-year dataset indicates that grazing can play a positive role in biophysical regula-tion of carbonfluxes in a desert steppe. The positive effects of grazing on the uptake of CO2 in semiarid steppe were also reported by Kang et al (2013). Although both these examples were short, the analyses will be useful for grazing management. Nevertheless, additional long-termflux measurements are needed to understand the mechanisms underlying the interac-tions between extreme climate, ecological disturbance, and carbon cycling.
2.3. Long-term drought events
Babst et al (2012) did clustering analysis of tree-ring growth data at∼1000 sites across Europe that showed regionally consistent growth patterns driven by cli-mate regimes and species–specific growth character-istics. Fifteen regional, synthetic chronologies that represent radial tree growth anomalies across Europe were reconstructed over the past ∼500 years. The analysis revealed 18 extreme tree-growth events dur-ing the pre-instrumental and 2 events (1947/48 and 1976) in the instrumental period, which may be been caused by extreme late-summer drought conditions.
The complexity of interactions between drought and vegetation response is demonstrated in a 26-year study that analyzed vegetation growth based on Nor-malized Difference Vegetation Index (NDVI) in China (Xu et al2012). Extreme events in temperature, pre-cipitation and drought based on Palmer Drought Severity Index (PDSI) appear to have increased across China over the past three decades. Associated with the
increasing trend in heat waves and drought events, a decreasing trend in the extreme low NDVI events (low vegetation growth) was observed. However, different regions in China experienced contrasting temporal patterns. Although extreme drought events increased in the 2000s in both northern and southern China, extreme low NDVI events keep decreasing in southern China, while the decrease is stalled or even reversed in northern China. Apparently, drought does not impact vegetation productivity in a consistent fashion across continents; prior land use such as grazing may need to be considered to reveal detailed mechanisms.
3. Extreme weather
3.1. Hurricane
The impact of catastrophic hurricanes on life loss and property damage has received considerable attention, but environmental impacts are often neglected. Hurri-canes create major ecological disturbances by killing hundreds of millions of trees and adding plant litter on the forestfloor, and potentially increasing risk of forest fire conditions. The drastic ecological disturbance by hurricanes is expected to have significant impacts on regional forest carbon balances. In this focus issue, we report case-studies for hurricane impacts on carbon cycling in tropical savannas and temperate forest ecosystems (Hutley et al 2013, Vargas 2012, Fisk et al2013).
3.1.1. Hurricane-savanna-fire interactions
Hutley et al (2013) estimated the ecological conse-quences of the mega-cyclone Monica that damaged or destroyed 140 million trees across the coastal and sub-coastal region of north Australia in 2006. They used the moderate resolution imaging spectroradiometer (MODIS) GPP (MOD17A2) to track spatial and temporal patterns between six years preceding and six years following the cyclone Monica. They found that there was a significant decline in the region’s GPP (directly proportional to its capacity to sequester carbon) relative to the pre-cyclone rates, and this reduced productivity persisted for four years post-cyclone. The most important ecological consequences of hurricanes is that the hundreds of millions of trees killed or damaged will be converted into CO2 and returned back to the atmosphere sooner byfire or later by decomposition. Hutley et al (2013) examined the impact that the massive increase in fuel load (vegeta-tion debris) following Cyclone Monica would have on the region’s fire regime. They found that fire frequency was extreme in the year following the cyclone, butfire frequency more or less returned to pre-cyclone condi-tions in the years that followed—an unexpected result. 3.1.2. Effect of hurricanes on the soil carbonflux
Vargas (2012) observed large pulses of soil CO2flux after hurricane Wilma in two-year time series of soil 4
carbon dioxide efflux measurements from two soil-sensor nodes. He reported that in the year following hurricane Wilma, annual soil carbon dioxide emis-sions were more than 3.9 kgC m−2 but decreased to 1.7 kgC m−2 for the second post-hurricane year. Vargas attributed the increase in the soil carbonflux post-Wilma to tree damage depositing nitrogen-rich, easily decomposable organic matter and higher basal soil CO2efflux rates. Moreover, GPP was not impacted immediately after the hurricane but during the drought period of thefirst year, a depletion of non-structural carbon reserves that likely were used for a ‘rapid’ recovery of canopy cover (e.g., leaf area index) during thefirst 2 months following the hurricane. 3.1.3. Carbon footprint of historical hurricanes in eastern US
The case studies conducted by Hutley et al (2013) and Vargas (2012) have demonstrated that a single hurri-cane event can exert a large disturbance in forest carbon balance, but forests have strong resilience to recover. In the short- to medium-term, hurricanes release carbon due to leaves and litters can be easily decomposed, while over the longer term, GPP will be increased from forest re-growth. Therefore, the recov-ery times of the two components, GPP and TER, of forest carbon balance from hurricane disturbances to approaching the normal rates are not the same (see figure3). This imbalance between GPP and TER might affect the ability of forests to absorb carbon in a long-term perspective. Fisk et al (2013) investigated it by modeling the reconstructed maps of tree mortality from hurricanes impacting the eastern US from 1851 to 2000. They found how long it takes for the forest re-growth to recover the carbon loss depends on the type of forest. Small disturbances in fast-growing regions can recover quickly, but large disturbances or slower growth rates can result in recovery that takes more than a century. Fisk et al (2013) concluded that on average, tropical cyclones contribute a net carbon source over latter half of the 19th century due to high storm activity and the existence of larger forests during that period. However, throughout much of the 20th century a regional carbon sink is estimated resulting from periods of forest recovery exceeding damage. 3.2. Ice storms
Terrestrial ecosystems in temperate to subtropical regions are vulnerable to the invasion of extreme cold events like ice storms. These cold events are common in East Asia and can cause massive structural damage to forests and often define the northern boundaries of key tree species. Sun et al (2012) investigated the impact of the massive 2008 Chinese ice storm on forest ecosystems in southern China and found that while forest structures were substantially changed by the ice storm, forest greenness, as measured by satellite, recovered fairly quickly overall; however, moderately
damaged forests recovered the slowest as a conse-quence of salvage logging. These cold events can also interrupt ecosystem potential productivity dramati-cally. Huang et al (2013) observed the large reduction of GPP from Qianyanzhou Ecological Experimental Station in southern China as a result of ice storms in 2005 and 2008.
3.3. Extreme snow events 3.3.1. Extreme short snow season
Climate change is likely to shorten the duration of snow cover in mountainous regions such as the European Alps. In 2011, Europe experienced extre-mely warm spells in late winter. These events did not spare the Alps, and the Italian Aosta Valley region saw the earliest snowmelt for 65 years and the shortest snow season for 83 years. Galvagno et al (2013) examined how the short snow season modified the carbon balance of subalpine grassland in the region by eddy-covariance measurements. They observed that the extremely short snow season in the Alps led to a 100% increase in the annual net CO2 uptake. They found, interestingly, this larger carbon sink was attributable to smaller carbon dioxide emissions by TER during the shorter winter, rather than to enhanced plant activity and GPP during the longer summer.
3.3.2. Summer drought worsens impacts of bitter winter in Mongolia Plateau
‘Dzud’ in the Mongolian Plateau refers to a winter with extreme cold, heavy snowfall, reduced availability of forage and widespread mortality of livestock (John et al2013). Recently, the dzuds and droughts in the Mongolian Plateau have become more serious. Parti-cularly when a dzud is preceded by a summer drought, the combined summer drought–dzud often leads to even higher mortality of livestock (Fernández-Gimé-nez et al 2012). John et al (2013) identified such extreme events in the Mongolian Plateau during the period of 2000–2010 using precipitation and PDSI data, and examined the vegetation response to these extreme events using anomalies of vegetation indices. They concluded that the grassland biome on the plateau was more resilient to the extreme events than the desert biome.
4. Bark beetles
Global warming and drought are associated with expanding populations of forest insects and pathogens (Logan et al 2003), which cause widespread tree mortality and cascading ecosystem level disturbance impacts (Edburg et al2012). Severe outbreaks of bark beetles may coincide with or follow extreme droughts (Breshears et al2005), as stressed trees are unable to defend themselves from the attacking insects. Disrup-tion to the carbon cycle by beetle-induced mortality 5
has been compared with the carbon losses by forest fires in Canada (Kurz et al2008). In this focus issue, we provide four reports on climate-associated insect out-breaks and their impacts on carbon cycling in North America.
Over the last two decades, a widespread outbreak of bark beetles (Dendroctonus spp.) has affected tens of millions of hectares of conifer forests (Edburg et al2012). In an Idaho pine forest, aboveground car-bon stocks in trees were reduced by up to 50%, as shown by multispectral imaging and LIDAR (Bright et al2012). Most of the area in this region was moder-ately affected by the beetles, although small areas experienced severe mortality. An inventory-based analysis over the western United States found that the amount of carbon in trees killed by beetles exceeded that lost to forestfires (Hicke et al2013). These dis-turbances represent a loss of about 10% of the total carbon stock in Western US forests, comparable to the amount removed by logging activities. Although the impact of bark beetle-induced mortality is visually dramatic, their influence on carbon and water cycling may be less than anticipated. Using eddy covariance, Reed et al (2014) found that maximum carbon uptake by a Wyoming pine forest was not strongly altered despite the progression of mortality from 30% to nearly 80% in the tower footprint. They attributed the resilience of the ecosystem to enhanced light use effi-ciency by the surviving trees as the canopy opened.
The effects of defoliation on carbon cycling were evaluated using an ecosystem demography model that representsfine-scale canopy structure to scale up phy-siological processes (Medvigy et al2012). The model indicated that net ecosystem production decreased linearly with increasing defoliation by gypsy moths, but that the carbon cycle responses interacted with drought impacts. Drought-induced tree mortality was lower in scenarios including defoliation disturbance (Medvigy et al2012), possibly due to compensating processes such as enhanced water or nutrient avail-ability at intermediate disturbance levels (Reed et al2014).
5. Quantitative approaches
How to quantify relationships between the extreme events and their ecological consequences is a knowl-edge gap. In this focus issue, a few quantitative approaches have been demonstrated.
5.1. Tail Approach
The ecological consequences of extreme climate events can be mapped from remote sensing images with sharper changes in vegetation greenness and leaf area index, or can be identified by a large reduction in carbon uptake (GPP) with eddy-covariance measure-ments. Extreme events occur with small probability but with large amplitudes of changes in variables
characterizing the state of the terrestrial biosphere (Zscheischler et al2014). These extreme events can be defined as the occurrence of certain values in the tails of the probability distribution of the anomalies of the variables, similar to extreme weather defined by IPCC (Seneviratne et al2012). We call this method the‘tail
approach’. The question is how long the tails can be cut to define extreme events.
Zscheischler et al (2014) applied this approach to the terrestrial carbon balance by defining extremes to be outside a certain threshold q, which is defined by a percentile (i.e. 1%,…,10%) on the absolute values of the anomalies. They then defined an extreme event by spatiotemporally contiguous points whose values are larger than q (positive extremes) and smaller than−q (negative extremes), respectively. Zscheischler et al
(2014) reanalyzed four global MODIS-based GPP
datasets over the last 30 years and found that positive (extreme excess in carbon uptake) and negative (extreme reduction in photosynthetic carbon uptake) GPP extremes occurring on 7% of the spatiotemporal domain explained 78% of the global interannual varia-tion in GPP. Most of the negative GPP extremes (lar-ger than positive extremes) were attributed to droughts.
The tail approach depends on the shape of the probability distribution of the anomalies, and on their severity. The identification of extreme events requires that the shapes of probability distributions are similar so that comparison and analysis cross all sites can be made. However, it is impossible to have similar dis-tribution of probability of the anomalies on a global scale due to heterogeneous properties of vegetation from region to region. Liu et al (2013) developed a new method of using the Box–Cox transformation (Box and Cox1964) to convert non-normally distributed dataset into normally distributed dataset. They applied the new method to biweekly time series of global nor-malized difference vegetation index (NDVI) from 1982 to 2006 to investigate the extreme events on a global scale. They found that extreme NDVI events were aggregated in Amazonia and in the semi-arid and semi-humid regions in low and middle latitudes, while they seldom occurred in high latitudes. This NDVI data analysis indicates that precipitation was a major control on the NDVI extremes in low and middle lati-tudes, providing a consistent picture as by FLUXNET data synthetic analysis (Yi et al2010,2014).
5.2. Risk approach
Risk analysis is not a new method, but applying it to the understanding of interactions between extreme events and ecological resources is challenging. van Oijen et al (2013) introduced a simple probabil-istic method that can be used to assess ecosystem risks imposed by extreme climatic events. In this approach, risk is quantified as the product of two components: the probability of hazardous conditions and the 6
vulnerability of ecosystems to those hazardous condi-tions. The challenge in this approach is to determine the threshold values of hazardous climate conditions, which varies between ecosystems and can also evolve with time. They have used their method to analyze the risk of drought in European forests under recent (1971–2000) and future (2071–2100) climate condi-tions. Vulnerability is defined as the mean difference in primary vegetation productivity between non-drought and non-drought years.
5.3. Perfect-deficit approach
A perfect-deficit approach developed by Yi et al (2012) is different from the widely used, traditional method of the tails approach (extremefluctuations relative to
mean values). The nature of the perfect-deficit
approach is data-based. During observational period, a perfect growth (carbon uptake) curve can be constructed by the best growth of ecosystems across the years at the site. Thus, the growth curves of each year can be compared with the perfect growth curve. The difference between the perfect-growth curve and yearly growth curve is defined as deficit. Yi et al (2012) derived this approach based on GPP data measured from five grassland tower sites. They found strong links between GPP deficits and drought index. This approach can be applied to any continuous dataset of ecosystem–climate interactions. Therefore, the same extreme events can be cross-verified by different independent datasets.
Wei et al (2014) applied the perfect deficit approach to assess the effects of climate extremes on forest carbon assimilation capacity based on FLUX-NET data and MODIS GPP datasets. They found a strong link between periods of drought and reduced capacity of trees to absorb carbon. In particular, broadleaf (evergreen and deciduous) trees were very sensitive, whereas coniferous trees were less affected. This is because most broadleaf trees are adapted to generally well watered and good nutrient conditions, whereas needles are a specific adaptation that evolved to maximize carbon uptake in water-and tempera-ture-limited regions. Huang et al (2013) applied the perfect-deficit approach to explore how potential pro-ductivity of coniferous plantation forest was sig-nificantly reduced by extreme drought and ice storm. They found that temperature deficits rather than droughts were main drivers for the GPP deficits. 5.4. Climate mitigation
As illustrated in figure 1, more frequent extreme weather and drought events are likely to be associated with the warming climate. In this focus issue, we have collected evidence on how these warming-associated natural disturbances interrupted current terrestrial carbon dynamics. The disruption of the terrestrial carbon dynamics may trigger the potential climate– carbon feedbacks illustrated infigure2. Le Page et al
(2013) used the Global Change Assessment Model (GCAM) to test what successful climate mitigation should be undertaken with the natural disturbances. They studied scenarios of stable, increasing and decreasing natural disturbance rates, with all model runs stabilizing atmospheric carbon dioxide at a level that is expected to keep global temperature increase within a certain range above pre-industrial levels by 2095. They found that in the case of increased disturbance rates, resulting terrestrial emissions would have to be balanced by further deployment of low-carbon technologies for society to achieve a given level of mitigation. Under a carbon market policy, this implies increased carbon prices and mitigation costs up to 2.5 times higher in the most extreme scenario (doubling disturbance rates). As a case study, Camp-bell et al (2012) examined the strategic effects of future mountaintop coal mining on the carbon budget of the southern Appalachian forest region by ecosystem modeling andfield experiment data.
Acknowledgements
CY is grateful to the International Meteorological Institute for supporting him as a Rossby Fellow to complete this synthesis and review.
References
Ahrens C D 2000 Essentials of Meteorology: An Invitation to the Atmosphere 4th Edn (Pacific Grove, CA: Brooks/Cole) Babst F, Carrer M, Poulter B, Urbinati C, Neuwirth B and Frank D
2012 500 years of regional forest growth variability and links to climatic extreme events in Europe Environ. Res. Lett.7 045705
Box G E P and Cox D R 1964 An analysis of transformations J. R. Stat. Soc. Ser. B 26 211–52
Breshears D D et al 2005 Regional vegetation die-off in response to global-change-type drought Proc. Natl Acad. Sci. USA102 15144–8
Bright B C, Hicke J A and Hudak A T 2012 Landscape-scale analysis of aboveground tree carbon stocks affected by mountain pine beetles in Idaho Environ. Res. Lett.7 045702
Campbell J E, Fox J F and Acton P M 2012 Terrestrial carbon losses from mountaintop coal mining offset regional forest carbon sequestration in the 21st century Environ. Res. Lett.7 045701
Chang C-T, Wang H-C and Huang C-Y 2013 Impacts of vegetation onset time on the net primary productivity in a mountainous island in Pacific Asia Environ. Res. Lett.8 045030
Claesson J and Nycander J 2013 Combined effect of global warming and increased CO2-concentration on vegetation growth in
water-limited conditions Ecological Modelling256 23–30
Coumou D and Rahmstorf S 2012 A decade of weather extremes Nat. Clim. Change2 491–6
Cox P M, Pearson D, Booth B B, Friedlingstein P, Huntingford C, Jones C D and Luke C M 2013 Sensitivity of tropical carbon to climate change constrained by carbon dioxide variability Nature494 341–4
Edburg S L et al 2012 Cascading impacts of bark beetle-caused tree mortality on coupled biogeophysical and biogeochemical processes Frontiers in Ecology and the Environment10 416–24
Fisk J P, Hurtt G C, Chambers J Q, Zeng H, Dolan K A and Negrón-Juárez R I 2013 The impacts of tropical cyclones on
7
the net carbon balance of eastern US forests (1851–2000) Environ. Res. Lett.8 045017
Fernández-Giménez M E, Batkhishig B and Batbuyan B 2012 Cross-boundary and cross-level dynamics increase vulnerability to severe winter disasters (dzud) in Mongolia Glob. Environ. Change22 836–51
Galvagno M et al 2013 Phenology and carbon dioxide source/sink strength of a subalpine grassland in response to an exceptionally short snow season Environ. Res. Lett.8 025008
Hicke J A, Meddens A J H, Allen C D and Kolden C A 2013 Carbon stocks of trees killed by bark beetles and wildfire in the western United States Environ. Res. Lett.8 035032
Huang K, Wang S, Zhou L, Wang H, Liu Y and Yang F 2013 Effects of drought and ice rain on potential productivity of a subtropical coniferous plantation from 2003 to 2010 based
on eddy covarianceflux observation Environ. Res. Lett.8 035021
Hutley L B, Evans B J, Beringer J, Cook G D, Maier S W and Razon E 2013 Impacts of an extreme cyclone event on landscape-scale savannafire, productivity and greenhouse gas emissions Environ. Res. Lett.8 045023
Jung M et al 2010 Recent decline in the global land
evapotranspiration trend due to limited moisture supply Nature467 951–4
John R, Chen J, Ou-Yang Z-T, Xiao J, Becker R, Samanta A, Ganguly S, Yuan W and Batkhishig O 2013 Vegetation response to extreme climate events on the Mongolian Plateau from 2000 to 2010 Environ. Res. Lett.8 035033
Kang X M et al 2013 Effects of grazing on CO2balance in a semiarid
steppe:field observations and modeling Journal of Soils and Sediments13 1012–23
Kininmonth W 2010 Clausius-clapeyron and the regulation of global warming Fisica E 26 61–70
Kolb T, Dore S and Montes-Helu M 2013 Extreme late-summer drought causes neutral annual carbon balance in
southwestern ponderosa pine forests and grasslands Environ. Res. Lett.8 015015
Kurz W A et al 2008 Mountain pine beetle and forest carbon feedback to climate change Nature452 987–90
Le Page Y et al 2013 Sensitivity of climate mitigation strategies to natural disturbances Environ. Res. Lett.8 015018
Liu G, Liu H and Yin Y 2013 Global patterns of NDVI-indicated vegetation extremes and their sensitivity to climate extremes Environ. Res. Lett.8 025009
Logan J, Regniere J and Powell J A 2003 Assessing the impacts of global warming on forest pest dynamics Frontiers in Ecology and the Environment1 130–7
Lund M, Christensen T R, Lindroth A and Schubert P 2012 Effects of drought conditions on the carbon dioxide dynamics in a temperate peatland Environ. Res. Lett.7 045704
Medvigy D, Clark K L, Skowronski N S and Schäfer K V R 2012 Simulated impacts of insect defoliation on forest carbon dynamics Environ. Res. Lett.7 045703
Odum E P 1969 The strategy of ecosystem development Science164 262–70
Reed D E, Ewers B E and Pendall E 2014 Impact of mountain pine beetle induced mortality on forest carbon and waterfluxes Environ. Res. Lett.9 105004
Randerson J T et al 2006 The impact of boreal forestfire on climate warming Science314 1130–2
Seneviratne S I et al 2012 Changes in climate extremes and their impacts on the natural physical environment 109–230 Managing the Risks of Extreme Events and Disasters to Advance Climate Change Adaptation: A Special Report of Working Groups I and II of the Intergovernmental Panel on Climate Change
Seneviratne S I et al 2014 No pause in the increase of hot temperature extremes Nature Clim. Change4 161–3
Shao C, Chen J and Li L 2013 Grazing alters the biophysical regulation of carbonfluxes in a desert steppe Environ. Res. Lett.8 025012
Sun Y, Gu L, Dickinson R E and Zhou B 2012 Forest greenness after the massive 2008 Chinese ice storm: integrated effects of natural processes and human intervention Environ. Res. Lett.
7 035702
Teuling A J et al 2013 Evapotranspiration amplifies European summer drought Geophys. Res. Lett.40 2071–5
Vargas R 2012 How a hurricane disturbance influences extreme CO2fluxes and variance in a tropical forest Environ. Res. Lett.
7 035704
van Oijen M, Beer C, Cramer W, Rammig A, Reichstein M, Rolinski S and Soussana J-F 2013 A novel probabilistic risk analysis to determine the vulnerability of ecosystems to extreme climatic events Environ. Res. Lett.8 015032
Wei S et al 2014 Data-based perfect-deficit approach to understanding climate extremes and forest carbon assimilation capacity Environ. Res. Lett.9 065002
Wolf S, Eugster W, Ammann C, Häni M, Zielis S, Hiller R, Stieger J, Imer D, Merbold L and Buchmann N 2013 Contrasting response of grassland versus forest carbon and waterfluxes to spring drought in Switzerland Environ. Res. Lett.8 035007
World Meteorological Organization (WMO) 2013 The global climate 2001–2010: a decade of climate extremes Summary report (Geneva: World Meteorological Organization) no 1119
http://library.wmo.int/pmb_ged/wmo_1119_en.pdf
World Meteorological Organization 2011 Weather Extremes in a Changing Climate: Hindsight on Foresight (Geneva: World Meteorological Organization) no 1075
Xu X, Piao S, Wang X, Chen A, Ciais P and Myneni R B 2012 Spatio-temporal patterns of the area experiencing negative vegetation growth anomalies in China over the last three decades Environ. Res. Lett.7 035701
Yi C, Wei S and Hendrey G 2014 Warming climate extends dryness-controlled areas of terrestrial carbon sequestration Sci. Rep.4 5472
Yi C et al 2012 Climate extremes and grassland potential productivity Environ. Res. Lett.7 035703
Yi C et al 2010 Climate control of terrestrial carbon exchange across biomes and continents Environ. Res. Lett.5 1748–9326
Zhang L, Xiao J, Li J, Wang K, Lei L and Guo H 2012 The 2010 spring drought reduced primary productivity in southwestern China Environ. Res. Lett.7 045706
Zscheischler J et al 2014 A few extreme events dominate global interannual variability in gross primary production Environ. Res. Lett.9 035001
8