HAL Id: hal-01681604
https://hal.archives-ouvertes.fr/hal-01681604
Submitted on 20 Apr 2018
HAL is a multi-disciplinary open access
archive for the deposit and dissemination of
sci-entific research documents, whether they are
pub-lished or not. The documents may come from
teaching and research institutions in France or
abroad, or from public or private research centers.
L’archive ouverte pluridisciplinaire HAL, est
destinée au dépôt et à la diffusion de documents
scientifiques de niveau recherche, publiés ou non,
émanant des établissements d’enseignement et de
recherche français ou étrangers, des laboratoires
publics ou privés.
A pollen rain-vegetation study along a 3600 m
mountain-desert transect in the Irano-Turanian region;
implications for the reliability of some pollen ratios as
moisture indicators
Mehdi Dehghani, Morteza Djamali, Emmanuel Gandouin, Hossein Akhani
To cite this version:
Mehdi Dehghani, Morteza Djamali, Emmanuel Gandouin, Hossein Akhani. A pollen rain-vegetation
study along a 3600 m mountain-desert transect in the Irano-Turanian region; implications for the
reliability of some pollen ratios as moisture indicators. Review of Palaeobotany and Palynology,
Elsevier, 2017, 247, pp.133-148. �10.1016/j.revpalbo.2017.08.004�. �hal-01681604�
1
A pollen rain-vegetation study along a 3600 m mountain-desert transect in
the Irano-Turanian region; implications for the reliability of some pollen
ratios as moisture indicators
Mehdi Dehghani
a
, Morteza Djamali
b
, Emmanuel Gandouin
b
, Hossein Akhani
a
,
aHalophytes and C
4 Plants Research Laboratory, Department of Plant Sciences, School of Biology, College of Science, University of Tehran, 14155-6455 Tehran, Iran
bInstitut Méditerranéen de Biodiversité et d'Ecologie (IMBE), Aix-Marseille Univ, Avignon Université, CNRS, IRD, Technopôle Arbois Méditerranée, Bât. Villemin - BP
80, F-13545, Aix-en-Provence Cedex 04, France
c
Keywords:
Chenopodiaceae/Artemisia
pollen ratio Desert steppe, Iranian flora, Montane steppes, Pollen assemblage, Vegetation
Abstract
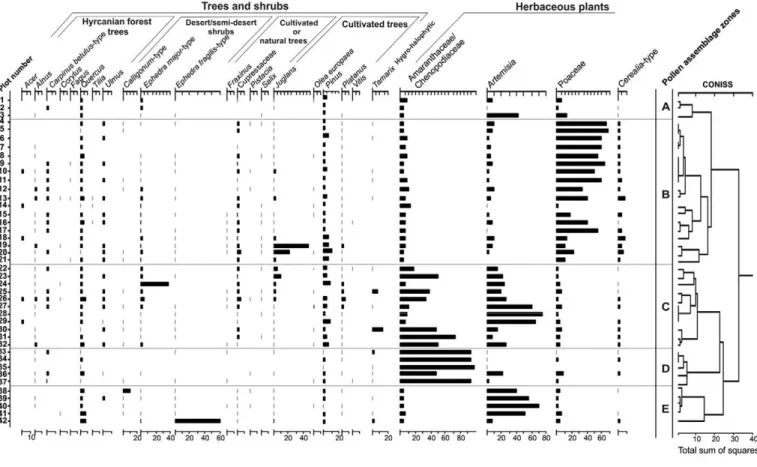
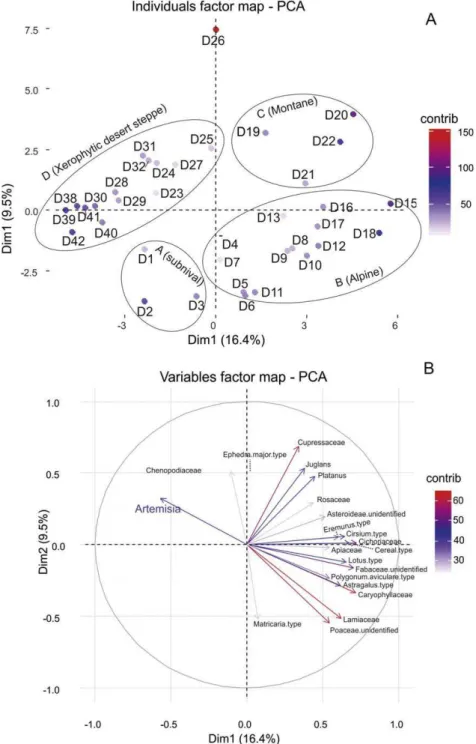
A set of 42 modern pollen samples has been investigated to determine the relationship between pollen percent-ages and vegetation composition along a 3600 m elevational mountain-desert transect in central Iran. The studied transect shows three main vegetation groups including a “high altitude zone” (embracing subnival, alpine and montane subzones), a “xerophytic desert steppe zone”, and a “halophytic zone”, correlated with the groups defined in Correspondence Analysis (CA) of vegetation dataset and Principal Component Analysis (PCA) of pollen dataset. The subnival subzone is characterized by high values of Asteraceae, Brassicaceae and Cyperaceae pollen, while alpine and montane subzones are characterized by the highest pollen diversity with a predominance of grass pollen along the whole transect. The halophytic zone is dominated by Chenopodiaceae pollen while xerophytic desert steppe shows a high occurrence of Artemisia pollen. The comparison of pollen percentages with the corresponding vegetation plots shows a high congruency between pollen and vegetation compositions of alpine subzone and undisturbed xerophytic desert steppe but a weak correlation between those of the subnival and montane subzones and human affected xerophytic desert steppe. In addition, pollen representation of frequently encountered or important plant taxa in the Irano-Turanian region is provided. The widely used Chenopodiaceae/ Artemisia = C/A pollen ratio, as an aridity index, is shown to be unreliable in the Irano-Turanian steppes. Our results suggest that a combined graph of all four indices (C/A pollen ratio, Poaceae/Artemisia = P/A, Poaceae/ Chenopodiaceae = P/C and (A + C)/P ratios) can represent the vegetation and climate relationships more accurately. In conclusion, surface pollen composition can reflect the actual vegetation zones/subzones in Irano-Turanian steppes. Together, P/A and P/C ratios are more confident to differentiate mesic from arid steppes, while C/A and (A + C)/P ratios provide a useful tool to differentiate halophytic desert vegetation developed in endorheic depressions with saline soils from xerophytic desert steppe developed in well-drained soils.
1. Introduction
A reliable regional calibration scheme of different plant taxa contributing in modern pollen assemblages is essential to correctly interpret fossil pollen spectra. In spite of expanding fossil pollen studies in the Middle Eastern countries since sixties (Wright, 1961; Van Zeist, 1967; Van Zeist and Bottema, 1977; El-Moslimany, 1983; Bottema, 1986; Bottema and Woldring, 1990; Tzedakis, 1994; Ramezani et al., 2008; Djamali et al., 2008, 2009b, 2016),modern surface pollen studies arequite scarce in the region (Wright et
al., 1967; El-Moslimany, 1990;Davies and Fall, 2001).
Corresponding author.
E-mail address: akhani@khayam.ut.ac.ir (H. Akhani).
In Iran, only four studies on modern pollen vegetation calibration have been published, two in the Euro-Siberian and two in the Irano-Turanian floristic regions. In the Euro-Siberian floristic region in northern Iran, comparison of surface pollen percentages with vegetation composition along a forest steppe transect in Golestan National Park in north-eastern Iran using descriptive and numerical approaches, helps to distinguish different vegetation types, with the worst correspondence found in transitional zones or ecotones (Djamali et al., 2009a). Ramezani et al. (2013) studieda 20 km long altitudinal transect in theSouth Caspian region which included only forest communities, providing some data on pollen production and dispersal of common place trees in central Hyrcanian forest in northern Iran.
In the Irano-Turanian region a set of sixty samples along four transects in the Zagros Mountains of western Iran was studied by Wrightet al. (1967). This was afirst attempt to interpret the fossil pollen data
2
obtained from a few sediment cores from lakes Zaribar (also Zeribar) andMirabad. They found that pollen rain assemblages taken from Mesopotamian steppes and piedmont pseudo-savannas contained high amounts of Plantago pollen, while those of oak woodlands and plateau steppes were characterized by high percentages of Quercus, and Artemisia, and chenopod pollen, respectively. However, their study suffered from two main limitations including lacking of numerical analysis and poor floristic data which was available at that time. Another study was done 15 years later in an arid region in northeastern corner of Central Iran, as a complementary study to palynological investigation of a late Holocene alluvial sediment core by
Moore and Stevensen (1982). They distinguished five vegetation types on
limestone outcrops, Ephedra zone, Zygophyllum zone, saline areas and disturbed areas in which 14 plots were taken subjectively, rather than a real transect along an ecological gradient. They showed that pollen of Artemisia and Chenopodiaceae dominates the pollen percentages and that C/A ratio is variable in different vegetation types with the highest value in saline areas with dominance of members of Chenopodiaceae. They also noted that arboral pollen is very scarce in the region with interesting presence of some tree pollen coming from south Caspian temperate forests by long distance dispersal.
Pollen ratios of Chenopodiaceae, Artemisia and Poaceae have been widely used as ecological indices in palynological studies (El-Moslimany, 1990; Van
Campo and Gasse, 1993; Davis and Fall,2001; Djamali et al., 2008; Zhao et
al., 2008). The Chenopodiaceae/Artemisia (C/A) pollen ratio as an aridity
index in open vegetation types (El-Moslimany, 1990)has received the highest attention by many authors,although its reliability in different environments has rarely been evaluated (Djamali et al., 2008; Zhao et al., 2012). A semi-quantitative aridity index ((A + C)/P) has also been proposed to determine moisture variability and delimitation of steppe from desert steppe. This palynological index is suggested to be supported as a trustworthy moisture index by sedimentological data and palaeoclimate reconstructions at millennial scale (Fowell et al., 2003).
Presenting a detailed study on quantitative pollen-vegetation rela-tionships in the Irano-Turanian floristic region is the subject matter of this paper. This region forms one of the richest floristic regions of the world with unique and remarkably diversified steppe vegetation covering an area of N6 million km2, housing more than 17,000 species in the Middle East and Central Asia (Davis et al., 1994). Here, we will study both vegetation and modern pollen assemblages along an exceptionally long mountain-desert transect of 3600 m elevation range and N150 km horizontal distance from Alborz mountains in northern Iran to the central Iranian deserts crossing a range of vegetation and bioclimatic zones (see Fig. 1B) in the heart of the Irano- Turanian region (sub-region IT2 sensu White and Léonard, 1991). We aim at:
1)Determining pollen contribution of different Irano-Turanian floristic elements and vegetation communities in surface samples to provide a calibration scheme for more accurate interpretation of fossil pollen diagrams in the region.
2)Verifying the ecological significance of Chenopodiaceae, Artemisia and Poaceae pollen values and ratios which are used by palynologists as aridity indices (El-Moslimany, 1983, 1987, 1990; Fowell et al., 2003;Djamali
et al., 2008; Zhao et al., 2012).
2. Study area
2.1. Physical setting
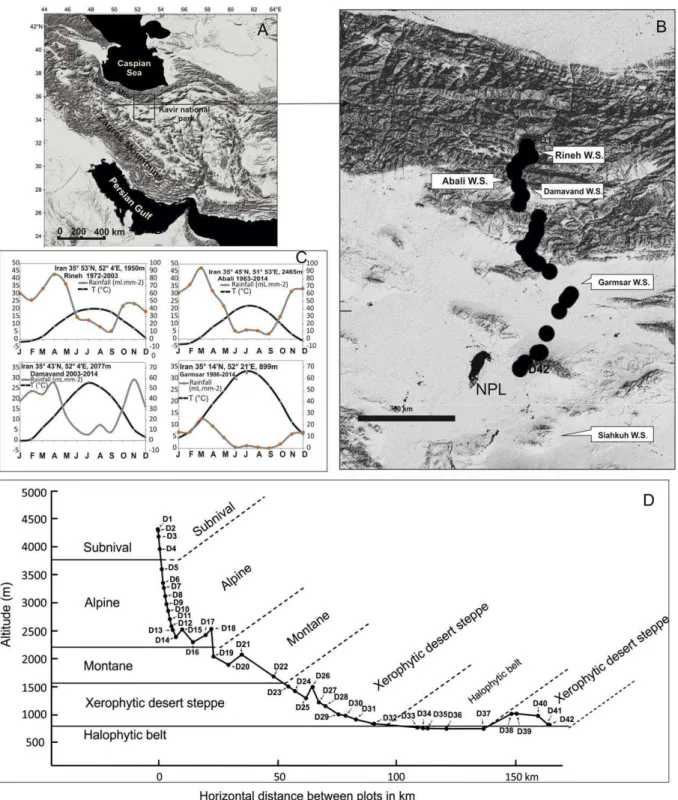
Our study area (Fig. 1) stretches from subnival zone close to upper vegetation limit of Damavand Volcano (35° 56′ 0.60″N, 52° 6′ 21″E, 4327 m) to Salt Playa Lake (Daryacheye Namak) in western Kavir National Park in central Iran (34° 40′ 42″N, 52° 4′ 21″E, 835 m). Damavand is a potentially active stratovolcano, located in the Central Alborz Mountains, in 60 km north-east of Tehran. The Damavand peak with 5671 m above sea level elevation is the highest summit in the Middle
East and also the highest volcano in Asia separating interior Iranian deserts from the Caspian Sea. Alborz Mountain Range, 650 km long, separates the south Caspian lowland (down to 26 m below sea level) with montane temperate deciduous forests on the northern flanks (Akhaniet al., 2010)from Irano-Turanian mountain steppes on the southernflanks (Akhani et al., 2013). The central Iranian plateau contains theKavir National Park/Kavir Protected Area with a surface area of 670,000 ha, located in the eastern edge of the Salt Playa Lake, which has been protected since 1964 (Rechinger and Wendelbo,
1976; Firouz, 1976). About 75% of this area which is part of an elevated
plateauof 650 to 850 m a.s.l., is almost equally composed of interfingering peneplain surface, saline soils, and salt-encrusted depressions (Krinsley, 1970). While theflanks of Damavand are mainly composed oftrachyandesitic lava flows and pyroclastic material with nutrient-rich soils, the Alborz Mountains are of various geological compositions from Tertiary volcaniclastic sediments to Mesozoic limestone and marl formations (Allen et
al., 2003; Davidson et al., 2004).
According to regional weather stations along the selected transect (Rineh, Larijan, Abali, Damavand, Garmsar and Siah Kuh), mean annual rainfall decreases steadily towards low elevations, ranging from 548, 538, 373, 117 to 68 mm/year respectively; while mean annual temperature increases in the same direction from 9.89, 9, 13, 19 and 19 accordingly. The meteorological stations along the studied transect as well as the climate diagrams showing the length of dry and humid periods are presented in Fig. 1. There is no meteorological data available for high elevations of our sampling sites but obviously the pattern of temperature and precipitation fluctuations is consistent along the whole transect. Similarly, Khalili (1973) showed that high altitudes of Alborz Mountain Range show strong continentality and that the mean annual precipitation increases with altitude in southern slopes of Alborz. In a bioclimatic point of view, our study transect crosses the Mediterranean Pluviseasonal-Continental, Mediterranean Xeric-Continental, and Mediterranean Desertic-Continental moving from north to south according to Global Bioclimatic Classification System (Djamali et al., 2011). The bioclimate is thus continental everywhere with increasing aridity and longer dry seasons southward.
3. Material and methods
3.1. Vegetation measurements and surface pollen sampling
3.1.1. Field works
From August to November 2014, an altitudinal study transect was defined along N150 km aerial distance from Damavand Volcano to Salt Playa Lake in central Iran across which the vegetation composition was quantified and the surface pollen samples were collected within
42 plots (Figs. 1A, B and D, and 2). All vegetation plots were of the same size (20 × 20 m) except for samples 14 (10 × 10), 23 (10 × 10),
24(10 × 10 m) and 35 (10 × 30 m) in which the physical conditions did not permit following exactly the protocol (Table 1). Since the selected transect was cut by roads and residential areas, sampling was done at 50–2000 m distances from the road side to avoid disturbances on the sampled vegetation plots.
3.1.2. Vegetation measurements and zonation
Vegetation measurements were performed following the methodology of Zürich-Montpellier school of plant sociology (Braun-Blanquet,1964)along elevational gradient from 4327 m to 765 m a.s.l. For eachvegetation plot all possible vegetation data were gathered and all taxa were identified based on regional references especially Flora Iranica (Rechinger, 1963–2015). The nomenclature follows mostly the Flora Iranica with updates of family Chenopodiaceae in Akhani et al. (2007). All 42 plots data were stored in TURBOVEG 2.15 for windows database (Hennekens and Schaminée, 2001). The final table from TURBOVEG was imported to JUICE 7.0.84 software
(Tichý, 2002). Using TWINSPAN method (Hill, 1979) the halophytic
3
Fig. 1. A. Location of the pollen-vegetation transect from Damavand Volcano to Salt Playa Lake (Daryacheye Namak) in Central Iran. B. Topographic map of the studied transect as well aslocations
of the meteorological stations along the transect (NPL: Namak Playa Lake). C. Climatic diagrams of meteorological data showing mean monthly temperature and mean monthly precipitation curves as well as the length of dry and humid periods. D. Topographic profile representing the elevational position of each sampling point against the main vegetation belts along the studied transect.
rest of plant communities by cut level 2. The montane to subnival main vegetation groups were subsequently separated from desert steppe plots by cut level 3. We continued clustering up to 9 cut levels and finally determined 5 vegetation zones. Furthermore, in each zone, communities/community groups were separated manually based on dominated and/or characteristic species. Because of the absence of a reliable syntaxonomical system and the fact that our plots could not cover all plant communities existing from the top of Damavand to the lowland desert, we did not classify all plant communities following Braun-Blanquet's nomenclature, but rather we named each community or
community group according to representative dominant and physiog-nomically important species.
3.1.3. Surface pollen sampling
Surface pollen samples were taken randomly at least from 20 points within the vegetation plots, either from moss polsters, plant detritus or soil samples according to the availability of each material. When all materials were present, the priority was given to moss polsters, plant detritus and soil in order of importance. The collected modern pollen
4
136
Fig. 2. Photographs of the vegetation belts along the studied transect. A. Subnival community near the peak of Damavand Mt. dominated byAchillea aucheriandDracocephalum aucheri
(Dracocephaletum aucheri). B. Alpine communities dominated by grasses and cushion-like plants. C. Artemisia steppe near Ghasre Bahram, Kavir National Park, dominated by Artemisia inculta. D. Halophytic community near Mobarakieh dominated by Halostachys belangeriana with scattered Tamarix shrubs. Photo credit: A, C, D (H. Akhani), B (M. Dehghani).
samples were then thoroughly mixed and kept in paper envelopes for subsequent laboratory treatments.
3.2. Pollen analysis of surface samples
Pollen sample preparation followed the modified procedure outlined by
Faegri and Iversen (1989) and that of Moore et al. (1991). The samples were
treated in 10% NaOH for an hour followed by multiple washing in water, sieving with a 160 µm mesh and treating with 37% HCl for 24 h in room temperature. Subsequently, samples were treated with 40% HF followed by retreatment with 37% HCl. Finally the samples were acetolysed and sieved at 10 µm mesh filter before being mounted between slides and coverslips in glycerol as a mounting medium. Pollen grains were identified and counted using a Nikon Eclipse E200 microscope at a magnification of × 500. On the average, 490 pollen grains per sample were tallied including the aquatic plants encountered in a few sampling quadrats (samples 4, 9, 12, 16, 19–20, 25–27). Pollen identifications were performed using the European and Mediterranean pollen collections as well as the “Middle East Pollen Reference Collection” (MEPRC) hosted at Institut Méditerranéen de Biodiversité et d'Ecologie with occasional use of pollen atlases of Europe and North Africa
(Moore et al., 1991; Reille, 1992, 1995, 1998; Beug, 2004). Pollen
percentages of each pollen taxon were then calculated based on the total pollen sum of terrestrial and aquatic taxa. Undetermined and damaged pollen and fern spores were excluded from the total pollen sum. A pollen diagram was then created (Fig. 4) based on calculated pollen percentages in TILIA-TGView software (Grimm, 2004, 2005).
3.3. Multivariate statistical analyses
We applied a number of multivariate analyses to two matrices of pollen and vegetation data. First and second runs of Correspondence Analysis (CA) on vegetation data revealed that samples taken in saline soils (plots D33–37) as well as plot number 14, sampled from an abandoned sand exploitation area, act as outliers and mask proper clustering of other plots (Fig. 1S). However, Principal Component Analysis (PCA) on
pollen data is not congruent with CA graph (Fig. 2S). Therefore, we decided to remove plot numbers D33–37, and D14 from both pollen and vegetation datasets. Finally, the matrix of pollen percentages versus vegetation plots was composed of 61 pollen types and 36 samples. Rare taxa (occur in only one sample) were removed from the analyses. The matrix was square-root transformed in order to stabilize the variance.
The vegetation matrix (72 plant taxa and 36 samples) was composed of plant abundances of Zürich-Montpellier vegetation-scale technique against plot numbers. In our multivariate analyses of vegetation data, we deliberately deleted most species including those with low abundances and those with occurrence in a limited number of plots. In our data matrix we used the same values recorded for Braun-Blanquet cover abundance scales (1, 2, 3, 4 and 5). The value 0 was arbitrarily given to species with less than 1% contribution in the vegetation, which are traditionally shown by a “+” instead of a figure.
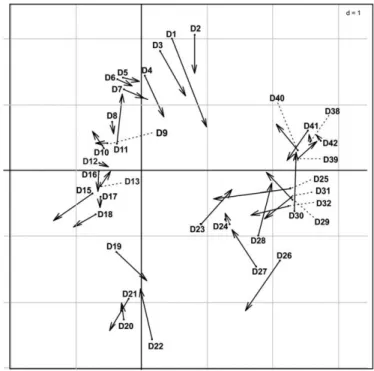
PCA and CA were applied to 61 (variables) × 36 (samples) matrix of pollen and 72 (variables) × 36 (samples) matrix of vegetation data, re-spectively, using the “Ade-4” and “factoextra” packages from the R software version 3.2.2 (R Development Core Team, 2012). Co-Inertia Analysis (CoIA)
(Dolédec and Chessel, 1994; Dray et al., 2003) was performed with the same
software using Ade-4 package. CoIA allows studying the common structure of a pair of data tables and to measure the adequacy between two data sets. CoIA is very flexible and is suitable for quantitative and/or qualitative or fuzzy environmental variables (Dray et al., 2003). A Monte Carlo permutation test, where the rows of one matrix are randomly permuted followed by a re-computation of the total inertia (Thioulouse et al., 1995) was used to check the significance of the co-structure of this CoIA.
4. Results and discussion
4.1. Vegetation communities and their floristic composition
A total of 312 plant taxa were encountered and identified (33 species only to generic level) in the 42 vegetation plots along the selected
5
Table 1A summary description of plant communities, location of sampled plots and the materials from which the pollen rain samples were taken. D = Debris, L = Lichen, M = Moss polster, S = Soil. Plots coordination: 1: 35°56′N, 52°6′21″E; 2: 35°55′58″N, 52°6′22″E; 3: 35°55′50″N, 52°6′25″E; 4: 35°55′34″N, 52°6′26″E; 5: 35°55′8″N, 52°6′14″E;6: 35°54′44″N, 52°6′16″E; 7: 35°54′32″N, 52°6′ 19″E; 8: 35°54′14″N, 52°6′23″E; 9: 35°53′59″N, 52°6′34″E; 10: 35°53′36″N, 52°6′30″E; 11: 35°53′13″N, 52°6′30″E; 12: 35°52′53″N, 52°6′41″E; 13: 35°52′46″N, 52°6′43″E; 14: 35°52′43″N, 52°7′49″ E; 15: 35°52′16″N, 52°6′9″E; 16: 35°50′50″N, 52°3′43″E; 17: 35°48′22″N, 52°1′53″E; 18: 35°47′5″N, 52°2′9″E; 19: 35°42′43″N, 52°3′39″E; 20: 35°39′25″N, 52°4′48″E; 21: 35°36′31″N, 52°3′36″E; 22:35°32′5″N, 52°10′38″E; 23: 35°28′47″N, 52°9′47″E; 24: 35°27′17″N, 52°9′55″E; 25: 35°25′N, 52°8′38″E; 26: 35°23′44″N, 52°8′11.90″E; 27: 35°22′27″N, 52°7′1″E; 28: 35°21′43″N, 52°5′25″E; 29:35°19′10″N, 52°7′18″E; 30: 35°17′49″N, 52°8′23″N, E; 31: 35°16′21″N, 52°10′36″E; 32: 35°13′44″N, 52°14′29″E; 33: 35° 6′4″N, 52°22′E; 34: 35°4′57″N, 52°21′14″E; 35: 35° 4′7″N, 52°20′29″E; 36:35° 0′22″N, 52°17′56″E; 37: 34°52′45″N, 52°13′35″E; 38: 34°46′21″N, 52°11′31″E; 39: 34°46′10″N, 52°10′22″E; 40: 34°42′50″N, 52°6′5″E; 41: 34°41′2″N, 52°4′19″E; 42: 34°40′42″N, 52°4′21″E.
Plot No. 1 2 3 4 5 6 7 8 9 10121318 171115 161419 Date (2014.X.XX) 8 . 1 5 8 .1 5 8 .1 5 8 .1 4 8 .1 4 8 .1 4 9 .0 7 9 .0 7 9 .0 7 9 .0 8 9 .0 8 9 .0 8 9 .0 9 9 .0 9 9 .0 8 9 .0 8 9 .0 9 8 .1 3 9 .0 9 Plot area (m2) 40 0 4 0 0 4 0 0 4 0 0 4 0 0 4 0 0 4 0 0 4 0 0 4 0 0 4 0 0 4 0 0 4 0 0 4 0 0 4 0 0 4 0 0 4 0 0 1 0 0 4 0 0 Altitude (m) 4295 4196 3974 3613 3364 3281 3 1 3 3 2 9 8 9 2870 2595 2598 2547 2 4 3 7 2722 2538 2310 0224205 5 Cover total (%) 25 85
80 58 80 75 80 85 58 90 90 90 75 08 100 75 60 90 Slope (degrees) 30 20 30 25 20 20 5 25 12 5 5 7 30 6 7 0 0 10 Aspect (degrees) S S S S S S S S S S N E W S S NE 0 0 E Species richness 6 19 19 22 27 25 36 38 03 48 37 26 38 37 36 34 4 34 Pollen source L,S S, D S , D M , S S , D S , D S , D S ,D S , D S , D S , D S , D S , D S , D S ,D S ,D S ,D S S, D
Shannon Diversity Index 1.4
6 3 3 2 . 2 6 2 . 4 1 2 . 6 3 2 . 4 2 . 9 8 2 . 3 .1 6 6 6 2 . 5 4 3 . 0 7 3 . 2 .6 5 9 2 . 8 4 2 . 3 7 2 . 9 4 2 . 3 7 0 . 9 8 2 . Zone A
Sub nival Alpine
Dracochephalum aucheri
A1 1 + 2 1 . . . . . . . . . . .
Achillea aucheri s. aucheri 2 2 + + . . . . . . . . . . . Draba siliquosa 1 + + . . . . . . . . . . . Erysimum caespitosum A11 1 1 1 . . . . . . . . . . . Veronica aucheri + + r . . . . . . . . . . . Carex pseudofoetida s. acrifolia . 1 3 . . . . . . . . . . . . Astragalus macrosemius . . 3 1 . . . . . . . . . . . Catabrosella parviflora A12 . . 2 2 . . . . . . . . . . . Cerastium purpurascens . . 2 r . . . . . . . . . . . Acantholimon demavendicum . . + + . . . . . . . . . . . Onobrychis cornuta s. cornuta . . . . 2 3 3 3 3 . . . 3 . + . . . . Minuartia lineata A2 . . . . 1 2 1 1 1 1 1 . . . . . . . . Melica jacquemontii s. jacquemontii . . . . . 1 + . + 1 . . . . . . + . . Cousinia harazensis
A21 . . . . 1 2 3 . . . . . . . . . . . .
Polygonum rottboellioides . . . . . 2 + + + . . . . . + . . . . Astragalus ochroleucus A22 . . . . . + . 2 1 1 . . . . . . . . . Galium verum . . . . . . . + + . 1 1 1 1 . 1 . . . Eryngium billardieri A3 . . . . . . . . . . + 1 2 + . 1 . . + Chondrilla juncea . . . . . . . . . . 2 1 . 1 1 1 + . . Stachys lavandulifolia . . . . . . . . . . 2 1 2 . 2 . . . 1 Dactylis glomerata A31 . . . . . . . . . . 2 1 . . . 1 . . .
Dianthus orientalis s. stenicalyx . . . . . . . . + . 2 2 . . . + . . . Arenaria gypsophiloides A32 . . . . . . . . . . . + 2 . . + . . . Acantholimon erinaceum . . . . . 2 + . . . . . 3 . . . . . 2 Achillea vermicularis A33 . . . . . 2 . . . . 1 Echinops elbursensis . . . . . 2 . . . . . A34 Astragalus compactus . . . . . . . . . . . 1 . . 4 . . . . Astragalus retamocarpus A34 . . . . . . . . . . 1 2 . . . 5 . . . Chaerophyllum macrospermum . . . . . . . . . . 2 . . . . 5 . . . Sophora alopecuroides A4 . . . . . . . . 3 . . Blitum virgatum A5 . . . . + . + . . . . . . . . 1 1 4 . Taeniatherum caput-medusae . . . . . . . . . . 3 Asperula glomerata . . . + . . . . . . . . . . + Dendrostellera lessertii A6 . . . . . . . . . . . Gundelia tournefortii . . . . . . . . . . . Cirsium congestum v. sorocephalum . . . . . . . . . . + Buffonia oliveriana . . . . . . . . . . + Cousinia eryngioides A7 . . . . . . . . . . Echinophora platyloba . . . . . . . . . . Tamarix ramosissima B1 . . . . . . . . . . . Anabasis setifera . . . . . . . . . . . Lycium ruthenicum . . . . . . . . . . . Tamarix serotina B2 . . . . . . . . . . . Tamarix arceuthoides . . . . . . . . . . . Artemisia aucheri/Artemisia sp. B3 . . . . . . . . . . . Leptalum filifolium . . . . . . . . . . . Reaumuria alternifolia B31 . . . . . . . . . . . Halothamnus subaphyllus B32 . . . . . . . . . . . Haloxylon ammodendron (cult.) B33 . . . . . . . . . . . Teucrium polium B34 . . . . . . . . . . . Stipa lessingiana . . . . + . . . . . . Kaviria aucheri B4 . . . . . . . . . . . Artemisia inculta . . . . . . . . . . . Acantholepis orientalis B41 . . . . . . . . . . . Pteropyrum aucheri . . . . . . . . . . . Lactuca glaucifolia . . . . . . . . . . . Xylosalsola richteri . . . . . . . . . . . Ephedra strobilaceum B42 . . . . . . . . . . . Halothamnus glaucus . . . . . . . . . . . Stipagrostis plumosa . . . . . . . . . . .
20 2122 0 2 1 0 . 0 2 1 0 . 0 3 1 0 . 4 0 0 4 0 0 4 0 0 1907 9699 208 1 8 0 85 85 1 5 5 0 E W 0 3 6 3 1 3 1 S , D S , D S 0 6 3 . 7 6 2 . 0 9 3 . Montane . . . . . . . . . . . . . . . . . . . . . . . . . . . . . . . . . . . . . . . . . . . . . . . . . . . . 1 . . . . . . . . . . . . . . . . . . . . . . . . . . . . . . . . . . . . . . . . 2 . . 1 + . 2 . . + . + 1 . .
+ + . + 2 + . 2 1 . . . . . . . . . . . . . . . . . . . . . . . . . . . . . . + . . . . . . . . . . . . . . . . . . . . . . . . . . . . . . . .
25 30262731 2932 2428 2338 3940 4142 37 33 34 3536 1 0 .0 3 1 0 .0 4 1 0 .0 3 1 0 .0 3 1 0 .0 4 0 4 1 0 . 1 0 .0 4 1 0 .0 3 1 0 .0 3 1 0 .0 3 0 2 1 2 . 0 2 1 2 . 0 1 1 2 . 0 1 1 2 . 0 1 1 2 . 0 2 1 2 . 1 0 .0 4 0 4 1 0 . 0 4 1 0 . 1 2 .0 2 4 0 0 4 0 0 4 0 0 4 0 0 4 0 0 4 0 0 4 0 0 1 0 0 4 0 0 1 0 0 4 0 0 4 0 0 4 0 0 4 0 0 4 0 0 4 0 0 4 0 0 4 0 0 3 0 0 4 0 0 310 8 20 1237 0 34 854 9 0 519 040 034 5 9 835 767 787 775 771 765 1 99 15 93 10 151 117 1 1 1 99 83 6 0 55 2 30 30 07 65 30 75 40 53 35 30 30 30 20 50 80 75 20 0 0 0 0 0 0 0 30 15 5 0 0 0 0 0 0 0 0 0 0 0 0 0 0 0 0 0 S W E 0 0 0 0 0 0 0 0 0 0 1 2 1 1 3 13 10 12 9 15 33 22 61 18 18 14 10 19 4 3 4 2 S S, D S S,D S S S S,D S, D S S S S S,D S, D S , D S S S S 1 .4 2.05 1.08 2.2 1 1 .8 7 7 8 1 . 1 .3 9 2 .4 2 2 .8 3 2 .3 2 3 9 2 . 0 5 2 . 6 3 2 . 2 8 2 . 9 4 1 . 7 2 . 1 .2 8 3 4 0 . 9 2 0 . 0 .4 8 Zone B Zone C
xerophytic desert steppe Halophytes
. . . . . . . . . . . . . . . . . . . . . . . . . . . . . . . . . . . . . . . . . . . . . . . . . . . . . . . . . . . . . . . . . . . . . . . . . . . . . . . . . . . . . . . . . . . . . . . . . . . . . . . . . . . . . . . . . . . . . . . . . . . . . . . . . . . . . . . . . . . . . . . . . . . . . . . . . . . . . . . . . . . . . . . . . . . . . . . . . . . . . . . . . . . . . . . . . . . . . . . . . . . . . . . . . . . . . . . . . . . . . . . . . . . . . . . . . . . . . . . . . . . . . . . . . . . . . . . . . . . . . . . . . . . . . . . . . . . . . . . . . . . . . . . . . . . . . . . . . . . . . . . . . . . . . . . . . . . . . . . . . . . . . . . . . . . . . . . . . . . . . . . . . . . . . . . . . . . . . . . . . . . . . . . . . . . . . . . . . . . . . . . . . . . . . . . . . . . . . . . . . . . . . . . . . . . . . . . . . . . . . . . . . . . . . . . . . . . . . . . . . . . . . . . . . . . . . . . . . . . . . . . . . . . . . . . . . . . . . . . . . . . . . . . . . . . . . . . . . . . . . . . . . . . . . . . . . . . . . . . . . . . . . . . . . . . . . . . . . . . . . . . . . . . . . . . . . . . . . . . . . . . . . . . . . . . . . . . . . . . . . . . . . . . . . . . . . . . . . . . . . . . . . . . . . . . . . . . . . . . . . . . . . . . . . . . . . . . . . . . . . . . . . . . . . . . . . . . . . . . . . . . . . . . . . . . . . . . . . . . . . . . . . . . . . . . . . . . . . . . . . . . . . . . . . . . . . . . . . . . . . . . . . . . . . . . . . . . . . . . . . . . . . . . . . . . . . . . . . . . . . . . . . . . . . . . . . . . . . . . . 4 . . . . . . . . . . . . . . . . . . . 1 . . . + . . . . . . . . . . . . . . . . 2 . . . . . . . . . . . . . . . . . . . 2 . . . . . . . . . . . . . . . . . . . 2 . . . . . . . . . . . . . . . . . . + + . 2 1 3 2 2 3 + . . . . . . . . . . . + 1 2 . 2 + . 2 + + + + . . . . . . . . + 1 + . . . . . + . . . . . . . . . . . . . . 2 . . . . . . . . . . . . . . . . . . . . 2 3 . . . . . . . . . . . . . . . . . . . . 1 + . + . . . . . . . . . . . . . . . . 2 + . . . . . . . . . . . . . . . . . . . . 3 . . . . . . . . . . . . . . . . . . . . 2 3 2 2 + 1 . . . . . . . . + . . . . 1 + + + + . + . . . . 1 . . . . . . 2 . . 2 1 + . . . . . . . . . . . . . . . + + + + + . . + . . . . . . . . . . . . . . . . . 2 1 1 . . . . . . . . . . . . . . . . . + 2 . . . . . . . . . . . . . . . . . . + . + . . . . . . . . . . . . . . . . . + + . . . . .