The effects of bar–spiral coupling on stellar kinematics in the Galaxy
Texte intégral
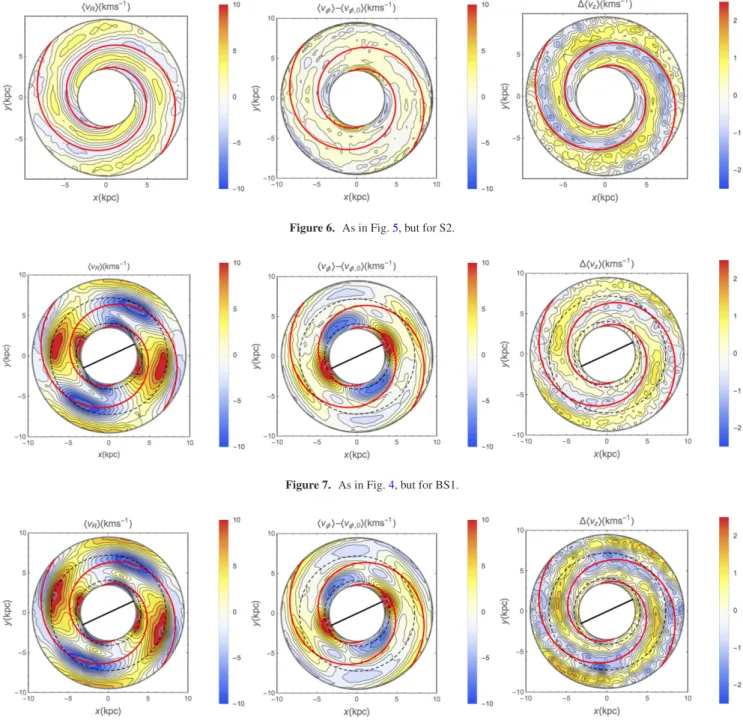
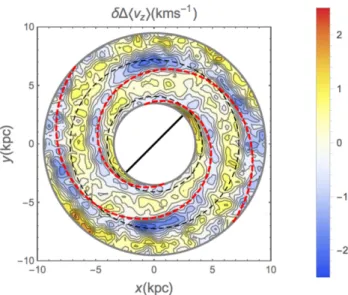
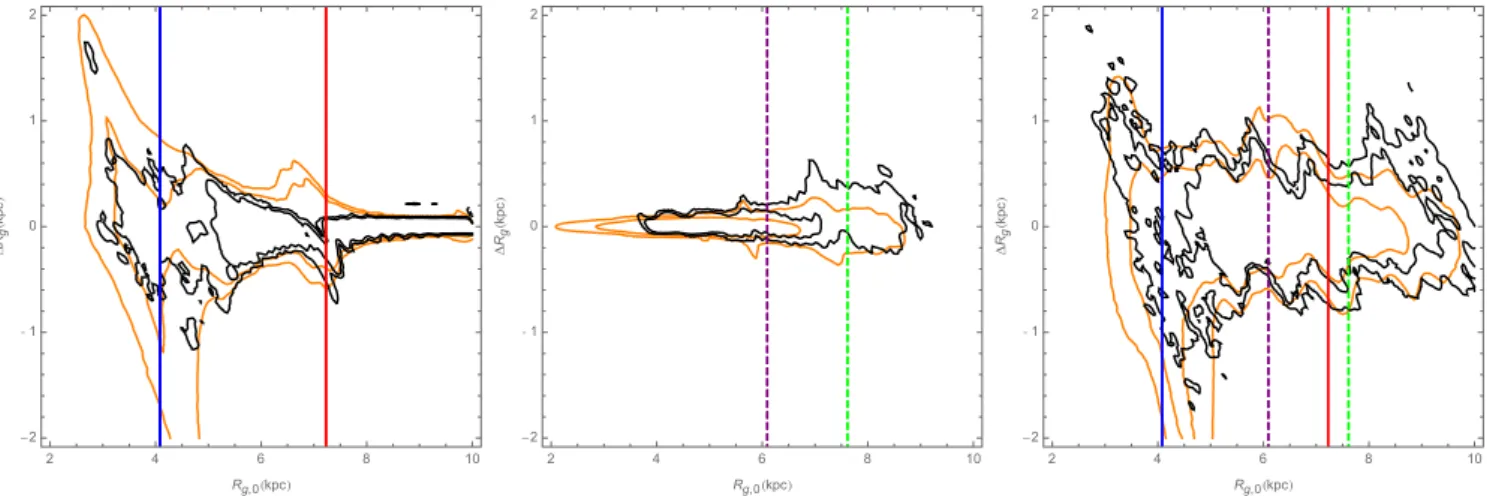
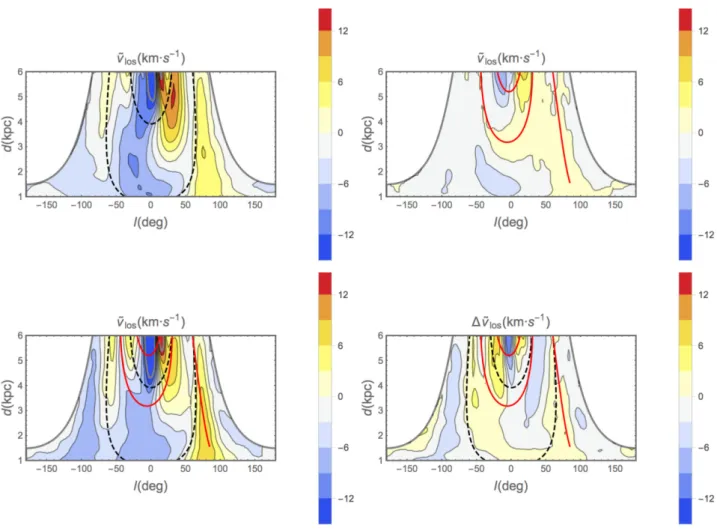
Figure
Documents relatifs
On the other hand, we show that the model with co-spatial thin and thick discs, which are mapped into the bulge by the bar, can naturally reproduce all the aforementioned trends;
We use common fields between the spectroscopic surveys of APOGEE, LAMOST, RAVE (ALR) and APOGEE, RAVE, Gaia-ESO (AGR) and use two stellar population synthesis models, GALAXIA
(a) MAR per mass distributions of paired measurements from primary murine B-ALL cells dependent on BCR-ABL or BCR-ABL T315I and treated with 1 µM imatinib, 100 nM ponatinib, or
Lorsque l’on prélève le cœur d’une grenouille, celui-ci peut continuer à battre plusieurs minutes lorsqu’il est placé dans un liquide convenable (automatisme cardiaque). Loewi
Thus, we next examined the copy numbers of various components of known molecular chaperone machiner- ies for which there is experimental evidence that they may form stable
*Évaluation orale : en utilisant ce que vous savez sur la contraction du bras, expliquez ce qui se passe au niveau des muscles lors de la flexion de la patte de grenouille.
The aim of the present study was to investigate the characteristics and outcome of acute ischemic stroke (AIS) patients suffering an early (within 24 h) major (defined as C8 point
Temps de travail des intérimaires en 2005 Trois quarts des intérimaires sont en mission moins de quatre mois sur l'année.. Durée cumulée des missions (en mois) Premier
