HAL Id: hal-00297993
https://hal.archives-ouvertes.fr/hal-00297993
Submitted on 8 Apr 2008HAL is a multi-disciplinary open access
archive for the deposit and dissemination of sci-entific research documents, whether they are pub-lished or not. The documents may come from teaching and research institutions in France or abroad, or from public or private research centers.
L’archive ouverte pluridisciplinaire HAL, est destinée au dépôt et à la diffusion de documents scientifiques de niveau recherche, publiés ou non, émanant des établissements d’enseignement et de recherche français ou étrangers, des laboratoires publics ou privés.
Microbiology and atmospheric processes: biological,
physical and chemical characterization of aerosol
particles
D. G. Georgakopoulos, V. Després, J. Fröhlich-Nowoisky, R. Psenner, P. A.
Ariya, M. Pósfai, H. E. Ahern, B. F. Moffett, T. C. J. Hill
To cite this version:
D. G. Georgakopoulos, V. Després, J. Fröhlich-Nowoisky, R. Psenner, P. A. Ariya, et al.. Microbiology and atmospheric processes: biological, physical and chemical characterization of aerosol particles. Biogeosciences Discussions, European Geosciences Union, 2008, 5 (2), pp.1469-1510. �hal-00297993�
BGD
5, 1469–1510, 2008 Bioaerosol characterization D. G. Georgakopoulos et al. Title Page Abstract Introduction Conclusions References Tables Figures ◭ ◮ ◭ ◮ Back Close Full Screen / EscPrinter-friendly Version Interactive Discussion Biogeosciences Discuss., 5, 1469–1510, 2008
www.biogeosciences-discuss.net/5/1469/2008/ © Author(s) 2008. This work is distributed under the Creative Commons Attribution 3.0 License.
Biogeosciences Discussions
Biogeosciences Discussions is the access reviewed discussion forum of Biogeosciences
Microbiology and atmospheric processes:
biological, physical and chemical
characterization of aerosol particles
D. G. Georgakopoulos1, V. Despr ´es2,3, J. Fr ¨ohlich-Nowoisky2,3, R. Psenner4, P. A. Ariya5, M. P ´osfai6, H. E. Ahern7, B. F. Moffett7, and T. C. J. Hill7
1
Agricultural University of Athens, Athens, Greece 2
Max Planck Institute for Chemistry, Mainz, Germany 3
Johannes Gutenberg University, Mainz, Germany 4
University of Innsbruck, Innsbruck, Austria 5
McGill University, W. Montreal, Canada 6
University of Veszprem, Veszprem, Hungary 7
University of East London, London, UK
Received: 31 January 2008 – Accepted: 9 February 2008 – Published: 8 April 2008 Correspondence to: D. G. Georgakopoulos ([email protected])
BGD
5, 1469–1510, 2008 Bioaerosol characterization D. G. Georgakopoulos et al. Title Page Abstract Introduction Conclusions References Tables Figures ◭ ◮ ◭ ◮ Back Close Full Screen / EscPrinter-friendly Version Interactive Discussion
Abstract
The interest in bioaerosols has traditionally been linked to health hazards for humans, animals and plants. However, several components of bioaerosols exhibit physical prop-erties of great significance for cloud processes, such as ice nucleation and cloud con-densation. To gain a better understanding of their influence on climate, it is therefore 5
important to determine the composition, concentration, seasonal fluctuation, regional diversity and evolution of bioaerosols. In this paper, we will review briefly the existing techniques for detection, quantification, physical and chemical analysis of biological particles, attempting to bridge physical, chemical and biological methods for analy-sis of biological particles and integrate them with aerosol sampling techniques. We 10
will also explore some emerging spectroscopy techniques for bulk and single-particle analysis that have potential for in-situ physical and chemical analysis. Lastly, we will outline open questions and further desired capabilities (e.g., in-situ, sensitive, both broad and selective, on-line, time-resolved, rapid, versatile, cost-effective techniques) required prior to comprehensive understanding of chemical and physical characteriza-15
tion of bioaerosols.
1 Introduction
Aerosols are a suspension of liquid, solid, or multiple-phases of condensed matter in the atmosphere with size ranges of ca. 0.001 to 100 µm. From the size-distribution, aerosols are divided into three categories: (1) nuclei mode (0.005 to 0.1), accumu-20
lation mode (0.1–2) and coarse mode (>2). The particle size is determined by the formation processes and subsequent atmospheric chemical and physical transforma-tions. Bioaerosols are a fraction of organic aerosols and are generally defined as living (e.g., bacteria, fungi, virus), dead, debris, or by-products of biological activities such as semi-volatile organic compounds and micromolecules. As bioaerosol defi-25
BGD
5, 1469–1510, 2008 Bioaerosol characterization D. G. Georgakopoulos et al. Title Page Abstract Introduction Conclusions References Tables Figures ◭ ◮ ◭ ◮ Back Close Full Screen / EscPrinter-friendly Version Interactive Discussion with large degree of variability in physical and chemical characteristics such as size,
shape, phase, composition, structure, solubility, volatility, hygroscopicity and surface properties. Bioaerosols can be single spore, pollen, bacteria and virus, to biological aggregates, to products and by-products as well as attached to non-biological parti-cles.
5
Bioaerosols may have a significant impact on climate, acting as cloud condensation nuclei and ice nuclei which can initiate precipitation. Aerosol particles of biological ori-gin (cells, cell fractions or organic matter of animal, plant and microbial oriori-gin) form a significant portion of atmospheric aerosols, sometimes reaching close to 50% numer-ically of all aerosol particles (Jaenicke, 2005). Research on bioaerosols has mostly 10
focused on their detection and enumeration related to public health hazards, and sev-eral methods for sampling, and measurement of aerosol number density, shape, opti-cal, and surface properties, chemical characterization of condensed and semi-volatile matter and identification of biological particles have been developed. There is not one technique, however, capable to fully capture the physical and chemical complexity of 15
biological matter.
Methods of characterization target either the entire cell or specific cell components in a sample of air or precipitation. Methods that target the entire cell involve microscopic examination, immunological identification, or, in the case of microorganisms, culture on various nutrient media. Methods to detect cell components are very diverse: they 20
target biochemical markers (proteins, fatty acids, sugars) or nucleic acids (DNA and RNA) and are often a combination of different strategies.
Biological ice nuclei (bacteria, pollen, plankton, lichens) are active at relatively warm temperatures, between −2 and −9◦C, a range where very few, if any, inorganic ice nu-clei are active. Although the ice nucleation property of various organisms has been 25
documented, detailed studies on the mechanism have been done only for bacteria. Several ice nucleation genes have been cloned from all known species with ice nucle-ation activity. The genes have been sequenced and the gene product, a protein on the outer cell membrane, has been isolated and its structure described (Warren, 1995).
BGD
5, 1469–1510, 2008 Bioaerosol characterization D. G. Georgakopoulos et al. Title Page Abstract Introduction Conclusions References Tables Figures ◭ ◮ ◭ ◮ Back Close Full Screen / EscPrinter-friendly Version Interactive Discussion For other ice nucleating organisms, the nature of the ice nucleation factor is not known.
Even if the gene responsible for this property is present in the genome, bacterial ice nucleation is not always fully expressed. Nutritional and environmental factors influ-ence this expression and the subsequent ice nucleation activity of the bacterium. It is not known if such variability exists in other organisms with ice nucleation activity. It 5
is possible to characterize all species present in an aerosol sample and identify those with reported ice nucleation activity. It is a lot more difficult, however, to directly prove that these species are ice nucleation active in situ.
Here we present the main methods that are used to characterize the biological com-ponent of aerosols, starting with methods to quantify and identify entire cells, followed 10
by methods to measure total biomass or specific cell components and those that allow quantification and identification of cells down to species level. We review the tech-niques for studying specific properties of individual biological particles. We also show that it is possible to identify and quantify a class of biological ice nuclei in bioaerosols, ice nucleation active bacteria, the best described biological ice nuclei.
15
2 Methods based on detection of entire cells, spores, pollen
2.1 Cell culture
Classic isolation techniques on nutrient media have been widely used to enumerate and characterize airborne bacteria and fungi (Lighthart, 1997; Andreeva et al., 2001; Bauer et al., 2002). These are collected by impaction on a filter or an agar surface 20
and, after incubation, visible colonies that develop are enumerated and subsequently identified. Bacteria are identified biochemically (Gram stain, metabolic profile of carbon sources, enzymes produced, pathogenicity, etc.). Fungi are identified mainly by mor-phological characteristics of spores and fruiting bodies. An advantage of this method is the compatibility with several types of air samplers, designed to be fitted with Petri 25
BGD
5, 1469–1510, 2008 Bioaerosol characterization D. G. Georgakopoulos et al. Title Page Abstract Introduction Conclusions References Tables Figures ◭ ◮ ◭ ◮ Back Close Full Screen / EscPrinter-friendly Version Interactive Discussion diversity of microorganisms in a bioaerosol, because only microorganisms that are
metabolically active and reproduce under the imposed culture conditions will be enu-merated, but not those in the viable but non-culturable state. In filtered air collected over Salt Lake City, Radosevich et al. (2002) found that only 0.08% of all bacteria were cultivable, while in cloud water samples collected at the Puy de D ˆome, France, 5
by Amato et al. (2005) the range was 0.02–0.8%. Interestingly, Tong and Lighthart (2000) recorded a high variability in summer above pastures of 0–50%, but typically <10%. As, there is no nutrient medium suitable for growth of all microorganisms, a variety of media and incubation conditions are necessary for a provisional assessment of bioaerosol diversity or enumeration of a selected group of microorganisms. For bac-10
teria, R2A, designed for stressed, water-borne heterotrophs, was recommended as a standard general medium by Kellogg and Griffin (2006), and when used with Trypticase Soy by Amato et al. (2007) did recover a wide diversity of Gram-positive and -negative species. However, to revive bacteria from a 3.6 km deep ice core sample, Christner et al. (2001) used 10 media. Even with groups considered amenable, culturing may 15
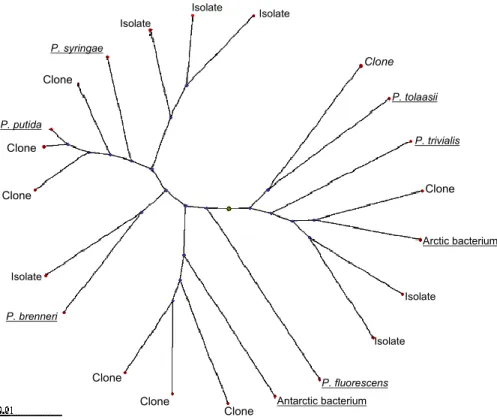
show bias. For example, when Pseudomonads isolated from a cloud sample on nutri-ent agar amended with cycloheximide were compared with Pseudomonads idnutri-entified in the same sample by direct DNA-based analysis using ARDRA (see below) the two sets tended to cluster into separate groups (Fig. 1).
Fungi are selectively isolated in acidified media and media containing antibiotics to 20
prevent bacterial growth. To eliminate variability in results, especially for microorgan-isms found in low numbers in bioaerosols, large sample sizes and replications are required. A source of variability is also the error associated with air samplers where air passes through holes: microorganisms that pass through the same hole and land on the agar surface may produce only one colony, thus underestimating their actual 25
number (manufacturers do provide statistical corrections for the number of microorgan-isms). In principal, however, we have to acknowledge that cultivation means selection, and the number of cultivable microorganisms in environmental samples is generally low (1% or less). Generally, unless one is interested in a particular group whose growth
BGD
5, 1469–1510, 2008 Bioaerosol characterization D. G. Georgakopoulos et al. Title Page Abstract Introduction Conclusions References Tables Figures ◭ ◮ ◭ ◮ Back Close Full Screen / EscPrinter-friendly Version Interactive Discussion requirements are well documented culturing is not a practical approach for community
characterisation.
2.2 Microscopy
Microscopic examination and enumeration of airborne biological particles is done with air samples that are drawn onto appropriate glass slides fitted on the sampler. Slides 5
are divided into grids and many (typically ≥30) fields of view are necessary to esti-mate the number of particles of biological origin in a given volume of air. Species identification is not possible without processing the sample with a technique designed to identify taxa or species, such as immunospecific staining with fluorescent dyes. To facilitate enumeration of fungal spores, for example, several stains that differentiate fun-10
gal spores from debris are available (Burge, 1995). Fungal spores and pollen are also identified by morphology, although it requires a significant level of expertise. Bacteria are normally counted after staining with a fluorescent dye that binds to DNA; however, a large number of bacteria must be present in the sample (over 104) to avoid errors. The number of bacteria in cloud water can be much lower (103l−1), thus special care 15
is necessary to prevent overestimation of cell densities (Sattler et al., 2001). Bacte-ria can also be drawn into a liquid which is subsequently concentrated for improved counting. An advantage of microscopy over culture techniques, especially when dyes such as acridine orange are used to detect viable cells, is the possibility to enumerate the non-culturable fraction of microorganisms, which may be significant. However, it is 20
possible to misidentify microorganisms from debris of non-biological origin. The use of fluorescent in situ hybridisation (FISH) with specific probes targeted at the small sub-unit of ribosomal RNA (16S rRNA) (Amann and Ludwig, 2000) is now a widely used tool to distinguish certain groups of bacteria or even clones (Pernthaler et al., 1998). For the creation of probes, see Sect. 3.3.2. The method also works in dilute samples 25
but seems to be limited by the number of ribosomes per cell. To overcome these prob-lems, Pernthaler et al. (2002) developed a method (CARD-FISH) that enhances the fluorescent signal by more than an order of magnitude. This method allows, in
princi-BGD
5, 1469–1510, 2008 Bioaerosol characterization D. G. Georgakopoulos et al. Title Page Abstract Introduction Conclusions References Tables Figures ◭ ◮ ◭ ◮ Back Close Full Screen / EscPrinter-friendly Version Interactive Discussion ple, counting of the number of cells by using a general probe for Bacteria or Archaea,
but detection of specific groups, genera or species is time consuming and limited by their total abundance.
2.3 Immunological detection
Immunological detection has been widely used to detect microorganisms of medical 5
or phytopathological significance. Antibodies isolated from the serum of inoculated animals can detect a number of different microorganisms. They are produced by the immune system of the animal as a reaction to specific antigens on the surface of the microorganism, such as proteins, polysaccharides, etc. It is therefore necessary to produce antibodies with specificity towards a single species, to avoid false positive 10
detection and errors in counts. Monoclonal antibodies offer increased specificity and may be useful for characterization of bioaerosols.
Antibodies can be used as vectors carrying a label to visualise a cell. Labels in-clude fluorescent dyes (fluorescence microscopy), enzymes (enzyme immunoassay) or a radioactive compound. In fluorescence microscopy, only cells to which the anti-15
body/fluorescent dye conjugate binds will be visible (fluoresce) under the microscope. Theoretically it should be possible to selectively stain and detect ice nucleation active bacteria, using an antibody with specificity for the ice nucleation protein. Although antisera against this protein have been produced they have not been useful to detect bacterial ice nuclei (D. Georgakopoulos, unpublished data). These methods have been 20
used to measure allergens in bioaerosols, and are compatible with bioaerosol sampling techniques (Chapman, 1995).
2.4 Flow cytometry
In flow cytometry, a suspension of cells (from culture or environmental samples) is passed rapidly in front of a measuring window. Light emitted from a source is scat-25
BGD
5, 1469–1510, 2008 Bioaerosol characterization D. G. Georgakopoulos et al. Title Page Abstract Introduction Conclusions References Tables Figures ◭ ◮ ◭ ◮ Back Close Full Screen / EscPrinter-friendly Version Interactive Discussion and chemical properties can be measured simultaneously. Autofluorescence or
indi-rect fluorescence of cells after labelling is also used to detect cells. Cell labelling is done with fluorochromes conjugated to taxa-, species- or protein-specific antibodies, or probes for nucleic acids. It is possible to differentiate live from dead cells, metabol-ically active from non-active cells, particles of biological and non-biological origin, and 5
to identify taxa, or even species. For bioaerosol samples drawn into a liquid, a mini-mum concentration of 1000 cells ml−1is necessary for detection. This limitation can be overcome by allowing for longer sampling times. Flow cytometry offers great speed in sample processing and identification. Automation allows for more accurate enumera-tion of biological particles in bioaerosols and flow cytometry has been used to monitor 10
biocontaminants in indoor aerosols (Birensvige et al., 2003; Stetzenbach et al., 2004; Chi and Li, 2005).
To identify bacterial ice nuclei in bioaerosols using flow cytometry, a specific anti-body recognizing the ice nucleation protein on cell membranes, or a nucleic acid probe specific for the IN gene conjugated to a fluorochrome, could be used.
15
3 Methods based on detection of cell components
3.1 General biomass measures
These are useful to determine the organic carbon content of aerosols, but the small biomass of cloud/rain samples limits the available methods. C:N:P ratios typical of organisms are often compared to marine plankton samples from where the classical 20
Redfied stoichiometry of 106:16:1 has been derived. However, as the group of Mikal Heldal from the University of Bergen, Norway, has shown for marine and freshwater bacteria, this ratio fluctuates over a wide range and may thus not be used as an unam-biguous indicator of living cells.
BGD
5, 1469–1510, 2008 Bioaerosol characterization D. G. Georgakopoulos et al. Title Page Abstract Introduction Conclusions References Tables Figures ◭ ◮ ◭ ◮ Back Close Full Screen / EscPrinter-friendly Version Interactive Discussion 3.2 Measures of ATP levels
Irrespective of the substrate metabolised the ultimate energy carrier for biosynthesis in all cells is ATP (adenosine triphosphate). Energy cannot be stored in ATP as it is transient and only produced when cells are active. For many years it has been used by soil scientists and food microbiologists as a measure of microbial viability. Amato 5
et al. (2007) were the first to measure ATP levels in cloud water and, based on the available figures for the amount of ATP per viable cell, concluded that the vast majority of bacteria in their eight samples were in a viable but non-culturable state.
3.3 Methods based on detection and analysis of nucleic acids
3.3.1 DNA/RNA isolation 10
One major limitation of DNA extraction is that all potential sources (e.g., bacterial cells, fungal spores or plant tissues) all require different extraction conditions. DNA is extracted either from liquid samples or filters. To settle particles in liquid samples a centrifugation force of 3000×g, for at least 20 min, seems to the minimum recom-mended, but ≥5000×g is preferable. If cloud water, rain or snow is collected directly 15
into RNAlater (essentially a saturated solution of ammonium sulphate made by Am-bion), to also preserve the RNA, it should be diluted to a final sample: RNAlater volume ratio of 1:1 immediately before centrifugation otherwise it may be too dense to allow the particles to settle (its density also requires that it be continuously stirred during collection). Since the pellet is often invisible and easily disturbed we recommend re-20
moval of the supernatant by aspiration. Filters can either be cut up and used directly for DNA extraction (so long as the filter used doesn’t bind DNA) or shaken to dislodge the aerosol particles. Peccia and Hernandez (2006) recommend shaking filters at 100 rpm for 12 h in conical flasks on a rotary shaker. However, we found that this may be too gentle and that additional intermittent vigorous shaking by hand was required.
25
BGD
5, 1469–1510, 2008 Bioaerosol characterization D. G. Georgakopoulos et al. Title Page Abstract Introduction Conclusions References Tables Figures ◭ ◮ ◭ ◮ Back Close Full Screen / EscPrinter-friendly Version Interactive Discussion should be chosen depending on the aims of the analysis (Despr ´es et al., 2007). In
com-parison to other commercial kits the FastDNA Spin kit for soil (Bio 101 Systems) used with Lysing Matrix E proved to be the most appropriate to extract DNA from different organisms (Bacteria, fungi, plants, animals, Archaea) on different filter materials (glass or quartz fibre, cellulose nitrate, polypropylene). Kits tend to use chaotropic guanidine 5
salts for lysis and are reliable and very convenient. However, we got higher DNA yields from bacteria and no carry-over of PCR-inhibiting salts using the surfactants SDS and CTAB (Ahern et al., 2007). Pre-digestion of the sample with both lysozyme (to digest cell walls, especially of Gram positives) and proteinase K (Read, 2001) is important, as is the use of bead beating to mechanically disrupt cells.
10
The subsequent PCR reaction can be inhibited by additional substances present in the samples, which bind to the template DNA or to the polymerase. This inhibition can be severe and prevent DNA amplification completely. The characteristics of such in-hibitory substances are only partly understood. It is for example known that humic acids act as inhibitory substances, and also that soot or sea salt particles might influence the 15
reaction. Preliminary observations reveal some patterns: the more air sampled and the finer the particles filtered (PM2.5vs. PM>2.5) the more inhibition; aerosols from highly industrialised cities show more inhibition than from smaller cities in rural regions; and we have found that samples from the coast can be very inhibited by the salt.
To reduce inhibition it is necessary to remove or minimize these inhibitors by per-20
forming additional purification steps or by reducing the amount of template DNA (and its co-extracted inhibitors)(see Peccia and Hernandez, 2006). However, we have found that reducing the quantity of DNA or increasing the amount of polymerase enzyme were often not successful (but worth testing). We do, however, recommend using kits for ex-tracting DNA from soils because they are designed to cope with common inhibitors 25
such as humic acids. In a careful comparison of methods, Kemp et al. (2006) rec-ommended repeated silica extractions, using Promega Wizard PCR Preps, to simply remove inhibitors. We have also found that running the genomic DNA though a 0.5% agarose gel is highly effective at removing inhibitory salts and tannins; the tannins run
BGD
5, 1469–1510, 2008 Bioaerosol characterization D. G. Georgakopoulos et al. Title Page Abstract Introduction Conclusions References Tables Figures ◭ ◮ ◭ ◮ Back Close Full Screen / EscPrinter-friendly Version Interactive Discussion ahead of the DNA enabling the high molecular weight DNA (>10 kb) to be cut out and
the gel used directly for PCR. Choice of Taq also matters; using the same extract some gave no product while others amplified well. In conclusion we found that there is no general strategy to overcome inhibition. For each reaction one needs to experiment empirically with the conditions, but especially with the extraction kit and the choice of 5
polymerase.
The high sensitivity of PCR introduces the risk of amplifying any trace amounts of contaminant DNA which, if undetected, may cause serious misinterpretation of the data. For example, Despr ´es et al. (2007) found that while glass fibre filters were sterile, up to 1 µg DNA was found on new polypropylene filters. However, contamination with 10
DNA or even bacterial or fungal spores can be avoided by decontamination prior to sampling. For example, filters can be autoclaved (and/or pre-soaked in 3% H2O2 for 2 h) or baked at 300◦C for 12 h. Peccia and Hernandez (2006) warn against relying upon autoclaving alone for decontamination. Gas plasma H2O2 sterilisation can be used on larger equipment. Additionally, gloves and breamed tweezers should be used 15
to avoid direct contact. In any case, it is necessary to extract blanks along with the samples to monitor for possible contamination, and if detected, such contamination can be analyzed and compensated for (Despr ´es et al., 2007).
Techniques can be used to discriminate between DNA from sources that are alive or active, although the distinction between these is debatable. RNA rather than DNA can 20
be isolated as this gives an indication of which cells are active. Alternatively a vital stain can be used and the viable cells obtained by flow cytometry. A simpler approach, EMA PCR, based on the same concept of membrane integrity but using ethidium monoazide, can be used to prevent DNA from dead cells being included in the analysis (Knut et al., 2004).
25
3.3.2 Using the Polymerase Chain Reaction (PCR) with bioaerosols
The PCR has revolutionised microbial ecology by facilitating the direct analysis of nu-cleic acids in any sample. It is used to copy, many million-fold, specific regions
(typi-BGD
5, 1469–1510, 2008 Bioaerosol characterization D. G. Georgakopoulos et al. Title Page Abstract Introduction Conclusions References Tables Figures ◭ ◮ ◭ ◮ Back Close Full Screen / EscPrinter-friendly Version Interactive Discussion cally <1000 bases) of the genome, providing enough for analyses. Often <100 target
molecules are sufficient template for a successful amplification, and a single bacterium or fungal spore can be detected in fully optimised reactions (e.g., Zeng et al., 2004).
The most common gene used for community analysis is the 16S rRNA gene (16S rDNA) found in the Bacteria and Archaea, and its analogue, the 18S rRNA gene (18S 5
rDNA), in animals and plants. It is an essential structural component of the ribo-some, a cell organelle which synthesises protein. Parts of its sequence are the same in all bacteria while others vary to differing degrees. This allows the conserved se-quences to be targeted for attachment of the two flanking primers that are required for PCR amplification, while intervening variable regions are used for analysis of diversity 10
and identification. Universal 16S and 18S primers are given in Despr ´es et al. (2007) and Ahern et al. (2007), and probeBase (http://www.microbial-ecology.net/probebase/) and probeCheck (http://131.130.66.200/cgi-bin/probecheck/content.pl?id=home) pro-vide comprehensive databases of rRNA primers and probes.
Often the PCR products are sequenced and then the next task is to determine the 15
identity of the DNA. This is achieved by comparing the new sequence to those already available by interrogating online databases. For 16S rDNA we recommend the Riboso-mal Database Project (http://rdp.cme.msu.edu/), containing over 400 000 sequences. The ARB database (http://www.arb-home.de/) contains many additional sequences but requires UNIX to run. For bacteria the generally accepted levels of discrimination are 20
99% similarity for strains, 97–99% for species and 95–97% for genera. Often a com-plete or very close match is obtained. Increasingly the closest matches are environ-mental clones which give little useful information other than where the sample origi-nated. For broader coverage to include other sources of DNA, the EMBL Nucleotide Sequence Database or one of its partners is recommended. This database is pro-25
duced in collaboration with GenBank (USA) and the DNA Database of Japan (DDBJ). Each collects a portion of the total sequence data reported and all sites are updated daily. The BLAST search engine provided by the National Center for Biotechnology Information (http://www.ncbi.nlm.nih.gov/BLAST/) is the easiest to search for closest
BGD
5, 1469–1510, 2008 Bioaerosol characterization D. G. Georgakopoulos et al. Title Page Abstract Introduction Conclusions References Tables Figures ◭ ◮ ◭ ◮ Back Close Full Screen / EscPrinter-friendly Version Interactive Discussion matches.
A recent approach to characterize bioaerosols used bacterial 16S rDNA genes in microarrays (Brodie et al., 2006). Microarrays are chips carrying sets of DNA from known genes in a predetermined order on the surface. The gene pool can be designed to represent a small or large group of organisms. DNA from environmental samples is 5
labelled, heated and allowed to hybridize with the DNA on the microarray. If comple-mentary sequences exist in both the sample and the microarray, then they hybridize and the sequence determined from the position of the fluorescence on the chip. Brodie et al. (2006) constructed a microarray carrying 16S rDNA genes from most known bac-terial taxa and used it to analyse the diversity and changes of the bacbac-terial microflora 10
in urban aerosol samples. Their method required several steps of normalization and appropriate statistical analysis, and was more sensitive in detecting bacterial taxa than the standard method of cloning and sequencing amplified 16S rDNA fragments.
To obtain greater resolution, other genes, or the regions between genes, can be used. For speciating fungi the spacer region between rRNA genes is used while for 15
plants the rbcL chloroplast gene provides additional taxonomic information (see De-spr ´es et al., 2007). To increase intrageneric discrimination within the Pseudomonads, Yamamoto et al. (2000) recommend the combined use of the gyr B and rpoD genes. However, there are no primers available to analyse virus particles in the same way, and considering their numbers and diversity this is a serious impediment.
20
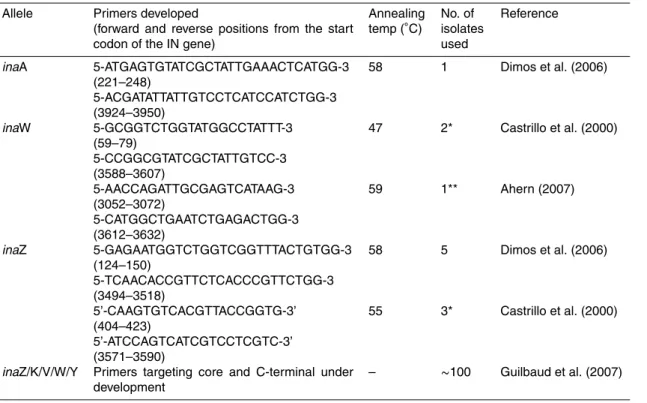
Most known alleles of the ice nucleation gene have been successfully amplified using PCR on mostly limited sets of isolates (see Table 1). Primers for inaW (P. fluorescens) have had only limited success, due to its variability; Ahern (2007) found three times greater sequence difference (in block 4 of the core and the C-terminal region) between two inaW genes (Warren et al., 1986) and isolate 26 in Castrillo et al. (2000) than 25
exists between inaZ, K and V. She recommended obtaining entire gene sequences, using shotgun cloning, from a range of isolates to assess its true diversity. Primers with broader range are being designed (Guilbaud et al., 2007). These target the inaW, inaY and inaZ, inaK and inaV alleles and have been tested on many diverse ice
nu-BGD
5, 1469–1510, 2008 Bioaerosol characterization D. G. Georgakopoulos et al. Title Page Abstract Introduction Conclusions References Tables Figures ◭ ◮ ◭ ◮ Back Close Full Screen / EscPrinter-friendly Version Interactive Discussion cleation active strains of P. syringae, P. viridiflava, P. fluorescens, P. putida, Panteoa
agglomerans and Xanthomonas campestris.
If RNA (e.g., 16S rRNA or the messenger RNA of an actively transcribed IN gene) is the target, the initial reverse transcriptase step (enzymatic conversion of the RNA to copy DNA) required for subsequent PCR is likely to be problematic. Sensitivity of the 5
reverse transcriptase enzyme to salts, alcohols or phenol remaining from the RNA iso-lation, and inhibition of the polymerase enzyme Taq by residual reverse transcriptase enzyme are just some of the causes of potentially gross under-estimation of RNA lev-els in such low copy number samples. Ahern (2007) attempted to quantify 16S rRNA from bacteria and Pseudomonads in two cloud water samples and obtained very low 10
apparent levels. She recommended that without extensive initial optimisation, RNA be restricted to use with methods assessing the presence or absence of specific rRNA sequences and not quantification.
3.3.3 Amplified Ribosomal DNA Restriction Analysis (ARDRA)
The mixture of PCR products obtained from an aerosol sample can be separated into 15
individual molecules by gene cloning. This involves joining individual PCR products to a self replicating vector which is then transformed into a host cell, usually E. coli. This is plated onto agar and when the host cell divides copies of the recombinant DNA molecule are passed onto the progeny. Following many cell divisions colonies (clones) are produced. Each of these contains a single 16S rDNA sequence from one bacte-20
rial cell present in the original mixture. A number of these (generally fifty to several hundred) can then be sequenced and the identity of members of the community deter-mined. To enable a larger number of clones to be analysed and so increase coverage each can first be re-amplified using vector specific primers and the product cut with a restriction enzyme to generate a banding pattern of between 2 and 8 fragments for 25
each clone (see Sect. 3.3.4). The choice of enzyme is crucial and has been assessed systematically (Moyer et al., 1996).The patterns are then sorted on the basis of the number and size of fragments into operational taxonomic units (OTUs) and
represen-BGD
5, 1469–1510, 2008 Bioaerosol characterization D. G. Georgakopoulos et al. Title Page Abstract Introduction Conclusions References Tables Figures ◭ ◮ ◭ ◮ Back Close Full Screen / EscPrinter-friendly Version Interactive Discussion tatives from each group sequenced (Moffett et al., 2003; Ahern et al., 2007). ARDRA is
fairly labour intensive but relatively inexpensive and combined with targeted sequenc-ing provides the identity of the dominant members of a community
3.3.4 Terminal Restriction Fragment Length Polymorphisms (T-RFLP) and Ribosomal Intergenic Spacer Analysis (RISA)
5
For the broad characterization of microbial community structure and diversity, T-RFLP can be applied. It also gives a very rough estimate of relative abundances. As T-RFLP was originally designed for bacteria, we outline here the method using bacteria as the default. T-RFLP can, however, also be applied to other organisms like fungi, where the ITS regions, the mostly non-coding spacer regions between adjacent rRNA genes, are 10
the most informative.
A PCR is performed in which the forward primer is fluorescently labelled. The am-plification products are then digested with a restriction enzyme which cuts the DNA at a defined site. For example, MspI cuts the sequenceCCGG
GGCC. The position of the cut site varies among the different bacterial groups and therefore the length of the labelled 15
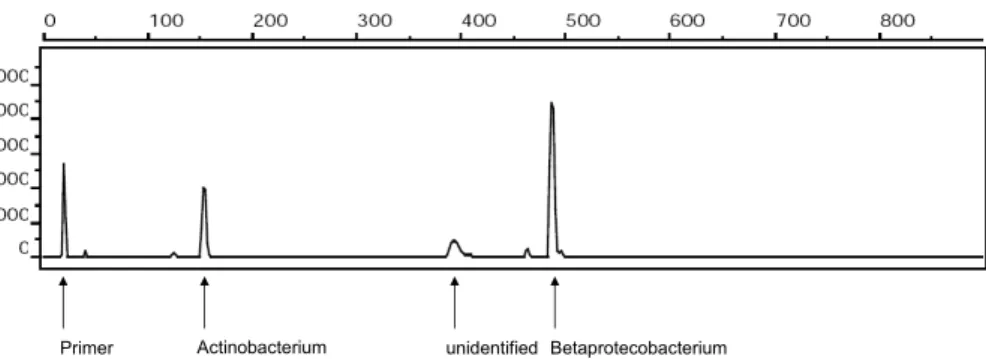
terminal fragment varies. After digestion the fluorescently-labelled end fragments are separated by electrophoresis and their lengths (position of the peak along the profile) and intensities (peak area) can be calculated (Fig. 2).
The diversity represented by a T-RFLP profile is highly dependant upon choice of enzyme and the part of the gene used to generate the terminal fragments. For example, 20
MspI is particularly good when used with the front of the 16S rRNA gene, using the primer 27f (confirmed on aerosols by Despr ´es et al. (2007) and rain water by H. Ahern, unpublished data). However, if used with the latter part of the gene, amplified using the primer 1390r, a single ≈25 bp peak is produced because most species possess a cut site near the primer. Primer and enzyme combinations can be tested on personal and 25
public 16S rRNA databases using T-RFLP simulation programs, available at MiCA 3 (http://mica.ibest.uidaho.edu/) and the Ribosomal Database Project II (http://rdp.cme.
BGD
5, 1469–1510, 2008 Bioaerosol characterization D. G. Georgakopoulos et al. Title Page Abstract Introduction Conclusions References Tables Figures ◭ ◮ ◭ ◮ Back Close Full Screen / EscPrinter-friendly Version Interactive Discussion msu.edu, release 8.1). Using MiCA 3 the following enzymes were predicted to produce
the most diverse profile using the front of the 16S gene to generate terminal fragments: Hpy 188III, HhaI, Scr FI, Hpy 188I and BfaI (MspI is in the top 10). One complication can be clusters of peaks. This is caused because the length of sequence to a common cut site can vary between species. The result is a mound of peaks which can be difficult to 5
resolve.
If the PCR products are simultaneously cloned and sequenced the size of the ter-minal fragment each will produce can be calculated, and so each can be tentatively assigned to a T-RF peak. Thus the relative abundance of taxonomically identified bac-terial groups can be judged. However, one should keep in mind that different bacbac-terial 10
groups can have the same restriction site and thus the relative amount can be mislead-ing. Also, since different bacteria possess from 1–15 copies of the 16S rRNA gene the size of the peak can only be considered a semi-quantitative guide to abundance.
Although the 16S region is particularly good for T-RFLP analysis it also has draw-backs. At least in air samples, bacteria, fungi and plant material are all sampled si-15
multaneously. As the DNA is extracted in one step, chloroplast 16S rDNA is often co-amplified with bacterial 16S DNA since, due to their common origin, they possess many similarities. This has to be considered in the interpretation.
In comparison with the analysis of clone libraries (ARDRA or direct sequencing of clones), T-RFLP is much faster and cheaper. If the former approach is used, ≥300 20
clones have to be analyzed to obtain reliable estimates of abundances and diversity levels in diverse samples. Thus for a fast overview of the diversity and relative abun-dances T-RFLP is highly useful. For a detailed analysis, however, subsequent se-quence analysis is necessary to, for example, detect species that produce the same T-RF peak.
25
Another useful approach to obtain a broad profile of community diversity is Riboso-mal Intergenic Spacer Analysis (RISA or ARISA when automated). This measures the length of the gap between the 16S and 23S rRNA genes, which can vary from 150 to 1550 bp (Scheinert et al., 1996; Maron et al., 2005). By amplifying the region in
BGD
5, 1469–1510, 2008 Bioaerosol characterization D. G. Georgakopoulos et al. Title Page Abstract Introduction Conclusions References Tables Figures ◭ ◮ ◭ ◮ Back Close Full Screen / EscPrinter-friendly Version Interactive Discussion all or a specific group of bacteria in a sample then separating the products by
elec-trophoresis a profile of peaks will be generated. Maron et al. (2005) performed ARISA on two air samples, revealing both to be highly diverse and distinct. As with T-RFLP, but to a lesser degree, one peak may be comprised of products of several species. But unlike T-RFLP, a single species may produce two or sometimes three peaks. This is 5
because the gap between the 16S and 23S genes can differ in different ribosomal RNA operons in a bacterium’s genome. In the five fully sequenced strains of Pseudomonas fluorescens and P. syringae, four have spacer regions all of one length (but unique for each strain) while one P. syringae strain has two (534 and 550 bp). Comparing eight Pseudomonads, Danovaro et al. (2006) found only one with two peaks in ARISA, 10
and clearly demonstrated the method’s superiority over T-RFLP with this genus. Even though ARISA has inherently greater resolving power (i.e., number of peaks produced per sample; see Danovaro et al., 2006), both greatly underestimate total diversity in diverse samples (Bent et al., 2007).
3.3.5 Denaturing/Thermal Gradient Gel Electrophoresis (D/TGGE) 15
The mixture of PCR products can also be separated by being run on a gel which sep-arates products on the basis of their internal sequence, which affects their melting be-haviour. PCR products are electrophoresed on a gel with a linearly increasing gradient of chemicals (DGGE) or temperature (TGGE). The fragments remain double stranded until the denaturing conditions cause melting of certain regions (domains). Products 20
with the lowest melting temperature domains (those with runs of A-T base pairs) melt first and the branching of the molecule causes a sharp decrease in mobility. As these molecules continue to move slowly into higher concentrations of denaturant, additional domains undergo strand dissociation. Single base changes in any of these domains will alter their melting temperature and so will lead to different mobilities. However when 25
the most stable domains melt the fragment undergoes complete dissociation and the resolving power of the gel is lost. To overcome this problem one of the PCR primers has a GC-rich “clamp” attached to it which resists the denaturing conditions of the gel
BGD
5, 1469–1510, 2008 Bioaerosol characterization D. G. Georgakopoulos et al. Title Page Abstract Introduction Conclusions References Tables Figures ◭ ◮ ◭ ◮ Back Close Full Screen / EscPrinter-friendly Version Interactive Discussion (Muyzer and Smalla, 1998; Myers et al., 1985).
The end result is a multiple-banded fingerprint of the community which is very useful for comparisons to determine if there is any value in pursuing a more detailed analysis. This is especially true for less complex communities such as those in extreme envi-ronments. Diverse samples may produce too many bands to be resolved. In addition 5
individual bands can also be cut from the gel and sequenced. One limitation is that only PCR products up to 500 bp can be separated efficiently. This limits the precision of subsequent identification based on sequence comparison. In addition single bac-teria can produce more than one band and resolution may be insufficient as products with different sequences may migrate to the same position on the gel (Ranjard et al., 10
2000), although to a lesser extent than T-RFLP.
An analogous technique to T/DGGE, in terms of technique and gel product, is Single Strand Conformation Polymorphism (Schwieger and Tebbe, 1998). Smalla et al. (2007) compared DGGE, T-RFLP and SSCP for their ability to fingerprint DNA extracts from four soils. T-RFLP and SSCP produced tighter clusters of replicate soil samples than 15
DGGE. Methodologically too, SSCP may be preferable to T/DGGE since the equipment is cheaper, it is easier to find compatible primers and it doesn’t need a gradient gel (Birgit Sattler, personal communication).
3.3.6 Quantitative PCR (qPCR)
A more recent technique, quantitative real-time PCR, can be used to not only detect but 20
also determine the number of copies of a chosen gene in a sample. As with standard PCR, depending on the gene and primers used the target for quantification can be broad (e.g., all bacteria using the 16S rRNA) or narrow (e.g., an ice nucleating species using a specific IN gene). If the number of copies of the gene per cell is known then it can be converted to cell counts or microbial biomass. qPCR is the only practicable 25
method available for accurate quantification of multiple samples, especially those with very low numbers of cells (<100).
BGD
5, 1469–1510, 2008 Bioaerosol characterization D. G. Georgakopoulos et al. Title Page Abstract Introduction Conclusions References Tables Figures ◭ ◮ ◭ ◮ Back Close Full Screen / EscPrinter-friendly Version Interactive Discussion reaction proceeds. The number of PCR cycles needed to first detect the product (the
threshold cycle) is then used to determine the number of copies present at the start. If there very few target molecules then more replication cycles are needed before the product is first detected (and vice versa). The threshold cycle is proportional to the log of the initial DNA concentration, and the number of gene copies is determined by 5
reference to a calibration curve generated using DNA from known numbers of cells, spores or quantity of mycelium. Calibration curves are typically linear over at least 5 orders of magnitude. Conversion of 16S rRNA gene copy number to cell number can introduce error since different species of bacteria possess from 1–15 copies of the gene per cell; in Pseudomonads it varies from 4–7. Fogel (1999) reported an average of 3.8 10
copies per cell of the 16S gene per bacterial species, and in leachate and nitrifying biofilm we estimated an average of 3.5.
One approach to monitor product accumulation uses the dye Sybr Green which only fluoresces when it binds to double stranded DNA. A great advantage of using Sybr Green is that it is simple and cheap to convert standard PCR to quantitative. However, 15
reaction optimization is essential to ensure amplification of only the target, since any non-specific product will also be detected. Primers also combine with each other during PCR to form small double-stranded primer-dimers, and fluorescence from these needs to be minimised by measuring fluorescence at a temperature high enough for them to have dissociated. Alternatively, fluorophore-containing DNA probes, such as TaqMan, 20
Hyb-probes, molecular beacons and scorpion probes can be added to the reaction mix. These are designed so that they will only fluoresce if they are annealed to the correct target sequence. As the product accumulates, the level of fluorescence increases pro-portionally. They use different mechanisms to report annealing (e.g., bound TaqMan probes are digested by Taq polymerase, freeing the fluorophore from a quencher em-25
bedded in the probe) but share several features: they provide very specific and reliable detection of the amplified gene, but require careful design and optimisation, and are more costly and emit less light than Sybr Green.
BGD
5, 1469–1510, 2008 Bioaerosol characterization D. G. Georgakopoulos et al. Title Page Abstract Introduction Conclusions References Tables Figures ◭ ◮ ◭ ◮ Back Close Full Screen / EscPrinter-friendly Version Interactive Discussion can differentially affect the rates of amplification of the samples versus the standards,
and cause underestimation of the samples’ true gene copy number. The principal problem is from inhibitors co-extracted with the DNA which can inhibit the PCR of each sample to differing degrees (e.g., Gr ¨untzig et al., 2001). Jansson and Leser (2004) noted that the extrapolation to an external standard curve used by qPCR is not well 5
suited to environmental samples because a small variation in the PCR reaction effi-ciency can produce large differences in product yield in later cycles. An improvement, sigmoidal curve-fitting, has been suggested by Rutledge (2004). Samples can also be spiked with a known number of copies of the targeted gene and the level of inhibition estimated.
10
We have used qPCR on DNA extracted from orographic cloud water (Bowbeat, Scot-tish borders) to count the total number of 16S rDNA genes (i.e., all bacteria) and the number of 16S genes contributed by the Pseudomonads. Detection used Sybr Green I. The total number of bacterial 16S genes was around 8300 copies ml−1 cloud water whereas the number contributed by the Pseudomonads was about 150. Provisional 15
analyses indicate that this ratio corresponded reasonably well with the clone frequency of Pseudomonads using ARDRA. qPCR enables rapid investigation of multiple sam-ples for the abundance of any chosen phylogenetic group and key functional genes. Development of primers that will detect and quantify all IN gene alleles is an urgent priority.
20
3.3.7 Dominant bacteria in bioaerosols using DNA-based methods
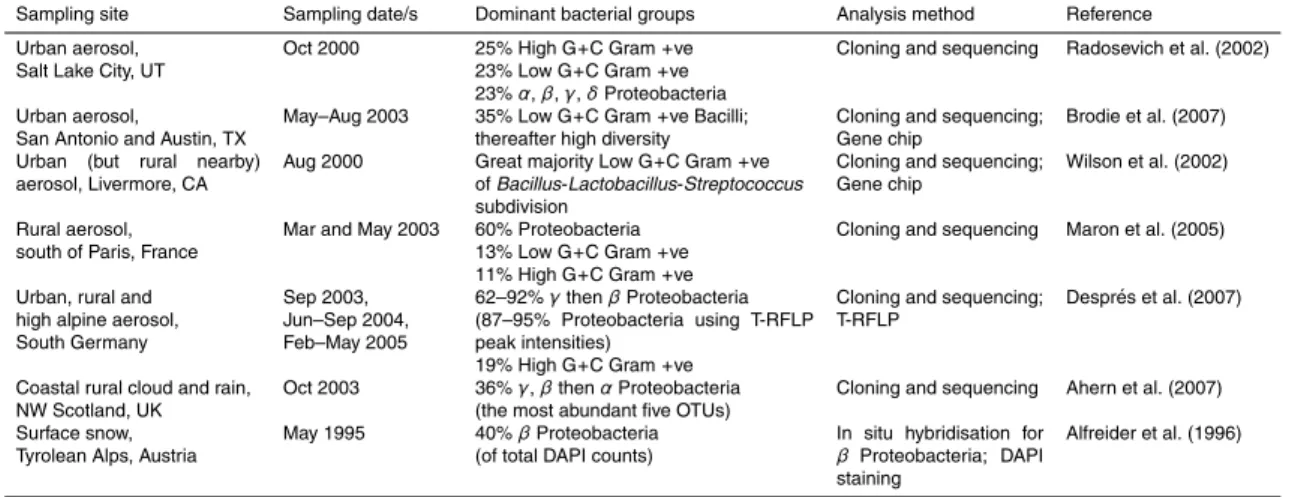
While culture-based studies of atmospheric aerosols indicate dominance by Gram-positive bacteria (e.g., Kellogg and Griffin, 2006) direct DNA-based methods reveal a more diverse assemblage, with an intriguing suggestion of a predominance by the High and Low G+C Gram-positives in the USA but a higher relative abundance of 25
the Proteobacteria (especially the β and γ subdivisions) in Europe (Table 2). Using culturing, Amato et al. (2007) found that Gram-positives are more abundant than the Proteobacteria in winter, and vice versa, but no such clear trend is apparent from these
BGD
5, 1469–1510, 2008 Bioaerosol characterization D. G. Georgakopoulos et al. Title Page Abstract Introduction Conclusions References Tables Figures ◭ ◮ ◭ ◮ Back Close Full Screen / EscPrinter-friendly Version Interactive Discussion studies.
4 Physical and chemical characterization of biogenic atmospheric particles – single-particle methods
The physical and chemical characterization of atmospheric particles traditionally in-volves the study of bulk samples. However, since biological particles form a small 5
fraction of the total aerosol, the analysis of bulk samples rarely produces detailed in-formation on the properties of such particles. In contrast, studies of individual particles can provide data on the sizes, shapes, compositions, structures, and surface proper-ties of any types of particles. Various microscope and spectroscopic methods are now routinely applied in atmospheric science, but single-particle studies specifically aimed 10
at understanding the atmospheric effects of biological particles are scarce. Below we review the techniques, both established and emerging, that have been used or are potentially useful for studying specific properties of individual biological particles.
In general, the distinct types of biogenic particles have well-defined size ranges and characteristic shapes that enable their identification using microscope techniques (Ta-15
ble 3). The larger particles, including spores and pollen, can be studied using optical microscopy (OM) and epifluorescent microscopy (described in Sect. 2.2). Scanning electron microscopy (SEM) in combination with energy-dispersive X-ray spectrometry (EDS) has been used for studying single atmospheric particles since the 1980s (An-derson et al., 1988; van Borm et al., 1989). In the past two decades SEMs equipped 20
with field-emission guns became available and their improved spatial resolution made the observation of the morphologies of bacteria and viruses also possible (Ebert et al., 2004). Using secondary electron images, the three-dimensional shapes of the parti-cles can be visualized. Chemical information is usually obtained using an EDS detector attached to the microscope. EDS analyses of the concentrations of light elements (in-25
cluding C, N, and O) are generally inaccurate or semi-quantitative at best (Os ´an et al., 2000; Worobiec et al., 2003); thus, elemental compositions are not generally useful
BGD
5, 1469–1510, 2008 Bioaerosol characterization D. G. Georgakopoulos et al. Title Page Abstract Introduction Conclusions References Tables Figures ◭ ◮ ◭ ◮ Back Close Full Screen / EscPrinter-friendly Version Interactive Discussion for the identification of specific biological components. Nevertheless, on the basis of
size, shape, and elemental composition, the particles can be confidently assigned into relatively broad categories such as “marine”, “crustal”, or “biogenic” (Ebert et al., 2004; de Hoog et al., 2005; Laskin et al., 2006). A great advantage of SEM is that particle analysis can be automated and thousands of single particles can be analyzed in each 5
sample.
Transmission electron microscopy (TEM) provides the highest specificity among the microscope methods for the analysis of several particle properties. The sizes and the two-dimensional projected shapes of any types of biological particles, including bac-teria and viruses, are conveniently studied using TEM (Matthias-Maser and Jaenicke, 10
1994; P ´osfai et al., 2003; Niemi et al., 2006). The high resolution of the TEM permits the observation of minute details within particles. Particle aggregations and thus the degree of internal mixing of the individual components of the aerosol can be assessed. A unique capability of TEM is that the structures of particles can be studied using electron diffraction (ED). Structural information is used for identifying crystalline sub-15
stances and for obtaining a better understanding of the structure-dependent properties of amorphous particles (P ´osfai et al., 1995; Kis et al., 2006).
Elemental compositions can be obtained in the TEM by using EDS or electron energy-loss spectroscopy (EELS). Compared to EDS analysis in the SEM, the TEM provides more spatial detail within individual and potentially complex particles; how-20
ever, the TEM is operated manually, and much fewer particles can be analyzed than in an automated SEM. EELS is particularly suited for the study of light elements (such as C, N, and O) that are important in biological particles (Katrinak et al., 1992; Chen et al., 2005). By selecting energy windows at specific core-loss regions of the EEL spectrum, it is possible to obtain compositional maps that show the distributions of the selected 25
elements within the particles. This technique is usually referred to as energy-filtered TEM (EFTEM), and is gaining popularity in the study of atmospheric particles (May-nard, 1995; P ´osfai and Moln ´ar, 2000; Maynard et al., 2004; P ´osfai et al., 2004; Hand et al., 2005; Chen et al., 2005). A major limitation of EFTEM is that the particles have
BGD
5, 1469–1510, 2008 Bioaerosol characterization D. G. Georgakopoulos et al. Title Page Abstract Introduction Conclusions References Tables Figures ◭ ◮ ◭ ◮ Back Close Full Screen / EscPrinter-friendly Version Interactive Discussion to be thin (<100 nm in the case of organic particles) for a meaningful analysis.
Since TEM micrographs provide only two-dimensional projections of the studied ob-jects, it has been a problem to obtain reliable data about the third dimensions of par-ticles. As demonstrated recently, accurate three-dimensional morphological data can be obtained from atmospheric particles using electron tomography (ET) (van Poppel et 5
al., 2005). ET involves the acquisition of a series of images taken at different specimen tilt angles. If the tilt range is large enough (at least ∼±70◦), and images are obtained at 1◦ or 2◦ intervals, the shape of the particle can be reconstructed from the series of images. Although ET is time-consuming and cannot be performed on a large number of particles, it can provide important data for particles that have complex shapes. Since 10
shapes significantly affect the optical properties of particles, ET will likely emerge as a useful tool in the study of individual atmospheric particles, including those of biogenic origins.
Since in most studies that are concerned with the atmospheric effects of particles the objective is a general characterization of the aerosol, the specimens are, in gen-15
eral, not prepared in any special way to preserve biological structures. Moreover, in conventional SEM and TEM the sample is in vacuum and thus dehydrates and its mor-phology may change, potentially making it impossible to recognize the particles. These problems have been partly overcome by recent developments of electron microscopes in which the sample can be studied in low-vacuum conditions. The environmental SEM 20
(ESEM) is now an established tool in the study of atmospheric particles, and has been used for characterizing the hygroscopic behaviour of a variety of particle types and for studying heterogeneous surface reactions (Ebert et al., 2002; Krueger et al., 2003; Kaegi and Holzer, 2003). Environmental TEM (ETEM) is an emerging technique that has only been used in a handful of atmospheric studies but, on account of the superior 25
resolution of TEM, appears to hold great promise for the analysis of biological particles (Wise et al., 2005). Certainly, near-atmospheric conditions in the sample chambers of both the ESEM and the ETEM can only be achieved at the expense of the image resolution of the corresponding high-vacuum instruments. Yet, the use of ESEM and
BGD
5, 1469–1510, 2008 Bioaerosol characterization D. G. Georgakopoulos et al. Title Page Abstract Introduction Conclusions References Tables Figures ◭ ◮ ◭ ◮ Back Close Full Screen / EscPrinter-friendly Version Interactive Discussion ETEM offers exciting new possibilities for the study of biogenic atmospheric particles.
Atomic force microscopy (AFM) appeared as a promising complementary technique to the electron microscope methods for studying atmospheric particles (Friedbacher et al., 1995; P ´osfai et al., 1998; Barkay et al., 2005). AFM operates under ambi-ent conditions and so the shapes of the particles are not affected by the vacuum as in 5
conventional SEM and TEM studies. In a controlled specimen environment both the hy-groscopic and chemical behavior of aerosol particles can be observed (K ¨ollensperger et al., 1999; Ramirez-Aguilar et al., 1999). However, the lack of direct compositional information and artifacts arising from the interactions between the cantilever tip and the specimen has hindered the widespread use of AFM in atmospheric science. Neverthe-10
less, AFM could prove to be the method of choice for solving specific problems related to the surface properties of bioaerosol particles.
All microscope methods are offline: the samples have to be collected on a surface, then stored and studied under various conditions, all of which can potentially change the properties of the original particles. Aerosol mass spectrometry (AMS) is immune 15
from such problems, since AMS provides almost real-time analysis of aerosol parti-cles. Typically, airborne particles enter a vacuum chamber, where single particles are detected and sized by a continuous laser beam, and then ablated and ionized by a laser pulse. The resulting ions are analyzed using a time-of-flight mass spectrome-ter. Both positive and negative ion mass spectra can be collected. There are several 20
major types of instrumental setups for obtaining mass spectra of individual aerosol particles, the discussion of which is beyond the scope of the present study. Depend-ing on the particular type of instrument, several acronyms are in use, includDepend-ing AMS, PALMS (Particle Analysis by Laser Mass Spectrometry), ATOFMS (Aerosol Time-Of-Flight Mass Spectrometry), and MALDI (Matrix-Assisted Laser Desorption/Ionization 25
Mass Spectrometry). Details about the various AMS methods can be found in recent reviews by Sullivan and Prather (2005) and Murphy et al. (2006).
In addition to being an effectively real-time method, the main advantage of AMS is its high sensitivity. Very low concentrations (<0.01 µg m−3) of both inorganic and
or-BGD
5, 1469–1510, 2008 Bioaerosol characterization D. G. Georgakopoulos et al. Title Page Abstract Introduction Conclusions References Tables Figures ◭ ◮ ◭ ◮ Back Close Full Screen / EscPrinter-friendly Version Interactive Discussion ganic constituents can be detected. The AMS is also used for the quantitative chemical
analysis of single particles, although the results are affected by ionization efficiencies and matrix effects, which make the reliable analysis of both inorganic components and organic molecular compositions difficult. Nevertheless, by the analysis of fragment ions that are specific to distinct microorganisms, the types of viruses, bacteria, and 5
fungi present in the air can be assessed on an individual-particle basis. The analysis of biomarker ions forms the basis of bioaerosol mass spectrometry (BAMS), a new and highly efficient method for the detection of both spores and vegetative cells of air-borne pathogens and bio-terrorism agents (Russell et al., 2004, 2005; Tobias et al., 2005; van Wuijckhuijse et al., 2005; Beddows and Telle, 2005). AMS is now a widely 10
used single-particle method in aerosol science, with unique capabilities for obtaining species-specific data from biogenic particles. However, the detailed chemical compo-sition and structural information can still not be produced using today’s AMS protypes. Fourier Transform Infrared Spectroscopy (FTIR) and Nuclear Magnetic Resonance (NMR) Spectroscopy (Posfai et al., 1994; Blando et al., 1998; Ariya et al., 2002; Soban-15
ska et al., 2003; Liu et al., 2005; Cote et al., 2008) for biomaterial atmospheric analysis are grouped here together because the information available from both methods, and thus their strengths and drawbacks, are similar. A larger fraction of the material is amenable to analysis than with chromatographic methods (Blando et al., 1998), and the sample need not necessarily be pre-fractionated or extracted, although it may in 20
fact be further fractionated before NMR (Decesari et al., 2000, 2001; Sannigrahi et al., 2006), or rinsed with successive solvents between FTIR spectra (Blando et al., 1998; Maria et al., 2003).
Similarly, FTIR provides functional group information which can be used to compare samples to material of known origin or age. An FTIR study of organic aerosols in the 25
Smoky Mountains (Blando et al., 1998) determined the size distribution of compound classes, including carbonyls and organosulfur compounds, finding that much of the material was polar, and showed that FTIR could characterize amounts of material too small to be analyzed chromatographically. FTIR with successive solvent rinses showed
BGD
5, 1469–1510, 2008 Bioaerosol characterization D. G. Georgakopoulos et al. Title Page Abstract Introduction Conclusions References Tables Figures ◭ ◮ ◭ ◮ Back Close Full Screen / EscPrinter-friendly Version Interactive Discussion that a variable fraction (60–90%) of organic material in size-fractionated aerosols in the
Eastern Caribbean free troposphere was hydrophobic; functional groups in each size fraction were quantified. Functional groups may also be summed to estimate total organic carbon (Blando et al., 1998; Zappoli et al., 1999; Maria et al., 2002, 2003; Decesari et al., 2007; Gilardoni et al., 2007; Samburova et al., 2007), avoiding some of 5
the artifacts which affect TOCA.
5 Conclusions
Detection, quantification and characterization of particles of biological origin in aerosols, including microorganisms, pollen, plankton, plant and animal debris, etc., is necessary to understand the role and the effects of bioaerosols in a number of 10
processes, from physical effects, such as ice-nucleation, to atmospheric chemistry, ecology, and health effects. It is generally believed that the biosphere (for example vegetation) influences and perhaps drives climatic changes. Bioaerosols have been recently suggested as a potentially important factor, but their climatic role remains un-determined. What is the contribution of different bioaerosols to significant atmospheric 15
processes such as ice nucleation or cloud condensation? To address these, we need a clearer picture of the composition, seasonal fluctuation, regional diversity and evolution of bioaerosols. In this paper we have described and reviewed current and emerging methods for the characterisation of bioaerosols. Most were developed to monitor hu-man, animal and plant health hazards, and therefore were designed to detect one or 20
a few groups of organisms. For example, methods to characterize microorganisms in bioaerosols have too often relied on isolation and culture. It now seems that reports of numbers of microorganisms in bioaerosols where the culture method was used may have grossly underestimated the true number by one to four orders of magnitude. Me-teorologists often question the effect of biotic components in aerosols on precipitation, 25
an argument based on published numbers of bacteria and fungi in atmospheric sam-ples which were considered too small to have an impact. However, estimations were
BGD
5, 1469–1510, 2008 Bioaerosol characterization D. G. Georgakopoulos et al. Title Page Abstract Introduction Conclusions References Tables Figures ◭ ◮ ◭ ◮ Back Close Full Screen / EscPrinter-friendly Version Interactive Discussion in most cases produced using culture methods. Even less work has been done to
de-termine the number of plant, virus or animal fragments in bioaerosols and very little is known about their potential effect on atmospheric processes. For example, what might be the effect of secondary bioaerosol components (e.g. protein crystals) which may no longer be associated with nucleic acids? Or particles of mixed composition? 5
From a meteorological perspective, it is important to know the actual composition of a bioaerosol in order to evaluate or model the role of individual components as ice nuclei or cloud condensation nuclei which potentially trigger precipitation. To this end, only pollen and certain bacteria have been characterized as ice nuclei; the ice nucleation property of certain bacteria has been well studied, but for pollen and other biogenic ice 10
nuclei nothing is known about the factors that determine their ice nucleation proper-ties. It is therefore important that future research is coordinated, in characterizing the composition, seasonal fluctuation and evolution of ice nucleation and cloud condensa-tion components (starting perhaps with the most abundant), toward understanding the role of the individual components. We would like to point out that significant progress 15
in characterizing the role of bioaerosols in atmospheric processes could be achieved with a reverse strategy: characterize the biological (or non-biological) nature of parti-cles that already have exhibited interesting properties such as ice nucleation by using sampling methods for in situ isolation of ice nuclei from aerosols near the ground or in the atmosphere. New methods of bioaerosol characterization that can be integrated 20
into methods and equipment used in cloud physics should be developed, to serve the integration of research from the various disciplines of microbiology, meteorology, molecular biology, cloud physics and cloud chemistry.
References
Ahern, H. E.: Cloud Borne Bacteria: Community Composition and Potential Impact on
Atmo-25
spheric Nucleation, PhD Thesis, University of East London, 2007.
BGD
5, 1469–1510, 2008 Bioaerosol characterization D. G. Georgakopoulos et al. Title Page Abstract Introduction Conclusions References Tables Figures ◭ ◮ ◭ ◮ Back Close Full Screen / EscPrinter-friendly Version Interactive Discussion
from Hebridean cloud and rain water produce biosurfactants but do not cause ice nucleation, Biogeosciences, 4, 115–124, 2007,
http://www.biogeosciences.net/4/115/2007/.
Alfreider, A., Pernthaler, J., Amann, R., Sattler, B., Glockner, F. O., Wille, A., and Psenner, R.: Community analysis of the bacteria assemblages in winter cover and pelagic layers of a high
5
mountain lake using in situ hybridization, Appl. Environ. Microb., 62, 2138–2144, 1996. Amann, R. and Ludwig, W.: Ribosomal RNA-targeted nucleic acid probes for studies in
micro-bial ecology, FEMS Microbiol. Rev., 24, 555–565, 2000.
Amato, P., Menager, M., Sancelme, M., Laj, P., Mailhot, G. D., and Delort, A.-M.: Microbial population in cloud water at the Puy de D ˆome: implications for the chemistry of clouds,
10
Atmos. Environ., 39, 4143–4153, 2005.
Amato, P., Parazols, M., Sancelme, M., Laj, P., Mailhot, G., and Delort, A.-M.: Microorganisms isolated from the water phase of tropospheric clouds at the Puy de D ˆome: major groups and growth abilities at low temperatures, FEMS Microbiol. Ecol., 59, 242–254, 2007.
Amato, P., Parazols, M., Sancelme, M., Mailhot, G., Laj, P., and Delort, A.-M.: An important
15
source of micro-organisms for cloud water at the Puy de D ˆome (France), Atmos. Environ., 41, 8253–8263, 2007.
Anderson, J. R., Aggett, F. J., Buseck, P. R., Germani, M. S., and Shattuck, T. W.: Chemistry of individual aerosol particles from Chandler, Arizona, an arid urban environment, Environ. Sci. Technol., 22(7), 811–818, 1988.
20
Andreeva, I. S., Belan, B. D., Borodulin, A. I., Buryak, G. A., Zhukov, V. A., Panchenko, M. V., Penenko, V. V., Petrishchenko, V. A., and Safatov, A. S.: Variability of the content of live microorganisms in the atmospheric aerosol in southern regions of Western Siberia, Doklady Biol. Sci., 381, 530–534, 2001.
Ariya, P. A., Nepotchatykh, O., Igntova, O., and Amyot, M.: Microbiological degradation of
25
organic compounds in the atmosphere, Geophys. Res. Lett., 29, 341–344, 2002.
Barkay, Z., Teller, A., Ganor, E., Levin, Z., and Shapira, Y.: Atomic force and scanning electron microscopy of atmospheric particles, Microsc. Res. Techniq., 68(2), 107–114, 2005.
Bauer, H., Kasper-Giebl, A., Loflund, H., Giebl, H., Hitzenberger, R., Zibuschka, F., and Puxbaum, H.: The contribution of bacteria and fungal spores to the organic carbon content
30
of cloud water, precipitation and aerosols, Atmos. Res., 64, 100–119, 2002.
Beddows, D. C. S. and Telle, H. H.: Prospects of real-time single-particle biological aerosol analysis: A comparison between laser-induced breakdown spectroscopy and aerosol
time-BGD
5, 1469–1510, 2008 Bioaerosol characterization D. G. Georgakopoulos et al. Title Page Abstract Introduction Conclusions References Tables Figures ◭ ◮ ◭ ◮ Back Close Full Screen / EscPrinter-friendly Version Interactive Discussion
of-flight mass spectrometry, Spectrochim. Acta B, 60(7–8), 1040–1059, 2005.
Bent, S. J., Pierson, J. D., and Forney, L. J.: Measuring species richness based on microbial community fingerprints: the emperor has no clothes, Appl. Environ. Microb., 73, 2399–401, 2007.
Birenszvige, A., Eversole, J., Seaver, M., Francesconi, S., Valdes, E., and Kulaga, H.: Aerosol
5
characteristics in a subway environment, Aerosol Sci. Tech., 37, 210–220, 2003.
Blando, J. D., Porcja, R. J., Li, T. H., Bowman, D., Lioy, P. J., and Turpin, B. J.: Secondary formation and Smokey Mountain organic aerosol: an examination of aerosol polarity and functional group composition during SEAVS, Environ. Sci. Technol., 32, 604–613, 1998. Brodie, E. L., DeSantis, T. Z., Parker, J. P. M., Zubietta, I. X., Piceno, Y. M., and Andersen, G.
10
L.: Urban aerosols harbor diverse and dynamic bacterial populations, Proc. Natl. Acad. Sci. USA, 104, 299–304, 2007.
Burge, H. A.: Bioaerosol investigations, in: Bioaerosols, edited by: Burge, H. A., CRC Press, Boca Raton, FL, 1–23, 1995.
Castrillo, L. A., Lee Jr., R. E., Lee, M. R., and Rutherford, S. T.: Identification of ice-nucleating
15
active Pseudomonas fluorescens strains for biological control of overwintering Colorado potato beetles (Coleoptera: Chrysomelidae), J. Econ. Entomol., 93(2), 226–233, 2000. Chapman, M. D.: Analytical methods: immunoassays, in: Bioaerosols, edited by: Burge, H. A.,
CRC Press, Boca Raton, FL, 235–248, 1995.
Chen, Y. Z., Shah, N., Huggins, F. E., and Huffman, G. P.: Characterization of ambient airborne
20
particles by energy-filtered transmission electron microscopy, Aerosol Sci. Tech., 39(6), 509– 518, 2005.
Chi, M.-C. and Li, C.-S.: Fluorochrome and Fluorescent In Situ Hybridization to monitor bioaerosols in swine buildings, Aerosol Sci. Tech., 39, 1101–1110, 2005.
Christner, B. C., Mosley-Thompson, E., Thompson, L. G., and Reeve, J. N.: Isolation of bacteria
25
and 16S rDNAs from Lake Vostok accretion ice, Environ. Microb., 3, 570–577, 2001. Cote, V., Kos, G., Mortazavi, A., and Ariya, P. A.: Microbial and “de novo” transformation of
dicarboxylic acids by three airborne fungi, Sci. Total Environ., 390(2–3), 530–537, 2008. Danovaro, R., Luna, G. M., Dell’Anno, A., and Pietrangeli, B.: Comparison of two fingerprinting
techniques, Terminal Restriction Fragment Length Polymorphism and Automated Ribosomal
30
Intergenic Spacer Analysis, for determination of bacterial diversity in aquatic environments, Appl. Environ. Microb., 72, 5982–5989, 2006.