Albumin evokes ca
2
+
-induced cell
oxidative stress and apoptosis
through TRPM2 channel in renal
collecting duct cells reduced by
curcumin
Mustafa Nazıroğlu
1,2,3, Bilal Çiğ
2,3, Yener Yazğan
2,3, Gerburg K. Schwaerzer
4,
franziska theilig
4,5& László pecze
5,6In proteinuric nephropathies of chronic kidney disease, the epithelial cells of the nephron including the collecting duct are exposed to high concentrations of luminal albumin. Albumin is taken up from collecting duct cells by endocytosis causing excessive reactive oxygen species (RoS) production and a proinflammatory response. Curcumin used in the traditional medicine possesses anti-inflammatory and antioxidant effects. ROS and ADP-ribose (ADPR) activate the cation channel TRPM2. We hypothesize, that albumin-induced cell stress and proinflammatory response are mediated by ca2+ and can be reduced by curcumin. The cortical collecting duct (CCD) cells mpkCCD
c14 exhibit
spontaneous and inducible ca2+ oscillations, which can be blocked by pre-treatment with curcumin.
Curcumin accumulates in plasma membrane and intracellular vesicles, where it interferes with TRPM2 and decreases the influx of Ca2+. Albumin reduces cell viability and increases apoptosis, NF-κB
activation, and mitochondrial membrane depolarization via Ca2+-dependent signaling, which results in
increased ROS production. Albumin-induced cell stress is diminished by the inhibition of TRPM2 after administration of curcumin and ADPR (PARP1) inhibitors. Curcumin did not reduce the Ca2+ elevation induced by thapsigargin in ca2+-free medium, but it reduced the function of store-operated Ca2+
channels and Atp-evoked ca2+ response. In conclusion, albumin-induced oxidative stress is mediated
by ca2+-dependent signaling via TRPM2 and leads to cell damage and a proinflammatory response,
strengthening the role of CCD cells in the progression of chronic kidney disease.
Albumin functions primarily as a carrier protein for fatty acids, and steroids in the blood. In healthy human adults, approximately seven grams of albumin are daily filtered by the glomeruli and partly reabsorbed by epithe-lial cells via receptor-mediated, clathrin-dependent endocytosis in proximal tubules1. Increased urinary albumin
excretion is caused by increased glomerular filtration, glomerular damage or tubular injury. Albuminuria is a well-known indicator for renal diseases and is involved in the progression of chronic kidney disease2. During
diabetic nephropathy increased urinary albumin excretion was detected before changes in serum creatinine levels were observed3. With saturation of proximal tubular endocytosis, albumin reaches the tubular lumen of collecting
ducts where it is reabsorbed by cortical collecting duct (CCD) cells. Albuminuria induces a proinflammatory response in CCDs promoting chronic kidney disease (CKD)4. Exposure of murine CCD cells to albumin induces
NF-κB activation, the expression of transforming growth factor-β1 (TGF-β1) and the upregulation of profibrotic signaling markers4. Increased oxidative stress and reactive oxygen species (ROS) are frequently found in CKD
patients5. The current therapeutic approaches slow down the progression of CKD through normalization of blood
1Neuroscience Research Center, Suleyman Demirel University, Isparta, Turkey. 2Department of Biophysics, Faculty
of Medicine, Suleyman Demirel University, Isparta, Turkey. 3Department of Neuroscience, Health Science Institute,
Suleyman Demirel University, Isparta, Turkey. 4Institute of Anatomy, Christian-Albrechts-University of Kiel, Kiel,
Germany. 5Anatomy, Department of Medicine, University of Fribourg, Fribourg, Switzerland. 6Independent
Scientist, Neuchhatel, Switzerland. Correspondence and requests for materials should be addressed to M.N. (email:
mustafanaziroglu@sdu.edu.tr) or F.T. (email: mustafanaziroglu@sdu.edu.tr) Received: 27 February 2019
Accepted: 16 July 2019 Published: xx xx xxxx
www.nature.com/scientificreports
www.nature.com/scientificreports/
pressure and maintaining the normal glucose and insulin levels6. Therefore, the developments of novel therapies
are highly needed to prevent the progression of CKD and improve renal function. Interestingly, new therapeutics might be natural products as curcumin with proven safety profiles7.
Turmeric (Curcuma longa) is a popular spice that has been used for centuries in traditional medicine for the treatment of various diseases8. Curcumin is the main compound present in turmeric and has been shown
to possess a broad spectrum of biological actions including anti-inflammatory, antioxidant, anticarcinogenic, anti-mutagenic, anti-coagulant and anti-infective effects8,9. Since pathophysiology of CKD involves oxidative
stress and inflammation10, the potential beneficial effect of curcumin consumption on the renal diseases have
been extensively studied7. Nevertheless, the precise mechanisms how proteinuria induces oxidative stress in the
CCD cells have not been satisfactorily elucidated so far.
Elevated levels of ROS lead to oxidative stress and damage lipids, proteins and DNA, and are linked to a myr-iad of pathologies11. Oxidative stress can disrupt normal physiological pathways and cause cell death, a process
largely mediated through Ca2+ signaling12. Oxidative stress induces Ca2+ influx from the extracellular
environ-ment into the cytoplasm through transient receptor potential (TRP) channels and the store-operated Ca2+
chan-nels (SOCE)13,14. TRPM2 channel was the first identified TRP channel, which is sensitive to ROS. It is suggested
that hydrogen peroxide triggers the intracellular production of ADP-ribose (ADPR) and activates TRPM215.
In this study, we show that Ca2+ signaling is involved in albumin-induced oxidative stress, when calcium
enters the cells via TRPM2 channels. The Ca2+ influx via TRPM2 is strongly reduced by cellular pretreatment
with curcumin.
Results
establishment of ca
2+oscillations blocked by curcumin.
Changes in [Ca2+]i were monitored with
the genetically encoded Ca2+ indicator protein CAR-GECO1. Even without any treatments, mpkCCD c14 cells
showed “spontaneous” Ca2+ oscillations observable in 3–40% of cells (Fig. 1A), which are similar to the
sponta-neous Ca2+ oscillations found in isolated CCD due to purinergic signaling16. These spontaneous oscillations were
present but less intensive in the absence of extracellular Ca2+ (Fig. 1A). The total Ca2+ oscillations were slightly
decreased by the curcumin treatment, because its modulator role on the Ca2+ influx in the cells. However, the
red fluorescence is slightly increased, which can be caused by the overlap of the curcumin staining and the emis-sion of red fluorescence light or by slight elevations in the basal Ca2+ concentrations (Fig. 1B). To investigate the
impact of curcumin on Ca2+-depending signaling, cells were incubated with different stimulants and curcumin.
One of the strong inducers of Ca2+ oscillations is extracellular ATP acting on the purinergic receptors.
Pre-treatment with curcumin significantly inhibited the ATP- evoked signal (550 ± 198 vs. 220 ± 66, unpaired t-test, p < 0.05): it reduced the integrals of the initial Ca2+ signals and the number of the oscillating cells from 90–95%
to 5–10% (Fig. 1C–E). A similar effect was observed, when cells were exposed to oxidative extracellular milieu. Curcumin (CURC) significantly reduced the peroxide-evoked Ca2+ signaling (623 ± 260 vs. 86 ± 76, unpaired
t-test, p < 0.05; Fig. 1F–H). The finding that curcumin treatment was able to reduce the effect of different stimuli indicates that curcumin do not act on a specific plasma membrane receptor, rather than it acts somewhere in the common phospho-inositol pathway.
Detailed analysis of oscillation frequencies and amplitudes are presented in the Supplementary material using a MATLAB code written for this purpose. Previously, it was reported that curcumin inhibits SERCA pump17.
However, curcumin treatment did not significantly reduce the Ca2+ signals evoked by the SERCA-inhibitor
thapsi-gargin (424 ± 156 vs. 379 ± 43, One-way ANOVA + posthoc LSD test, p > 0.05), but it significantly inhibited the store-operated Ca2+ entry (194 ± 76 vs. 18 ± 7, One-way ANOVA + post hoc LSD test, p < 0.05) (Fig. 1I–K).
Intracellular localization of curcumin in mpkCCD
c14cells.
Previously, it had been shown thatcur-cumin stains cells18. Therefore, we wanted to know, which cellular organelles are involved in the accumulation of
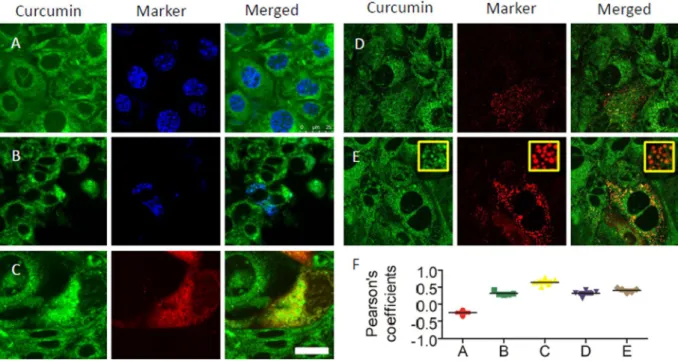
curcumin. Curcumin staining did not co-localize with cell nuclei labeled with blue Hoechst 33342 (Fig. 2A, first row, Pearson’s coefficients = −0.25 ± 0.07, n = 5). Curcumin staining showed weak partial co-localization with mitochondria visualized by mito-BFP (Fig. 2A, second row, Pearson’s coefficients = 0,31 ± 0.06, n = 5) and strong partial co-localization with endoplasmic reticulum (ER) compartments, stained with the red fluorescent protein KDEL having an ER-retention signal (Fig. 2C, third row, Pearson’s coefficients = 0.64 ± 0.11, n = 5). Additionally, visualization of clathrin vesicles and lysosomes, revealed partial co-localization with clathrin vesicles (Fig. 2D, first row on right side, Pearson’s coefficients = 0.32 ± 0.09, n = 5) and lysosomes (Fig. 2E second row on right side, Pearson’s coefficients = 0.40 ± 0.06, n = 5). In some areas, there is a strong co-localization with lysosomes (Insets on Fig. 2E). On Fig. 2F, one can observe the distribution of Pearson’s co-localization coefficients. Pearson’s colo-calization coefficients were in the range of + 1 (perfect correlation) to −1 (perfect but negative correlation) with 0, which was indicating the absence of a relationship. Detailed co-localization analysis with other co-localization measures is presented in the Supplementary Material (Supplement 1). The presence of curcumin in membranes and vesicles fits with the site of action of curcumin to inhibit Ca2+ entry and the common phospho-inositol
path-way and with acting on TRPM2 channels.
Albumin-induced ca
2+oscillations, cytokine production and NF-κB signaling are inhibited by
curcumin.
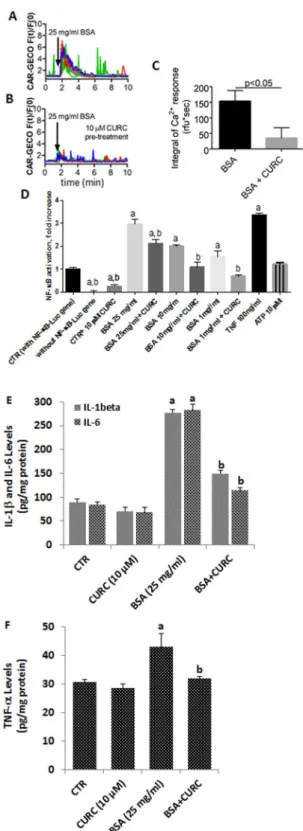
Increased extracellular protein concentration also induced Ca2+ oscillations in approximately 70%of the exposed cells. This effect was strongly reduced by pre-treatment of cells with 10 µM curcumin (153 ± 33 vs. 35 ± 32, unpaired t-test, p < 0.05; Fig. 3A–C; Supplementary Material 1). Previous studies have shown that Ca2+
oscillations affect NF-κB, tumor necrosis factor-alpha (TNF-α), interleukin 1-beta (IL-1β) and IL-6 activations19,20.
Thus, we tested how curcumin (10 µM) or decreased extracellular protein concentrations (25 mg/ml, 10 mg/ ml, and 1 mg/ml) affect NF-κB activation or TNF-α, IL-1β and IL-6 productions. Control mpkCCDc14NF-κB-luc
culture media. Cells which did not express the NF-κB-Luc construct do not produce any light signal. Treatment of mpkCCDc14NF-κB-Luc cells with albumin (BSA) for 6 h increased the NF-κB-activation in mpkCCDc14NF-κB-Luc
cells dose-dependently. In the presence of curcumin, NF-κB activation was significantly diminished. As a posi-tive control, 100 ng/ml of murine TNF-α evoked an intense NF-κB-activation as it was expected. ATP (10 µM) in the extracellular medium, however, did not induce significant NF-κB activation (Fig. 3D). However, TNF-α, IL-1β and IL-6 productions in the mpkCCDc14 cells were increased by albumin treatment, although they were decreased by the curcumin treatment (Fig. 3E,F). These results indicated that there was no interaction between NF-κB activation and intracellular Ca2+ oscillations, although albumin induced increase of NF-κB, TNF-α, IL-1β
and IL-6 levels were diminished by curcumin treatment.
Figure 1. Calcium signaling is influenced by curcumin. (A–D,F,G,I,J) Single-cell (colored traces) and average fluorescence (grey traces) recordings from time-lapse videos show changes in [Ca2+]
i. Bars represent standard
deviations (SD). Each figure represents the results of one representative experiment out of three/four with similar results. (A) “Spontaneous” Ca2+ oscillations. (B) curcumin (CURC, 10 µM) uptake slightly decreased the
basal [Ca2+]
i, but it did not evoke robust Ca2+ oscillations (measured in green channel). Yellow curve represents
the time-course of curcumin uptake (measured in green channel). (C,D) Administration of 5 µM ATP-evoked Ca2+ response, which was moderated by curcumin (CURC) pre-treatment (10 µM, 5 min). (F-G) Similarly,
0.15% H2O2 solutions evoked Ca2+ responses, but this effect was reduced by curcumin (CURC) pretreatment
(10 µM, 5 min). (I,J) Curcumin did not reduce significantly the Ca2+ elevation induced by thapsigargin (THAPS,
5 µM) in Ca2+-free medium, but significantly reduced the function of store-operated Ca2+ channels (SOCE).
(E,H,K) Statistical comparison of the integrals of the evoked Ca2+ responses with/without curcumin
www.nature.com/scientificreports
www.nature.com/scientificreports/
Availability of functional TRPM2 channels on the mpkCCD
c14and HEK293 cells.
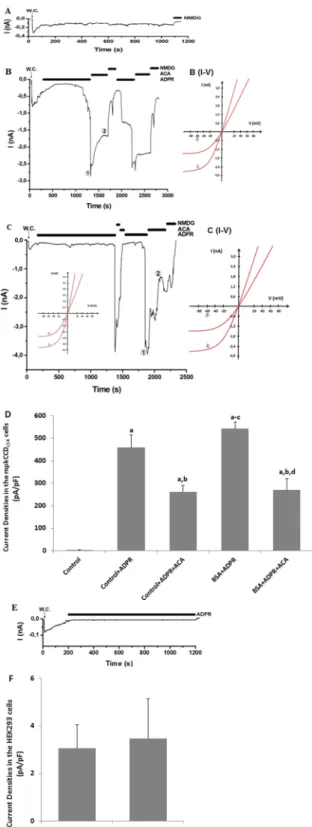
Results of realtime PCR indicated presence of TRPM2 mRNA expression in the medulla, renal cortex and mpkCCDc14 cells (Fig. 3; Supplementary material-1). TRPM2 cation channel has Nudix box domain in C terminal and it is stimu-lated by intracellular ADPR production21. Holding potential in the patch-clamp experiment were kept at −60 mV
as described in previous studies13,21 and there was no activation of TRPM2 without ADPR stimulation (Fig. 4A).
In the presence of intracellular (the patch pipette) ADPR (1 mM), the TRPM2 in mpkCCDc14 cells without BSA
treatment were gated up to 3.0 nA. N-(p-amylcinnamoyl) anthranilic acid (ACA) and NMDG+ are non-specific
blockers of TRPM213,21 and the ADPR-induced currents in the cells were reversibly blocked by extracellular ACA
and NMDG+ treatments (Fig. 4B,D). The ADPR-induced TRPM2 current densities were markedly (p < 0.05)
higher in the control + ADPR group than in control, although their denisites were markedly (p < 0.05) dimin-ished in the control + ADPR + ACA group by the ACA treatment. In addition, we observed the TRPM2 activa-tion up to 4.0 nA through intracellular ADPR treatment in the mpkCCDc14 cells after BSA treatment (Fig. 4C),
although the TRPM2 activation were diminished by extracellular ACA treatment. These results obviously indi-cated the presence of functioning TRPM2 channel in mpkCCDc14 cells and an activating role of oxidant BSA on
TRPM2 channel activity.
For confirming the patch-clamp results in the mpkCCDc14 cells, the analyses were repeated in the HEK293
cells. It is well known that HEK293 cells do not express TRPM222,23. We observed that ADPR did not induce
TRPM2 channel current in the absence of TRPM2 channel in the HEK293 cell line (Fig. 4E,F). Therefore, we further confirmed involvement of TRPM2 channel on mpkCCDc14 cells by the HEK293 cell results.
Albumin (BSA)-induced increase of the intracellular free Ca
2+fluorescence intensity in the
mpkCCD
c14cells was diminished through TRPM2 inhibition by curcumin.
ADPR is produced innucleus of cells by activation of Poly (ADPR) polymerase-1 (PARP-1) activation24. The TRPM2 is stimulated
by intracellular ADPR. However, extracellular ADPR cannot pass the cell membrane and the TRPM2 channel is not stimulated by the extracellular ADPR applications13,22. DPQ and PJ34 are well-known PARP-1
inhibi-tors and 2-aminoethoxydiphenyl borate (2-APB) is another non-specific TRPM2 blocker25,26. In addition to the
ADPR-induced electrophysiology results, we wanted to clarify the role of PARP-1 inhibitors (DPQ and PJ34) and TRPM2 inhibitor (2-APB) on free Ca2+ fluorescence intensity in mpkCCD
c14 cells. Treatment of cells with
2-APB (100 μM) markedly (p < 0.05) suppressed BSA-induced Ca2+ fluorescence intensity detected by laser
con-focal microscope (LSM 800, Zeiss, Ankara, Turkey) analyses (Fig. 5A,B). Treatment with PJ34 (30 μM) or DPQ (10 μM) also markedly (p < 0.05) diminished BSA-induced increase of Ca2+ fluorescence intensity (Fig. 5A,B),
which is consistent with the involvement of PARP-1 in ADPR-induced TRPM2 activation and nephrotoxicity, as previously described22,27.
Figure 2. Fluorescence images are showing intracellular localization of curcumin in mpkCCDc14 cells. (A,B)
Curcumin staining does not co-localize with nuclei and mitochondria: curcumin (green), nucleus (blue, Hoechst 33342, first row), and mitochondria (blue, mito-BFP, second row). (C,E) Curcumin is partially present on endoplasmic membranes, clathrin vesicles and lysosomes: Curcumin (green), endoplasmic reticulum (red, m-Cherry-ER-3 third row), clathrin vesicles (red, m-RFP-Clc, first row on the right side) and lysosomes (red, Lamp1-RFP, second row on the right side). Magnification bar represents 25 μm. (E) Distribution of Person’s correlation coefficients taking 5 images for each case.
Figure 3. Albumin evokes Ca2+ signals, but the NF-κB activity is blocked by curcumin. (A,B) Single-cell
(colored traces) and average fluorescence (gray traces) recordings from time-lapse videos show changes in [Ca2+]
i after albumin (BSA) administration. Bars represent standard deviations (SD). Experiments were
repeated at least three times with similar results. (C) Curcumin (CURC) pre-treatment (10 µM) significantly reduced Ca2+ signals evoked by albumin. (D) Incubation with CURC dose-dependently reduced NF-κB
activity evoked by high extracellular protein (BSA) concentration. (E,F) Incubation with CURC attenuated IL-1β, IL-6 and TNF-α activities evoked by high extracellular protein (BSA), respectively. In Figures A, B, C and D, the letters on the columns denote the following: a - significant difference from control group, One-way ANOVA + post hoc Dunett test, b - significant difference between curcumin-treated and non-treated counterparts. One-way ANOVA + post hoc Sidak’s test. In Figures E and F, ap < 0.05 versus control and CURC
www.nature.com/scientificreports
www.nature.com/scientificreports/
Figure 4. TRPM2 channels are available on mpkCCDc14 cells but not in HEK293 cells. The holding potential
was set at −60 mV; W.C. denotes whole-cell patch clamp configuration. (A) Recordings from a control mpkCCDc14 cell without stimulation. (B) Recordings from a stimulated mpkCCDc14 cell (without BSA
treatment). The TRPM2 currents in the cells were stimulated by intracellular (patch pipette) ADPR (1 mM), but the currents were blocked by the extracellular TRPM2 antagonist (ACA and 25 µM) in the patch-chamber. Currents were fully blocked in Na+-free solution (NMDG+) (C) Recordings from a stimulated mpkCCD
c14
cell (with BSA incubation). The TRPM2 channel was further activated in the cells by intracellular ADPR. (B) (I-V) and C (I-V) are corresponding I/V relation of currents recorded in (B,C) at the indicated time points 1 and 2, respectively. (D) Current densities of mpkCCDc14 cells were calculated by the current amplitudes and
cell membrane capacitances. (E) TRPM2 records in HEK293 cells. The TRPM2 channel in HEK293 cells was not activated by intracellular ADPR (1 mM in the patch pipette). (F) Current densities of HEK293 cells were calculated by the current amplitudes and cell membrane capacitances. Columns represent the mean + SD
Curcumin acted modulator role through inhibition of TRPM2 on albumin-induced apoptosis
and mitochondrial oxidative stress in the mpkCCD
c14cells.
Accumulating evidences indicatedthat the enhance of cytosolic Ca2+ concentration stimulates mitochondrial membrane depolarization (MMP)
through activation of several cation channels, including TRPM2. In turn, increase of MMP induces activations of two pathways as (1) excessive ROS production and (2) apoptosis through the activation of caspase 9 and 328–30.
The modulator role of curcumin on the TRPM2 channel in SH-SY5Y neuroblastoma and hepatocyte cells were recently reported31,32. Hence, we searched how BSA influences the cell viability and apoptosis of mpkCCD
c14
cells in relation to TRPM2 function. At the highest BSA concentration (25 mg/ml) cell viability was significantly decreased (p < 0.05), but curcumin co-treatment diminished the effect of BSA. Both the effects of curcumin and BSA treatments were modulated by the TRPM2 agonist CHPx (1 mM) and the TRPM2 antagonist ACA (25 µM) (Fig. 6A). The roles of curcumin on the induction of apoptosis were assayed by using apoptosis level and caspase (caspase-3 and caspase-9) activity analyses (Fig. 6B–D, respectively). Data analyses of the two complementary assays resulted in two synergic results. High amount of apoptosis, caspase-3 and caspase-9 values were remarked in BSA groups (p < 0.05). Nevertheless, curcumin co-treatment markedly diminished the values to control levels in the cells (p < 0.05). The effects of BSA treatments were also modulated by a TRPM2 agonist, CHPx (1 mM) and a TRPM2 antagonist, ACA (25 µM). The results indicated involvement of BSA-induced TRPM2 activation in the stimulation of the apoptotic pathway.
It is well known that intracellular free Ca2+ ion concentration was mainly increased by release of internal Ca2+
stores and Ca2+ influx from the external side14 The intracellular free Ca2+ ions are passed into mitochondria33,34
and it result in intracellular ROS production and oxidative stress through increase of mitochondrial membrane potential (MMP, Ψm)35. The ROS productions (Fig. 6E,F) and MMP levels (Fig. 6G) were markedly (p < 0.05)
increased by the BSA incubations (Fig. 6A,B). Again, curcumin co-treatment diminished the effect of albumin through inhibition of TRPM2 activity in the cells (p < 0.05). These results indicated that curcumin diminished albumin-induced mitochondrial oxidative toxicity through decreasing Ca2+ influx and TRPM2 channel activity.
curcumin reversed the albumin-induced increase of mitochondrial membrane potential and
ROS production.
In addition to the MMP and ROS microplate reader analyses in the mpkCCDc14 cells, weinvestigated the MMP and ROS image changes in single cells by using the confocal microscopy (LSM 800). JC-1 has been used in several cells to analyze MMP in the laser confocal microscope (LSM 800)36. Cytosolic
ROS imagines were performed by using DHR123 and DCFH-DA fluorescent dyes, although ROS production was imaged by using MitoTracker Red CM-H2Xros staining (MitoROS) in the cells as described in previous studies25,37. MMP (Fig. 7A,B), cytosolic (DHR123, Fig. 7A–D) and mitochondrial ROS fluorescence intensities
(MitoROS, Fig. 7C,D) were increased in the cells by the BSA treatment. However, curcumin co-treatment atten-uated the effect of albumin through inhibition of mitochondrial ROS in the cells. These imaging results further confirmed involvement of curcumin through inhibition of TRPM2 on the albumin-induced mitochondrial activ-ity and oxidative stress in the mpkCCDc14 cells.
Albumin-induced cell death was diminished through inhibition of TRPM2 channel in the kidney
cells by curcumin treatment.
Oxidative stress dependent activation of TRPM2 increases ROS-induced cell death in different cell types26–30. However, involvement of TRPM2 on the albumin (proteinuria)-induced celldeath in the mpkCCDc14 cells has not been clarified yet. After increasing the apoptosis and ROS levels, we
inves-tigated the involvement of TRPM2 channel in the BSA-induced cell death using propidium iodide and Hoechst 33342 fluorescent dyes. We observed that the BSA-induced increase of cell death in the mpkCCDc14 cells was
completely inhibited by the curcumin treatment (Fig. 8A,B). The results suggest that activation of TRPM2 has a critical role in BSA-induced cell death in kidney cells in the mpkCCDc14 cells.
curcumin treatment supports glutathione redox system for scavenging albumin-induced
excessive ROS production in the kidney cells.
ROS are scavenged by antioxidants24. Members of thiolredox system such as reduced glutathione (GSH) and glutathione peroxidase (GPx) have a main role in scaveng-ing the ROS in several cells24. Curcumin supports the GSH concentration and GPx activity in kidney cells38,39.
Thiol groups also have a main role in the activation of TRPM2 channels. GSH depletion in neurons induced excessive activation of TRPM2 channels through increased oxidative stress40–42. After observing increased levels
of ROS, we assume that decreased GSH concentration and GPx activity may induce the activation of the TRPM2 channels in kidney cells. The GSH concentration (Fig. 8C) and GPx (Fig. 8D) activity in the kidney cells were decreased by BSA treatment and levels were increased in the cells treated with curcumin.
Discussion
Calcium ions (Ca2+), acting as signaling molecules in cytosol, ER, and mitochondria, play a fundamental role in
the regulation of several biological processes, e.g. metabolism, proliferation, secretion, intercellular communica-tion, and fertilization14. Therefore, each cell possesses mechanisms for the precise regulation of Ca2+ concentrations
in cytoplasm ([Ca2+]
i), ER and mitochondrial matrix12. The increased activation of cell membrane Ca2+ channels
including TRPM2 and intracellular Ca2+ channels results in an elevated [Ca2+]
i concentration24. This leads to a
mito-chondrial Ca2+ overload, depolarization of mitochondrial membrane, ROS accumulation, and ATP depletion and,
(n = 6). The letters on the columns denote the following: a - significant difference from control group (p < 0.05). b - significant difference between ACA-treated and non-treated counterparts (p < 0.05). c - significant
difference between BSA + ADPR-treated, control + ADPR-treated and non-treated counterparts (p < 0.05). d - significant difference between BSA and BSA + ADPR-treated and non-treated counterparts (p < 0.05).
www.nature.com/scientificreports
www.nature.com/scientificreports/
Figure 5. BSA induces TRPM2-dependent increase in the [Ca2+]
i fluorescence intensity in the mpkCCDc14
cells: Modulator role of curcumin (CURC). (A) Representatives confocal images showing Fluo-3 (green) in cells under control (CTL) conditions or after exposure to BSA (25 mg/ml), BSA + CURC for 24 h, BSA + PARP-1 inhibitors (30 μM PJ34 and 10 μM DPQ for 30 min prior to BSA, cumene hydroperoxide (CHPx and 1 mM for 10 min) incubations) and TRPM2 channel antagonist (2-APB and 0.1 mM for 30 min before cells were incubated with BSA and CHPx). Details of the incubations and stimulations were given in material and method section. Briefly, Cells in the four groups (BSA, BSA + PJ34, BSA + DPQ and BSA + 2-APB) were incubated the chemicals and then the CHPx stimulants in the control and four were performed in the cells. Scale bar is 20 μm. (B) Summarizes the mean fluorescence intensities of Fluo-3 under indicated conditions, from three to four independent experiments, with each experiment examining 10–15 each for each condition. ap < 0.05 indicate
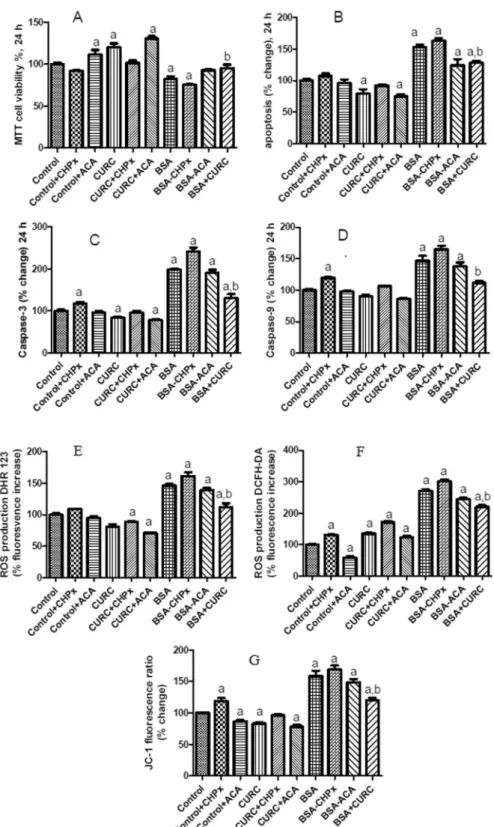
Figure 6. Albumin reduces cell viability and increases apoptosis, mitochondrial membrane depolarization (MMP) and ROS production of mpkCCDc14 cells reversed by curcumin (CURC) pretreatment. (A–G)
Cells were treated with albumin (25 mg/ml) and CURC (10 µM), CHPx (1 mM) and ACA (25 µM) or their combinations for 24 h. At this time point (24 h), MTT (A) and apoptosis assays were performed. Apoptosis was measured by loss of lipid asymmetry (B), caspase-3 (C) and caspase-9 activities (D) in a microplate reader. In plate reader analyses, two different fluorescent ROS dyes [DHR 123 (E) and DCFH-DA (F)], and MMP dye JC-1 (G) indicated the increase of ROS production and MMP, respectively. The columns represent means with standard deviation (SD) (n = 6 in 2 independent experiments with triplicates). The letters on the columns denote the following: a - significant difference from the control group (p < 0.05). b - significant difference between albumin (BSA) and BSA + CURC treatments (p < 0.05).
www.nature.com/scientificreports
www.nature.com/scientificreports/
thus, activates the mitochondria-dependent apoptosis14. The role of oxidative stress in mitochondrial dysfunction
and apoptosis in neurons has been reported in recent studies28,30. Apoptosis, caspase 3, caspase 9, PARP-1, MMP
and intracellular ROS were decreased after treatment with the TRPM2 blockers (ACA and 2-APB) and PARP-1 (PJ34 and DPQ) inhibitors, while cell viability and antioxidant levels were increased by the treatments25,26,40–42. So
far, there was no report on the albumin-induced apoptosis, inflammation and TRPM2 channel activation in kidney (mpkCCDc14) cells. Here we showed for the first time that albumin-induced increase of apoptosis, caspase 3, caspase
9, MMP, and intracellular ROS in collecting duct cells was attenuated by the treatment with curcumin.
Chronic kidney disease is a public health problem that affects approximately 8–13% of population, independ-ent on sex and age43. Oxidative stress and altered Ca2+ homeostasis have been implicated in the pathogenesis and
progression of CKD44. Loss of energy leads to the disruption of Ca2+ signaling in ER and mitochondria19,33,34.
Regarding apoptotic processes, a depletion of Ca2+ from ER stores is concomitant with a mitochondrial Ca2+
overload14,19. Albumin overload has been found to induce endoplasmic reticulum stress and apoptosis in renal
proximal tubular cells45–47. Excess albumin evoked unfolded protein response and ER stress via elevation of
[Ca2+]
i, which led to tubular apoptosis by ATF4-dependent lipocalin 2 modulation48. Albumin overload also
trig-gered a stress activated protein kinase, MAPK activation and upregulated MKP-1, an enzyme involved in rapid MAPK dephosphorylation, which might modulate ER stress in renal cells49. Moreover, albuminuria induced
proinflammatory and profibrotic responses in cortical collecting duct cells. The involvement of the lipocalin 2/ NGAL/24p3 receptor (NGAL-R/24p3-R) has been proven4. This receptor is expressed in rodent distal nephron,
where it mediates protein endocytosis50.
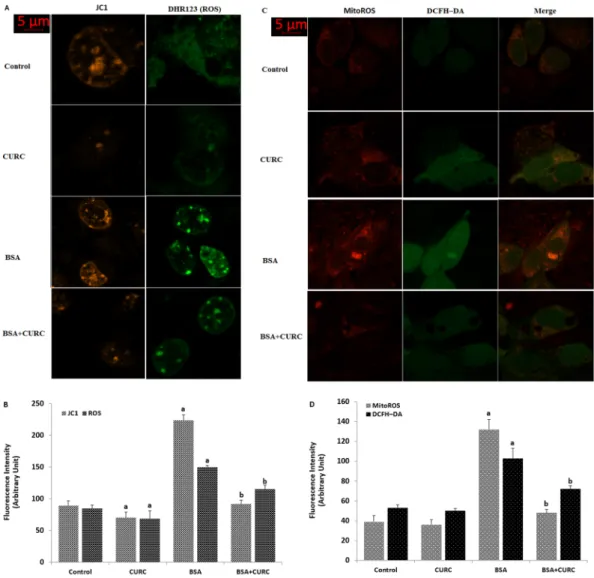
Figure 7. Albumin-induced mitochondrial Ca2+ accumulation activates mitochondrial ROS generation in
the mpkCCDc14 cells. (A–D). Cells were treated with albumin (25 mg/ml), CURC (10 µM), CHPx (1 mM) and
ACA (25 µM) or their combinations for 24 h. At this time point (24 h), cells were subjected to the JC-1 (A,B), DHR 123 (A,B), MitoTracker Red CM-H2Xros staining (MitoROS) red (C,D) and DCFH-DA (C,D) and assays indicating the levels of MMP and ROS production, respectively. Scale bar is 5 μm. (B,D) are summaries of the mean fluorescence intensity of JC-1, DHR 123, DCFH-DA and MitoROS under indicated conditions from four independent experiments, with each experiment examining 10–15 each for each condition. ap < 0.05 indicate
In the current study, we showed that TRPM2 activation and mitochondrial ROS production are also involved in the detrimental effect of albuminuria in mpkCCDc14 cells. We also demonstrated that curcumin integrating in
the cellular membranes effectively reduced the albumin-evoked cytotoxic effects such as intracellular Ca2+
over-load, NF-kB, cytokine (TNF-α, IL-1β and IL-6) and caspase activations and ROS production. To our knowledge, there is no report of curcumin effects on cortical collecting duct cell function. However, the biological effects of curcumin have already been investigated in several cell lines. For instance, inhibition of amyloid beta-induced cell death and prevention of intracellular Ca2+ elevation through inhibition of the NMDA receptors in human
neuroblastoma SH-SY5Y cells were reported by curcumin incubation51. In this cell line curcumin treatment also
reduced oxidative stress evoked by hydrogen peroxide52. In addition, apoptosis level and caspase activity of rat
renal tubules were inhibited by curcumin treatment through inhibition of nitric oxide synthase53. Inhibition of
Ca2+ mobilization in Jurkat T leukemia cells by curcumin treatment was also reported54. In contrary, increases of
intracellular ROS production levels, and caspase 3 activation in acute myeloid leukemia55 and colorectal cancer
cell lines56 were reported after treatment with curcumin. According to the above-mentioned reports, effects of
curcumin on apoptosis, calcium signaling, cytokine production and oxidative stress are cell specific. This differ-ence in response can be due to the altered Ca2+ signaling in tumor cells compared to normal cells57.
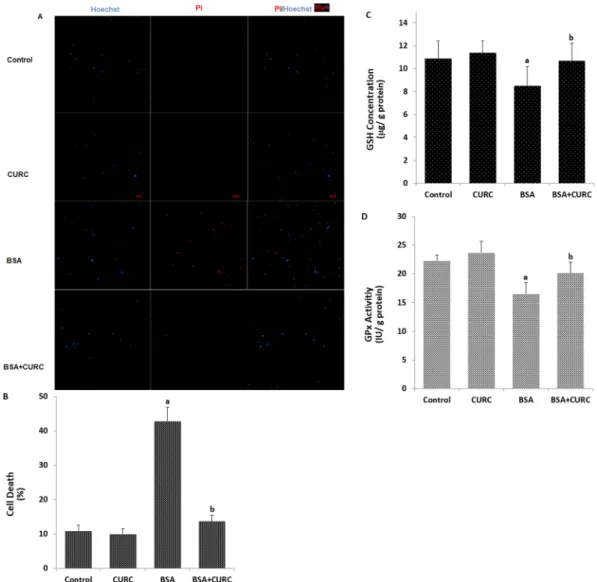
Figure 8. Albumin induces TRPM2 and ROS-dependent kidney (mpkCCDc14) cell death through
downregulation of reduced glutathione (GSH) and glutathione peroxidase (GPx) activity. (A) Representative images show cell death (propidium iodide) and live (Hoechst 33342) staining of mpkCCDc14 cells under control
conditions or after exposure to albumin (25 mg/ml), curcumin (CURC, 10 µM) and their combinations. Each panel consists of propidium iodide (red) and Hoechst (blue)-stainings showing dead and live cells and merged Hoechst (blue)/PI-stainings showing all and dead cells. Scale bar is 50 μm. (B) Summary of the mean percentage of propidium iodide and Hoechst-positive cells under indicated conditions from 6 independent experiments, with each experiment examining 10–15 cells for each condition. The red bars represent the percentage of cell. (C,D) We also assayed GSH concentration and GPx activity in the four groups by using a spectrophotometer.
www.nature.com/scientificreports
www.nature.com/scientificreports/
It is well-documented that PARP-1 has a main role in ROS-mediated TRPM2 gate and cell death in several cell lines24,25. As recently reported, ROS stimulates increased TRPM2 channel expression through PARP-1 resulting
in cell death induced by ROS25. However, curcumin protects against cell death through inhibition of TRPM2
channels in several cell lines31,32. It was reported that oxidative stress-induced decrease of GSH concentration
and GPx activity, and increase of Ca2+ influx in the SH-SY5Y neuroblastoma cells were attenuated by curcumin
treatment52. Synergic decrease of GSH concentration, GPx activity and PARP-1 expression levels in neurons
were induced by oxidative stress28,30. In the present study, we observed that BSA-induced cell death (Fig. 8A,B)
in mpkCCDc14 cells was completely prevented by up-regulation of GSH and GPx activity (Fig. 8C,D) and
down-regulation of TRPM2 activity by curcumin treatment, indicating that TRPM2 is critical in ROS-induced PARP-1 activation in kidney cells (Supplementary Fig. 3).
The present study provides genetic, physiological and pharmacological evidence to demonstrate the criti-cal role of TRPM2 channel in CKD induced by proteinuria (BSA) at biologicriti-cally relevant concentrations, in agreement with a recent study showing the role of TRPM2 in the generation of excessive ROS in neuronal cell lines. The results suggest that treatment with curcumin reduces albumin-induced oxidative stress, cell death, and intracellular Ca2+ signaling in collecting duct cells (CCD). These findings hold importance and may explain the
albumin-induced oxidative injuries in CCD cells, and the renal protective role of curcumin treatment against apoptotic cell death, excessive oxidative stress production, and Ca2+ overload. Moreover, TRPM2 channels can be
a promising target in the future therapies for CKD.
Material and Methods
Reagents and cell lines.
Curcumin (CURC), albumin (BSA), dimethyl sulfoxide (DMSO), L-glutamine, Trypsin-EDTA, 3- (4,5-dimethylthiazol-2-yl)-2,5-diphenyltetrazolium bromide (MTT) dye, cumene hydrop-eroxide (CHPx), ADP-ribose (ADPR), Dihydro-rhodamine 123 (DHR 123) and 2′,7′-dichlorodihydrofluores-cein diacetate (DCFH–DA) were purchased from Sigma Aldrich (St. Louis, MO, USA). ACA and 2-APB as two TRPM2 blockers were purchased from Santa Cruz (Istanbul, Turkey). Hoechst 33342, propidium iodide and MitoTracker Red CM-H2Xros (MitoROS) were purchased from Cell Signaling (Istanbul, Turkey).The murine cortical collecting duct mpkCCDc14 cells (obtained from Anatomy, Department of Medicine,
Fribourg University, Basel, Switzerland) were cultured in equal volumes of the media Dulbecco’s modified Eagle’s (DMEM) and Ham’s F12 mixed with 60 nmol/l Na+ selenate, 5 μg/ml transferrin, 50 nmol/l dexamethasone, 1
nmol/l triiodothyronine, 10 ng/ml epidermal growth factor, 5 μg/ml insulin, 2% fetal bovine serum, and 100 μg/ ml penicillin/streptomycin. Cells were grown in a 5% CO2/95% air atmosphere at 37 °C and were treated with
curcumin (CURC), bovine serum albumin (endotoxine free), TNF, ATP or the specific TRPM2 blocker ACA (25 μM) and agonist CHPx (1 mM) as indicated.
Human embryonic kidney 293 cells (HEK293, purchased from Şap Enstitüsü Ankara, Turkey) were cultured in DMEM as described in a previous study58. The cells were analyzed within 24 hours after plating onto the
cover-slips13. The cells were counted by using an automatic cell counter (Casy Modell TT, Roche, Germany).
Plasmids.
To generate cell lines stably expressing the Ca2+ indicator proteins, mpkCCDc14 cells were
infected with lentivirus encoding the gene for CAR-GECO1. The backbone of the lentivirus was produced as described earlier1,59. To monitor the NF-κB signal transduction pathway in vitro, the NF-κB reporter construct
from pNF-κB-Luc plasmid (Cat# 219077, Stratagene Inc., La Jolla, CA) was cloned into the lentiviral backbone pLVTHM (purchased from Addgene)60. The DNA fragment coding for NF-κB-Luc construct was synthesized by
PCR using the following primers: 5′-GAG AGT CGA CCC AAG CTA GGG GAC TTT C-3′ and 5′-GAG AAC TAG TTT TAC AAT TTG GAC TTT CCG C-3′. The amplicon was digested with SalI and SpeI and inserted into the appropriate sites of pLVTHM to produce the final pLV-NF-κB-Luc plasmid.
To stain specific cell organelles in the immunofluorescence, the following plasmids were used: m-Cherry-ER-3 (endoplasmic reticulum, a gift from Michael Davidson, Addgene plasmid #55041), mito-BFP (mitochondria, a gift from Gia Voeltz61, Addgene plasmid #49151), Lamp1-RFP (lysosomes, Addgene plasmid #1817), and
mRFP-Clc (clathrin vesicles, Addgene plasmid #14435).
To produce lentivirus, HEK 293 cells were transfected with the expression plasmids pLV-NF-κB-Luc or pLV-CAR-GECO1, the envelope plasmid pMD2G-VSVG (Addgene plasmid #12259) and the packaging plasmid psPAX2 (Addgene plasmid #12260) using calcium phosphate dependent transfection. Supernatants containing the lentivirus were collected after 48 hours and 72 hours, filtered, aliquoted and frozen at −80 °C62.
Measurement of nf-κB and cytokine activities.
mpkCCDc14 cells were transfected with the NF-κBreporter construct to obtain the NF-κB-luc-expressing mpkCCDc14 cells (mpkCCDc14NF-κB-luc). mpkCCDc14NF-κB-luc
were seeded in 24-well plates (100,000 cells/well in 500 µl complete medium). On the next day, cells were treated with different concentration of albumin, CURC, ATP and mouse TNF-α solved in 500 µl serum-free mpkCCDc14
medium for 6 h. Then the medium was removed. The cells were washed with PBS and lysed for 10 min at room temperature in 100 μl Passive Lysis Buffer (Promega Corp., Madison, WI) per well. The cells were scraped off the wells and lysis was enhanced by several rounds of pipetting up and down. All these steps were performed on ice. The luciferase activity was assessed using 20 μl of the cell lysates and 100 μl of Beetle-Juice from the complete kit (PJK, Kleinblittersdorf, Germany) containing Beetle-Juice buffer, D-luciferin as a substrate and ATP. The enzy-matic conversion of luciferin to oxyluciferin through luciferase requires ATP and is associated with the emission of greenish-yellow light between 550–570 nm, which was measured by the TD-20/20 Single-Tube luminometer (Turner BioSystems Inc., Sunnyvale, CA). The measured values were normalized in each experiment to the aver-aged control value (+500 µl serum-free mpkCCDc14 medium). Experiments were repeated three times in
To measure IL-1β, IL-6 and TNF-α mpkCCDc14 cells were measured according to the protocol provided with
the ELISA kit (R&D Systems, Istanbul, Turkey)20. Absorbance was detected at 450 nm by the ELISA microplate
reader Infinite Pro200. The data were presented as ng/mg protein.
Curcumin staining.
mpkCCDc14 cells grown on collagen-coated glass bottom 35 mm dishes (MatTek Corp.,Ashland, MA) were transiently transfected using the TransIT-2020 transfection reagent according to manufactur-er’s instructions (Myrus, Madison, WI) or loaded with Hoechst 33342 dye 10 mg/mL for 20 min at room temper-ature. Cells were treated with 100 µM curcumin for 5 min in complete medium and washed with buffer solution (DPBS, pH 7.4) that contained 138 mM NaCl, 8 mM Na2PO4, 2 mM CaCl2, 0.5 mM MgCl2, 2.7 mM KCl, and
1.6 mM KH2PO4. Inverted confocal microscope DMI6000 integrated to a Leica TCS-SP5 workstation was used for
image acquisition with the following excitation wavelengths and emission bandwidth: 476 nm, 487 nm - 556 nm for CURC; 405 nm, 419–474 nm for mCherry-ER-3, Lamp1-RFP and mRFP-Clc; and 405 nm, 419–474 nm for mito-BFP and Hoechst 33342.
ca
2+imaging.
mpkCCDc14 cells expressing CAR-GECO1 grown on collagen-coated glass bottom 35 mm
dishes (MatTek Corp., Ashland, MA) were pre-treated with 10 µM CURC in complete medium for 5 min as indicated. After loading, cells were washed with buffer solution (DPBS) used for Ca2+-imaging experiments.
In the low Ca2+ solution, CaCl
2 was replaced with an equimolar concentration of NaCl. The drugs (THAPS,
BSA, ATP, H2O2) were added to the solutions and remained in the solution until the end of the experiments.
We used an inverted confocal microscope DMI6000 integrated to a Leica TCS-SP5 workstation to examine changes in [Ca2+]
i concentration. To illuminate the Ca2+ indicators, we used 476 nm for curcumin and 561 nm
for CAR-GECO1. At the confocal microscope, fluorescence emission was recorded at 487–556 nm (CURC) and 584 to 683 nm (CAR-GECO1). Recordings were performed at 37 °C using Tempcontrol 37-2 digital and a Heating Stage (PeCon GmbH, Erbach, Germany). Fluorescence images for [Ca2+]
i measurements were collected every
3 s. Circular-shaped regions of interest (ROI) were placed inside the cytoplasmic area of cells. Bleaching correc-tion was carried out, when the baseline was not stable. The relative fluorescent unit (rfu) values were calculated for each cell after background subtraction (fluorescence intensity of regions without cells); fluorescence inten-sities at each time point (F(t)) were divided by the averaged baseline fluorescence value measured during the non-treatment period (F(0)): = rfu t F t F ( ) ( ) (0)
In order to gain insight into evoked Ca2+ responses of the entire cell population observed under the
micro-scope, the traces of more than 20 randomly selected cells were averaged:
∑
= = A t n rfu t ( ) 1 ( ), i n 1where n is the number of the selected cells. The integral of the Ca2+ signal was calculated as
∫
( ( )A t −1)∗dt, tt 1 0 where t0 is the time of the onset of [Ca2+]
i increment and t1 is the endpoint of the recording period (the time
when the signal usually returns to its baseline value). This integral was approximated using the trapezoidal rule. The unit for the Ca2+ integrals is rfu*sec. The values of integrals from at least three independent experiments were
collected and were statistically analyzed.
Electrophysiology.
Whole-cell recordings were performed using an EPC 10 amplifier equipped with a per-sonal computer with Patchmaster software (HEKA, Lamprecht, Germany) at room temperature. The details of standard bath solutions were given in previous studies28,30. The holding potential in the mpkCCDc14 and HEK293
cells was −60 mV. In the patch-clamp experiment mpkCCDc14 and HEK293 cells were perfused with standard
bath solution containing ADPR (1 mM in patch pipette) for stimulation or ACA for inhibition (25 μM). The max-imal current amplitudes (pA) in a cell were divided by the cell capacitance (pF), a measure of the cell surface. The resulting values represent the current density (pA/pF).
Cell viability (MTT) assay.
To assess albumin’s toxic effects on cell viability, we measured the mitochon-drial activity of living mpkCCDc14 cells in a microplate reader (Infinite Pro200; Tecan Austria GmbH, Groedig,Austria) at 650 nm by using a 3-(4,5-dimethylthiazol-2-yl)-2,5-diphenyltetrazolium bromide (MTT) quantitative colorimetric assay52. The data were presented as percentage relative to the control. The incubation time was 24 hrs.
We used concentrations as indicated in Fig. 3D.
Assay for apoptosis markers.
Apoptosis was detected using the APOPercentage Apoptosis Assay (Biocolor, Belfast, Northern Ireland) according to the manufacturer’s instructions. The absorbance of apoptosis dye was measured at 550 nm in a microplate reader (Infinite Pro200). The data were presented as fold increase nor-malized to control. Activities of caspase-3 and caspase-9 were measured as previously reported with minor mod-ifications30. Cleavage of the caspase-3 substrate (AC-DEVD-AMC) and caspase-9 substrate (AC-LEHD-AMC)was measured in a microplate reader (Infinite pro200) with excitation at 360 nm and emission at 460 nm. The data were calculated as fluorescence units/mg protein and presented as fold increase normalized to control.
www.nature.com/scientificreports
www.nature.com/scientificreports/
Intracellular ROS measurement in the microplate reader.
DHR 123 gets fluorescent upon oxi-dation to yield rhodamine 123 (Rh 123). DCFH-DA yields fluorescent dichlorofluorescein (DCF). Cells were re-suspended in 0.2 ml of extracellular buffer and incubated with DHR 123 (1μl, stock = 20 mM) and 1 μl DCFH-DA (stock = 20 mM) dye solutions for 15 min at room temperature in dark. ROS causes a proportional increase of fluorescence measured in a microplate reader (Infinite Pro200). Excitation was set at 490 nm and emission at 515 nm28,29. Data were presented as percental increase normalized to control.Mitochondrial membrane potential (Mpp) determination in the microplate reader in the
mpkc-CD
c14cells.
The mpkCCDc14 cells were incubated with 5 μl JC-1 for 15 min at 37 °C as previously described29.The lipophilic, cationic dye JC-1 selectively enters into mitochondria and reversibly changes color from red to green, when the mitochondrial potential decreases. The green and red signals were measured by microplate reader Infinite Pro200 at an excitation wavelength of 485 nm and an emission wavelength of 535 nm or at an excitation wavelength of 540 nm and an emission wavelength of 590 nm, respectively. The ratio of green/red fluo-rescence intensity was calculated and presented as fold increase normalized to control.
Imaging ROS generation and MMP (JC-1) in the mpkCCD
c14cells by laser confocal microscope
analyses.
Mitochondrial ROS generation in the laser confocal microspore analyses (LSM 800, Zeiss, Ankara, Turkey) was assayed by using MitoTracker Red CM-H2Xros (Life Technologies) fluorescent dye according to manufacturer’s instructions. Intracellular ROS production was monitored by the fluorescent dyes DHR123 and DCFH-DA at 37 °C in dark.Cells were treated as indicated and then incubated in culture medium containing 100 nM MitoTracker Red CM-H2Xros for 30 min and 1 μM DCFH-DA and DHR123 for 20 min20,25,26. Before imaging cells were washed
with and maintained in 1xPBS. DHR123 and DCFH-DA were excited with a diode laser at 488 nm. ZEN program was used for analyzing the fluorescence intensity results of each cell. The results were analyzed by using Image J/ Imaris software and the mean values were expressed as arbitrary unit.
To image JC-1 in mpkCCDc14 cells, cells were incubated with JC-1 (5 μl) fluorescent dye for 15 min at 37 °C in
the dark. The samples were then analyzed by the laser confocal microscopy (LSM 800). JC-1 dyes in the cells were excited with a diode laser at 488 nm and an Argon laser at 488 nm20. Fluorescence intensity (arbitrary unit) of each
cell was recorded by using ZEN program and analyzed by using Image J/Imaris software. Results of staining with JC-1 were expressed as the mean fluorescence intensity in arbitrary units/cell.
Quantitative PCR using TaqMan probes.
RNA was isolated from kidneys and cells according to man-ufacturer´s instruction (NucleoSpin RNA/protein, Machery & Nagel). 2 ng RNA were reverse transcribed into cDNA using PrimeScript RT Reagent Kit (Takara, RR037A). cDNA was added to Taqman Fast Advanced mas-ter mix (Applied Biosystem, 4444556), Euk 18SrRNA (20×) (Applied Biosystem 4319413E) and TRPM2-FAM (mouse: Mm00663098 _m1, human: Hs01066086_m1), and subjected to qPCR.Assay of glutathione peroxidase (GSH-Px) activity and reduced glutathione (GSH) level in the
mpkCCD
c14cells.
In the mpkCCDc14 cells (106 cells/ml) the level of GSH and the activity of GPx werespec-trophotometrically (UV-1800, Shimadzu, Kyoto, Japan) measured at 412 nm by using the methods of Sedlak and Lindsay62 and Lawrence and Burk63 as described in previous studies20,30. The GSH level was expressed as μg/g
protein, whereas GPx activity was expressed as IU/g protein. Bradford reagent was used for the total protein assay in the cells at 595 nm by using a spectrophotometer (Shimadzu UV-1800).
Statistical analysis.
Two sample groups were analyzed with Student unpaired t-test. Three and more sam-ple groups were analyzed by one-way ANOVA. If the ANOVA test indicated a statistically significant difference between the groups (*p < 0.05), the data were further analyzed by post hoc tests.Compliance with ethical standards.
This article does not contain any studies with human participants and experimental animals performed by any of the authors. Cortical collecting duct mpkCCDcl4 cell lines were used in the current study. The procedures in the isolation of the cells were undertaken by the Anatomy Department at the University of Fribourg.Data Availability
All methods in the manuscript were performed in accordance with the relevant guidelines and regulations of Suleyman Demirel University (Isparta, Turkey) and Fribourg University, Fribourg, Switzerland by including a statement in the methods section to this effect. The dataset and analyses were generated in BSN Health, Analy-ses, Innovation, Consultancy, Organization, Agriculture, Industry and Trade Limited Company, Göller Bölgesi Teknokenti, Isparta, Turkey and are available from the corresponding authors on reasonable request. Graphics in the manuscript were prepared by the corresponding author (Mustafa Nazıroğlu). The authors declare that the main data supporting the findings of this study are available within the article and its Supplementary Information. Extra data that support the findings of this study are available from the corresponding authors upon reasonable request. A reporting summary for this Article is available in the Fig. 9.
References
1. Gekle, M. Renal tubule albumin transport. Annu Rev Physiol. 67, 573–94, https://doi.org/10.1146/annurev.physiol.67.031103.154845
(2005).
2. Iglesias, J. & Levine, J. S. Albuminuria and renal injury–beware of proteins bearing gifts. Nephrol Dial Transplant. 16, 215–218 (2001). 3. Parving, H. H., Oxenboll, B., Svendsen, P. A., Christiansen, J. S. & Andersen, A. R. Early detection of patients at risk of developing
4. Dizin, E. et al. Albuminuria induces a proinflammatory and profibrotic response in cortical collecting ducts via the 24p3. receptor.
Am J Renal Physiol 305(7), F1053–F1063 (2013).
5. Hagmann, H. & Brinkkoetter, P. T. ROS and oxidative stress in CKD patients: is it the mitochondria that keeps CKD patients in bed?
Nephrol Dial Transplant. 30(6), 867–868, https://doi.org/10.1093/ndt/gfv052 (2015).
6. Obi, Y., Kim, T., Kovesdy, C. P., Amin, A. N. & Kalantar-Zadeh, K. Current and potential therapeutic strategies for hemodynamic cardiorenal syndrome. Cardiorenal Med. 6(2), 83–98, https://doi.org/10.1159/000441283 (2016).
7. Ali, B. H. et al. Curcumin ameliorates kidney function and oxidative stress in experimental chronic kidney disease. Basic Clin
Pharmacol Toxicol. 122(1), 65–73, https://doi.org/10.1111/bcpt.12817 (2018).
8. Gupta, S. C., Patchva, S., Koh, W. & Aggarwal, B. B. Discovery of curcumin, a component of golden spice, and its miraculous biological activities. Clin Exp Pharmacol Physiol. 39(3), 283–299, https://doi.org/10.1111/j.1440-1681.2011.05648.x (2012). 9. Trujillo, J. et al. Renoprotective effect of the antioxidant curcumin: Recent findings. Redox Biol. 1, 448–456, https://doi.org/10.1016/j.
redox.2013.09.003 (2013).
10. Okamura, D. M. & Pennathur, S. The balance of powers: Redox regulation of fibrogenic pathways in kidney injury. Redox Biol. 6, 495–504, https://doi.org/10.1016/j.redox.2015.09.039 (2015).
11. Schieber, M. & Chandel, N. S. ROS function in redox signaling and oxidative stress. Curr Biol. 24(10), R453–R462, https://doi. org/10.1016/j.cub.2014.03.034 (2014).
12. Ermak, G. & Davies, K. J. Calcium and oxidative stress: from cell signaling to cell death. Mol Immunol. 38(10), 713–721 (2002). 13. Nazıroğlu, M. & Lückhoff, A. Effects of antioxidants on calcium influx through TRPM2 channels in transfected cells activated by
hydrogen peroxide. J Neurol Sci. 270(1-2), 152–158, https://doi.org/10.1016/j.jns.2008.03.003 (2008).
14. Kumar, V. S., Gopalakrishnan, A., Nazıroğlu, M. & Rajanikant, G. K. Calcium ion–the key player in cerebral ischemia. Curr Med
Chem. 21(18), 2065–2075 (2014).
15. Hara, Y. et al. LTRPC2 Ca2+-permeable channel activated by changes in redox status confers susceptibility to cell death. Mol Cell.
9(1), 163–173 (2002).
16. Svenningsen, P., Burford, J. L. & Peti-Peterdi, J. ATP releasing connexin 30 hemichannels mediate flow-induced calcium signaling in the collecting duct. Front Physiol. 4, 292 (2013).
17. Bilmen, J. G., Khan, S. Z., Javed, M. H. & Michelangeli, F. Inhibition of the SERCA Ca2+ pumps by curcumin. Curcumin putatively
stabilizes the interaction between the nucleotide-binding and phosphorylation domains in the absence of ATP. Eur J Biochem.
268(23), 6318–6327 (2001).
18. Kunwar, A. et al. Differential uptakes and fluorescence of curcumin, a yellow pigment from turmeric in normal vs tumor cells. Barc
Newsletter. 285, 202 (2007).
19. Dolmetsch, R. E., Xu, K. & Lewis, R. S. Calcium oscillations increase the efficiency and specificity of gene expression. Nature
392(6679), 933–936 (1998).
20. Deveci, H. A., Akyuva, Y., Nur, G. & Nazıroğlu, M. Alpha lipoic acid attenuates hypoxia-induced apoptosis, inflammation and mitochondrial oxidative stress via inhibition of TRPA1 channel in human glioblastoma cell line. Biomed Pharmacother. 111, 292–304 (2018).
21. Heiner, I. et al. Endogenous ADP-ribose enables calcium-regulated cation currents through TRPM2 channels in neutrophil granulocytes. Biochem J. 398(2), 225–232 (2006).
22. Fonfria, E. et al. TRPM2 channel opening in response to oxidative stress is dependent on activation of poly(ADP-ribose) polymerase.
Br J Pharmacol. 143(1), 186–192 (2004).
23. Kim, T. K. et al. Lys1110 of TRPM2 is critical for channel activation. Biochem J. 455(3), 319–327 (2013).
24. Nazıroğlu, M. New molecular mechanisms on the activation of TRPM2 channels by oxidative stress and ADP-ribose. Neurochem
Res. 32(11), 1990–2001 (2007).
25. Li, X. & Jiang, L.-H. Multiple molecular mechanisms form a positive feedback loop driving amyloid β42 peptide-induced neurotoxicity via activation of the TRPM2 channel in hippocampal neurons. Cell Death Dis 9, 195 (2018).
26. An, X. et al. Increasing the TRPM2 channel expression in Human Neuroblastoma SH-SY5Y cells augments the susceptibility to ROS-induced cell death. Cells 8, 28 (2019).
27. Gao, G. et al. TRPM2 mediates ischemic kidney injury and oxidant stress through RAC1. J Clin Invest. 124(11), 4989–5001 (2014). 28. Kahya, M. C., Nazıroğlu, M. & Ovey, I. S. Modulation of diabetes-induced oxidative stress, apoptosis, and Ca(2+) entry through
TRPM2 and TRPV1 channels in dorsal root ganglion and hippocampus of diabetic rats by melatonin and selenium. Mol Neurobiol.
54(3), 2345–2360 (2017).
29. Baş, E., Nazıroğlu, M. & Pecze, L. ADP-Ribose and oxidative stress activate TRPM8 channel in prostate cancer and kidney cells. Sci
Rep. 9(1), 4100, https://doi.org/10.1038/s41598-018-37552-0 (2019).
30. Yüksel, E., Nazıroğlu, M., Şahin, M. & Çiğ, B. Involvement of TRPM2 and TRPV1 channels on hyperalgesia, apoptosis and oxidative stress in rat fibromyalgia model: Protective role of selenium. Sci Rep. 7(1), 17543 (2017).
31. Öz, A. & Çelik, Ö. Curcumin inhibits oxidative stress-induced TRPM2 channel activation, calcium ion entry and apoptosis values in SH-SY5Y neuroblastoma cells: Involvement of transfection procedure. Mol Membr Biol. 33(3-5), 76–88 (2016).
32. Kheradpezhouh, E., Barritt, G. J. & Rychkov, G. Y. Curcumin inhibits activation of TRPM2 channels in rat hepatocytes. Redox Biol.
7, 1–7 (2016).
33. Pecze, L., Blum, W. & Schwaller, B. Routes of Ca2+ Shuttling during Ca2+ oscillations: Focus on the role of mitochondrial Ca2+
handling and cytosolic Ca2+ buffers. J Biol Chem. 290(47), 28214–28230, https://doi.org/10.1074/jbc.M115.663179 (2015).
34. Pecze, L. et al. Activation of endogenous TRPV1 fails to induce overstimulation-based cytotoxicity in breast and prostate cancer cells but not in pain-sensing neurons. Biochim Biophys Acta. 1863(8), 2054–2064, https://doi.org/10.1016/j.bbamcr.2016.05.007
(2016).
35. Lemasters, J. J., Theruvath, T. P., Zhong, Z. & Nieminen, A. L. Mitochondrial calcium and the permeability transition in cell death.
Biochim Biophys Acta. 1787(11), 1395–401 (2009).
36. Keil, V. C., Funke, F., Zeug, A., Schild, D. & Müller, M. Ratiometric high-resolution imaging of JC-1 fluorescence reveals the subcellular heterogeneity of astrocytic mitochondria. Pflugers Arch. 462, 693–708 (2011).
37. Joshi, D. C & Bakowska, J. C. Determination of mitochondrial membrane potential and reactive oxygen species in live rat cortical neurons. J Vis Exp 51, https://doi.org/10.3791/2704 (2011).
38. Samarghandian, S., Azimi-Nezhad, M., Farkhondeh, T. & Samini, F. Anti-oxidative effects of curcumin on immobilization-induced oxidative stress in rat brain, liver and kidney. Biomed Pharmacother. 87, 223–229, https://doi.org/10.1016/j.biopha.2016.12.105
(2017).
39. Abarikwu, S. O., Durojaiye, M., Alabi, A., Asonye, B. & Akiri, O. Curcumin protects against gallic acid-induced oxidative stress, suppression of glutathione antioxidant defenses, hepatic and renal damage in rats. Ren Fail. 38(2), 321–329, https://doi.org/10.3109 /0886022X.2015.1127743 (2016).
40. Belrose, J. C., Xie, Y. F., Gierszewski, L. J., MacDonald, J. F. & Jackson, M. F. Loss of glutathione homeostasis associated with neuronal senescence facilitates TRPM2 channel activation in cultured hippocampal pyramidal neurons. Mol Brain. 5, 11, https://doi. org/10.1186/1756-6606-5-11 (2012).
41. Özgül, C. & Nazıroğlu, M. TRPM2 channel protective properties of N-acetylcysteine on cytosolic glutathione depletion dependent oxidative stress and Ca2+ influx in rat dorsal root ganglion. Physiol Behav. 106(2), 122–128, https://doi.org/10.1016/j.
www.nature.com/scientificreports
www.nature.com/scientificreports/
42. Övey, I. S. & Nazıroğlu, M. Homocysteine and cytosolic GSH depletion induce apoptosis and oxidative toxicity through cytosolic calcium overload in the hippocampus of aged mice: involvement of TRPM2 and TRPV1 channels. Neuroscience 284, 225–233,
https://doi.org/10.1016/j.neuroscience.2014.09.078 (2015).
43. Brück, K. et al. European CKD Burden Consortium. CKD prevalence varies across the European General Population. J Am Soc
Nephrol. 27(7), 2135–2147, https://doi.org/10.1681/ASN.2015050542 (2016).
44. Krata, N., Zagożdżon, R., Foroncewicz, B. & Mucha, K. Oxidative stress in kidney diseases: The Cause or the Consequence? Arch
Immunol Ther Exp (Warsz). 66(3), 211–220, https://doi.org/10.1007/s00005-017-0496-0 (2018).
45. Ohse, T. et al. Albumin induces endoplasmic reticulum stress and apoptosis in renal proximal tubular cells. Kidney Internat. 70(8), 1447–1455 (2006).
46. Theilig F et al. Abrogation of protein uptake through megalin-deficient proximal tubules does not safeguard against tubulointerstitial injury. J Am Soc Nephrol. 18(6), 1824–1834.
47. El Karoui, K. et al. Endoplasmic reticulum stress drives proteinuria-induced kidney lesions via Lipocalin 2. Nat Commun. 7, 10330,
https://doi.org/10.1038/ncomms10330 (2016).
48. Gorostizaga, A. et al. Modulation of albumin-induced endoplasmic reticulum stress in renal proximal tubule cells by upregulation of mapk phosphatase-1. Chem Biol Interact. 206(1), 47–54, https://doi.org/10.1016/j.cbi.2013.08.009 (2013).
49. Langelueddecke, C. et al. Lipocalin-2 (24p3/neutrophil gelatinase-associated lipocalin (NGAL) receptor is expressed in distal nephron and mediates protein endocytosis. J Biol Chem. 287(1), 159–169, https://doi.org/10.1074/jbc.M111.308296 (2012). 50. Huang, H. C., Chang, P., Lu, S. Y., Zheng, B. W. & Jiang, Z. F. Protection of curcumin against amyloid-β-induced cell damage and
death involves the prevention from NMDA receptor-mediated intracellular Ca2+ elevation. J Recept Signal Transduct Res. 35(5),
450–457, https://doi.org/10.3109/10799893.2015.1006331 (2015).
51. Uğuz, A. C., Öz, A. & Nazıroğlu, M. Curcumin inhibits apoptosis by regulating intracellular calcium release, reactive oxygen species and mitochondrial depolarization levels in SH-SY5Y neuronal cells. J Recept Signal Transduct Res. 36(4), 395–401, https://doi.org/1 0.3109/10799893.2015.1108337 (2016).
52. Liu, F. et al. Administration of curcumin protects kidney tubules against renal ischemia-reperfusion injury (RIRI) by modulating nitric oxide (NO) signaling pathway. Cell Physiol Biochem. 44(1), 401–411, https://doi.org/10.1159/000484920 (2017).
53. Kliem, C. et al. Curcumin suppresses T cell activation by blocking Ca2+ mobilization and nuclear factor of activated T cells (NFAT)
activation. J Biol Chem. 287(13), 10200–10209, https://doi.org/10.1074/jbc.M111.318733 (2012).
54. Pesakhov, S. et al. Cancer-selective cytotoxic Ca2+ overload in acute myeloid leukemia cells and attenuation of disease progression
in mice by synergistically acting polyphenols curcumin and carnosic acid. Oncotarget. 7(22), 31847–31861. (2016).
55. Huang, Y. F. et al. Curcumin enhances the effects of irinotecan on colorectal cancer cells through the generation of reactive oxygen species and activation of the endoplasmic reticulum stress pathway. Oncotarget. 8(25), 40264–40275, https://doi.org/10.18632/ oncotarget.16828 (2017).
56. Stewart, T. A., Yapa, K. T. & Monteith, G. R. Altered calcium signaling in cancer cells. Biochim Biophys Acta. 1848(10 Pt B), 2502–2511, https://doi.org/10.1016/j.bbamem.2014.08.016 (2015).
57. Polzin, D. et al. Decreased renal corin expression contributes to sodium retention in proteinuric kidney diseases. Kidney Int. 78(7), 650–6509, https://doi.org/10.1038/ki.2010.197 (2010).
58. Pecze, L., Blum, W., Henzi, T. & Schwaller, B. Endogenous TRPV1 stimulation leads to the activation of the inositol phospholipid pathway necessary for sustained Ca(2+) oscillations. Biochim Biophys Acta. 1863(12), 2905–2915, https://doi.org/10.1016/j. bbamcr.2016.09.013 (2016).
59. Wiznerowicz, M. & Trono, D. Conditional suppression of cellular genes: lentivirus vector-mediated drug-inducible RNA interference. J Virol. 77(16), 8957–8961 (2003).
60. Friedman, J. R. et al. ER tubules mark sites of mitochondrial division. Science 334(6054), 358–362 (2011).
61. Kutner, R. H., Zhang, X. Y. & Reiser, J. Production, concentration and titration of pseudotyped HIV-1-based lentiviral vectors. Nat
Protoc. 4(4), 495–505 (2009).
62. Sedlak, J. & Lindsay, R. H. C. Estimation of total, protein bound and non-protein sulfhydryl groups in tissue with Ellmann’ s reagent.
Anal Biochem. 25, 192–205 (1968).
63. Lawrence, R. A. & Burk, R. F. Glutathione peroxidase activity in selenium-deficient rat liver. Biochem Biophys Res Commun. 425(3), 503–509 (2012).
Acknowledgements
The study was supported by BSN Health, Analyses, Innovation, Consultancy, Organization, Agriculture, Industry and Trade Limited Company, Göller Bölgesi Teknokenti, Isparta, Turkey (Project No: 2018-04). There is no financial disclosure of the current study.
Author contributions
M.N., F.T. and L.P. formulated the present hypothesis and they were responsible for writing the report. B.Ç. was responsible for plate reader analyses. M.N. and Y.Y. were responsible for patch-clamp analyses. F.T. performed confocal imaging and GKS performed real time PCR analysis. Remaining analyses were performed by L.P. F.T. and G.K.S. critically revised the manuscript. Graphical abstract in the supplementary Figure 3 was prepared by M.N.
Additional information
Supplementary information accompanies this paper at https://doi.org/10.1038/s41598-019-48716-x. Competing Interests: The authors declare no competing interests.
Publisher’s note: Springer Nature remains neutral with regard to jurisdictional claims in published maps and institutional affiliations.
Open Access This article is licensed under a Creative Commons Attribution 4.0 International License, which permits use, sharing, adaptation, distribution and reproduction in any medium or format, as long as you give appropriate credit to the original author(s) and the source, provide a link to the Cre-ative Commons license, and indicate if changes were made. The images or other third party material in this article are included in the article’s Creative Commons license, unless indicated otherwise in a credit line to the material. If material is not included in the article’s Creative Commons license and your intended use is not per-mitted by statutory regulation or exceeds the perper-mitted use, you will need to obtain permission directly from the copyright holder. To view a copy of this license, visit http://creativecommons.org/licenses/by/4.0/.
![Figure 1. Calcium signaling is influenced by curcumin. (A–D,F,G,I,J) Single-cell (colored traces) and average fluorescence (grey traces) recordings from time-lapse videos show changes in [Ca 2+ ] i](https://thumb-eu.123doks.com/thumbv2/123doknet/14808528.610094/3.892.153.826.67.742/figure-calcium-signaling-influenced-curcumin-single-fluorescence-recordings.webp)
![Figure 5. BSA induces TRPM2-dependent increase in the [Ca 2+ ] i fluorescence intensity in the mpkCCD c14](https://thumb-eu.123doks.com/thumbv2/123doknet/14808528.610094/8.892.231.523.65.882/figure-induces-trpm-dependent-increase-fluorescence-intensity-mpkccd.webp)