Supporting Information 1
Supporting Information
Beyond Global Charge: Role of Amine Bulkiness and Protein Fingerprint on Nanoparticle-Cell Interaction
David Burnand, Ana Milosevic, Sandor Balog, Miguel Spuch-Calvar, Barbara Rothen-Rutishauser, Jörn Dengjel, Calum Kinnear,* Thomas L. Moore,* Alke Petri-Fink*
1. Experimental Section Inorganic synthesis
All chemicals were purchased from Sigma-Aldrich (Switzerland) and used without additional purification unless otherwise specified.
The procedure from Bastus et al.[1] was adapted. Synthesis of Au Seeds. A solution of 2.0 mM sodium citrate in Milli-Q water (150 mL) was heated with an oil bath in a 250 mL three-necked round-bottomed flask for 15 min under magnetic stirring. A condenser was utilized to prevent the solvent evaporation. After boiling had started, 1 mL of HAuCl4 (25 mM) was added. The color of the mixture changed from yellow to bluish gray and then to soft pink in 10 min. The resulting particles (around 10 nm at a concentration of 3E +12 NPs/mL)
are coated with negatively charged citrate ions and hence are well suspended in H2O.
Seeded Growth of Au NPs of up to 30 nm in Diameter
Immediately after the Au seeds in the same vessel, the reaction was cooled down to 90 °C. Then, 1 mL of sodium citrate (60 mM) and 1 mL of HAuCl4 solution (25 mM) were sequentially injected (time delay 2 min). After 30 min, aliquots were extracted for further characterization by UV-Vis spectroscopy.
Supporting Information 2
Characterization of Au NPs
TEM images were taken using a Phillips CM20 Biotwin operating at 80 kV. The suspension was washed twice via centrifugation (1 ml centrifuged twice 8,000 × g for 5 minutes) and re-dispersed in water. This suspension was drop cast onto a TEM grid and dried in air. A minimum of 200 particles were analyzed to obtain the size distribution, summarized in Table S1.
Table S1. Au NPs characteristics
Property [units] Value
Core diameter (TEM), n = 250 [nm] 26 ± 3 Mean surface area per Au NP [nm2] 2124 ± 28
Mean volume per Au NPs [nm3] 9202 ± 14
Extinction coefficient at 405 nm [M-1 cm-1] 1.76E +09
Zeta potential [mV] -43 ± 5
Functionalized Au NPs Colloidal Stability Characterization
UV-Visible spectroscopy was carried out on a Jasco V-670 spectrophotometer; Depolarized Dynamic Light Scattering (DDLS) on a 3D LS spectrometer (LS Instruments); Zeta-potential measurements on a 90Plus PALS (Brookhaven Instruments Cooperation). Zeta-potential measurements were made on a Brookhaven ZetaPALS (Table S1).
Organic Synthesis
All chemicals were purchased from Sigma-Aldrich (Switzerland) and used without additional purification unless otherwise specified. N-vinylacetamide was purchased from TCI. Vinyl acetate and N-methyl-vinylacetamide were freshly distilled to remove polymerization inhibitors. Carbon disulfide were purchased from Acros and ethanol was from VWR. Deuterated solvents were obtained from Cambridge Isotope Laboratory. Thin layer chromatography (TLC) plates were purchased from Merck.
Supporting Information 3
All reactions were carried out under inert atmosphere using Argon flux and all reactants were added via syringe. Solvent was removed by rotary evaporation at 40 °C and compounds were dried under high vacuum on a Schlenk-line.
Chain Transfer Agent Synthesis
i. Synthesis of O-ethyl S-2-phtalimidomethoxylxanthate CTA (I)
The procedure of Huang and coworkers was adapted. A mixture of phtalamide (41.1 g, 0.3 mol, 1.0 eq.) and deionized water (100 mL) was stirred for 10 min at room temperature. Formaldehyde solution (40 %, 27 mL, 0.4 mol, 1.3 eq.) was added. The solution was refluxed for 1.5 hours. After cooling to 0-5 °C, the resulting precipitate was collected by filtration, washed with cold water (0-5 °C, 200 mL) and dried in-vaccuo to give the corresponding hydroxymethylpthalimide. Yield: 47.7 g, 0.3 mol, 96.0 %.
A solution of thionyl chloride (16.1 mL, 26.4 g, 0.2 mol, 1.1 eq. ) in dichloromethane (35 mL) was slowly added to a mixture of the resulting N-hydroxymethylphtalimide (35.1g,0.2 mol, 1 eq.) in dichloromethane (380 mL) and N,N-dimethylformamide ( 241 mL) during 30 min at room temperature. The reaction was stirred overnight at room temperature under mechanical agitation. water (200 mL) was slowly added. The solution was neutralized to pH 6.7-7.0 using saturated aqueous NaHCO3 solution. The organic layer was separated, dried over magnesium sulfate and concentrated in-vaccuo. The residue was dissolved in chloroform, precipitated in ten-fold excess of hexane affording the
N-chloromethylphtalamide. Yield: 9.832 g, 50.3 mmol, 26.4 %.
N-chloromethylphtalimide (9.832 g, 50.3 mmol, 1 eq.) was dissolved in acetone (150 mL). Potassium O-ethyl xanthate (8.5 g, 52.9 mmol, 1.1 eq.) was added portionwise in an ice water bath under stirring. The solution was let stirred overnight at room temperature. Solvent was removed under reduced pressure. The crude residue was redissolved in dichloromethane. The resulting solution was washed 3 times with water, dried over magnesium sulfate and
Supporting Information 4
concentrated in-vaccuo. Pale yellow solid was obtained and recrystallized from ethyl acetate affording the desired xanthate as colorless crystals. Yield: 12.0 g, 42.7 mmol, 85.0%
1H NMR (CDCl3, 300 MHz) δ [ppm]: 7.89 (dd, J=5.5 Hz, 2H, ArH), 7.77 (dd, J=5.5 Hz, 2H, ArH), 5.36 (s, 2H, CH2), 4.7 (q, J=7.1 Hz, 2H, CH2), 1.48(t, J=7.1 Hz, 3H, CH3).
(ESI) m/z: [M + Na]+ calculated for C12H11NNaO3S2, 304.01; found, 304.0.
ii. Synthesis of Ethyl 2-(ethoxythiocarbonylthio) propanoate CTA (IV)
To a stirred solution of potassium hydroxide (13 g, 232.0 mmol, 1.0 eq.) in ethanol (100 g), carbon disulfide (18 g, 236.8 mmol, 1.0 eq.) was added dropwise. After stirring for 2 h, the solution was cooled to 5 °C, filtered and the crude product recrystallized twice from warm ethanol, giving a yellow powder . Yield: 24.2 g, 150.9 mmol, 65.0%.
Ethyl-2-bromo propionate (10.6 g, 58.6 mmol, 1.0 eq.) in dry acetonitrile (2 mL) was cooled to 0 °C and Potassium O-ethyl xanthate (10 g, 62.4 mmol, 1.1 eq.) was added portionwise. The suspension was stirred at room temperature for 2 h before the solvent was removed under reduced pressure. After redissolving in dichloromethane, the organic phase was washed with water and brine, dried over magnesium sulfate and concentrated. The crude product was purified via column chromatography with hexane: diethylether (19:1 to 9:1) as eluent giving a colorless liquid (IV). Yield: 8.1 g, 36.4 mmol, 62.1%.
1H NMR (CDCl3, 300 MHz) δ [ppm]: 4.63 (q, J=7.18 Hz, 2 H), 4.37 (q, J=7.37 Hz, 1 H), 4.20 (q, J=7.18 Hz, 2 H), 1.56 (d, J=7.55 Hz, 3 H), 1.41 (t, J=7.18 Hz, 3 H), 1.28 (t, J=7.08 Hz, 3 H)
Supporting Information 5
Polymer Synthesis
i. RAFT Polymerization of Vinyl Acetate (II)
The procedure described by Smith et al.[2] was modified. A mixture of freshly distilled vinyl acetate (17.025 g, 197.8 mmol), AIBN (29.0 mg, 0.2 mmol) and O-ethyl S-2 phtalamidomethylxanthate (I, 479.0 mg, 1.7 mmol) was degassed and fully immersed in a pre-heated oil bath (70 °C).
The polymerization was thermally quenched using an ice bath after 16 hours. The polymer was subsequently dissolved in dichloromethane and precipitated in a 10-fold excess of ice-cold hexane.
1H-NMR (400 MHz, DMSO-d6, δ): 7.90-7.70 (m, Ar H phtalamide), 4.90 (s, CH backbone), 4.70-4.55 (m, 2H, S=COCH2CH3 RAFT agent moiety), 4.20-4.10 (m, 2H, NCH2 RAFT agent moiety), 2.10-1.85 (m, CH3 backbone), 1.85-1.60 (m, CH2 backbone).
ii. Phtalamide deprotection and subsequent hydrolysis of poly(vinyl acetate) (III)
A mixture of phtalamide end functionalized poly(vinyl acetate) (II, 1.0 g , 0.1 mmol) in methanol (6 mL) was heated to 60 °C and treated with hydrazine hydrate aqueous solution (1.029 g/mL) 55% w/v (2.4 mL, 27.8 mmol) during 1.5 hours under stirring. A mixture of sodium hydroxide (980 mg, 24.5 mmol) in methanol (6 mL) was added dropwise, The reaction was allowed to stir at 65 °C overnight. After cooling down to room temperature, the crude polymer was filtrated under gravity and washed with ice cold methanol. Final mass: 234 mg, 4.5 × 10⁻² mmol, 45.2% yield.
1H-NMR (400 MHz, D2O, δ): 4.10-3.95, 1.80-1.30 (m, CH2 backbone).
iii. RAFT copolymerization of vinyl acetate and N-vinylacetamide (V)
A mixture of freshly distilled vinyl acetate (3.528 g, 41.0 mmol), N-vinylacetamide (387 mg, 4.6 mmol), AIBN (1.9 mg, 1.0 × 10⁻² mmol), ethyl 2-(ethoxythiocarbonylthio) propanoate
Supporting Information 6
(IV, 26.1 mg, 1.2 × 10⁻¹ mmol) and dry dioxane (2 mL) was degassed and fully immersed in a pre-heated oil bath (70 °C). The polymerization was thermally quenched using an ice bath after 19 hours. The polymer was subsequently dissolved in dichloromethane and precipitated in a 10-fold excess of ice-cold hexane.
1H-NMR (400 MHz, CHCl3-d, δ): 4.90 (s, CH backbone), 4.70-4.55 (m, 2H, S=COCH2CH3 RAFT agent moiety), 2.15-1.95 (m, CH3 backbone), 1.95-1.60 (m, CH2 backbone).
iv. Basic hydrolysis of poly(vinyl acetate-co-N-vinylacetamide) (VI)
A mixture of poly(vinyl acetate-co-N-vinylacetamide) (V, 1.0 g, 15.4 × 10⁻² mmol) in methanol (10 mL) was added dropwise to a preheated solution (65 °C) of sodium hydroxide (4.0 g, 100 mmol) in methanol (10 mL). The reaction was allowed to stir overnight at 65 °C. After cooling down to room temperature, solvent was removed under reduced pressure. The crude polymer was re-dissolved in Milli-Q water (30 mL) and neutralized using HCl 37%. The crude polymer was purified by dialysis in Milli-Q water.
Final mass: 420 mg , 11.3 × 10⁻² mmol, 73.4% yield.
1H-NMR (400 MHz, D2O, δ): 4.05-3.85 (s, CH backbone), 2.05-1.92 (m, CH3 acetamide backbone), 1.80-1.40 (m, CH2 backbone).
v. Acidic hydrolysis of poly(vinyl alcohol-co-N-vinylacetamide) (VII)
The procedure describe by Dréan et al.[3] was adapted. A mixture of poly(vinyl
alcohol-co-N-vinylacetamide) (VI, 420 mg, 11.3 × 10⁻² mmol) in Milli-Q water (6 mL) was heated to 75
°C. HCl 37% (6 mL) was added dropwise. The reaction was allowed to stir for 64 hours at 75 °C. The mixture was neutralized using NaOH 0.1 M. The crude polymer was purified by dialysis in Milli-Q water.
Supporting Information 7
Final mass: 242.3 mg, 7.2 × 10⁻² mmol, 63.7% yield. 1H-NMR (400 MHz, D2O, δ): 4.05-3.85 (s, CHOH backbone), 3.70-3.50 (s, CHNH2 backbone), 2.0-1.80 (m, CH2CHNH2} backbone), 1.80-1.40 (m, CH2CHOH backbone).
vi. RAFT copolymerization of vinyl acetate and N-methyl-N-vinylacetamide (VIII)
A mixture of freshly distilled vinyl acetate (3.528 g, 41.0 mmol), N-methyl-N-vinylacetamide (451 mg, 4.6 mmol), AIBN (1.9 mg, 1.0 × 10⁻² mmol), ethyl 2-(ethoxythiocarbonylthio) propanoate (IV, 26.1 mg, 12.0 × 10⁻² mmol) and dry dioxane (4 mL) was degassed and fully immersed in a pre-heated oil bath (70 °C). The polymerization was thermally quenched using an ice bath after 19 hours. The polymer was subsequently dissolved in dichloromethane and precipitated in a 10-fold excess of ice-cold hexane.
1H-NMR (400 MHz, CHCl3-d, δ): 5.10-4.50 (s, CH backbone), 4.20-4.05 (m, 2H, O=COCH2CH3 RAFT agent moiety), 2.90-2.65 (m, NCH3 backbone), 2.15-1.95 (m, CH3 backbone), 1.95-1.60 (m, CH2 backbone), 1.45-1.35 (m, 3H, O=COCH2CH3 RAFT agent moiety), 1.30-1.20 (m, 3H, S=COCH2CH3 RAFT agent moiety), 1.20-1.10 (m, 3H, O=CCHCH3 RAFT agent moiety).
vii. Basic hydrolysis of poly(vinyl acetate-co-N-methyl-N-vinylacetamide)
A mixture of poly(vinyl acetate-co-N-methyl-N-vinylacetamide) (VIII, 188 mg, 3.8 × 10⁻² mmol) in methanol (4 mL) was added dropwise to a preheated solution (65 °C) of sodium hydroxide (490 mg, 12.3 mmol) in methanol (8 mL). The reaction was allowed to stir overnight at 65 °C. After cooling down to room temperature, the solvent was removed under reduced pressure. The crude polymer was re-dissolved in Milli-Q water (12 mL) and neutralized using HCl 1M. The crude polymer was purified by dialysis in Milli-Q water.
Supporting Information 8
viii. Acidic hydrolysis of poly(vinyl alcohol-co-N-methyl-N-vinylacetamide) (IX)
A mixture of poly(vinyl alcohol-co-N-methyl-N-vinylacetamide) in Milli-Q water (6 mL) was heated to 75 °C. HCl 37% (6 mL) was added dropwise, the reaction was allowed to stir at 75 °C for 64 hours. The crude polymer was neutralized using NaOH 1 M and dialyzed against Milli-Q water.
Final mass: 43.8 mg, 0.016 mmol, 42.1% yield. 1H-NMR (400 MHz, D2O, δ): 4.20-3.85 (s, CH backbone), 2.80-2.55 (m, NCH3 backbone), 1.85-1.30 (m, CH2 backbone).
ix. Polymer methylation (X)
Poly (vinyl alcohol-co-N-Methyl-N-vinyl amine) (IX, 21.9 mg, 87.6 × 10⁻⁴ mmol) and para-formaldehyde (122 mg, 30.3 mmol) were dissolved in Milli-Q water (2 mL) and stirred at 65 °C for 2.5 hours. Dimethylamine complex 97% (31 mg, 52.6 × 10⁻² mmol) was added at 5 °C. The reaction was allowed to stir overnight at 5 °C. The water was removed under reduced pressure (10-2 mbar). The crude polymer was purified by size exclusion chromatography using (SEPHADEX cartridge). The collected fractions were freeze dried.
Final mass: 10.4 mg, 4.2 × 10⁻⁴ mmol, 47.5% yield.
1H-NMR (400 MHz, D2O + TFA, δ): 4.05-3.80 (s, CH backbone), 2.90-2.70 (m, N(CH3)2 backbone), 2.70-2.60 (s, NCH3 backbone), 2.00-1.30 (m, CH2 backbone).
Instrumentation
Visualization after TLC was performed with a 254 nm or 365 nm UV lamp. Flash column chromatography was performed on an Isolera One from Biotage. 1H NMR spectra were recorded on a Bruker Avance DPX 400 or DPX 300 MHz spectrometers at frequencies of 400.19 MHz or 300.23 MHz, respectively, for 1H nuclei and 100.63 MHz or 75.49 MHz, respectively, for 13C nuclei. Chemical shifts were expressed in parts per million (ppm; δ) and referenced internally to the residual solvent signal. Coupling constants (J) are reported in Hz.
Supporting Information 9
Multiplets are abbreviated as follows: s (singlet), d (doublet), dd (doublet of doublet), t (triplet), m (multiplet).
Flash column chromatography was performed on a Biotage Isolera One chromatography system.
Size exclusion chromatography (SEC) experiments were performed on an Agilent 1200 series HPLC system equipped with an Agilent PLgel mixed guard column (particle size = 5 μm) and two Agilent PLgel mixed-D columns (ID = 7.5 mm, L = 300 mm, particle size = 5 μm). Signals were recorded by a UV detector (Agilent 1200 series), an Optilab REX interferometric refractometer, and a miniDawn TREOS light scattering detector (Wyatt Technology Corp.). Samples were run using THF as the eluent at 30 °C and a flow rate of 1.0 mL/min. Data analyses were carried out on Astra software (Wyatt Technology Corp.) and molecular weights were determined based on narrow molecular weight polystyrene standards calibration (from 2,340 to 364,000 g/mol).
Supporting Information 10
Table S2. Calculated molecular weights from GPC traces and 1H-NMR
Polymer Calculated Mn Mn [Da] GPC Mw [Da] GPC Đ Mn [Da] 1H-NMR Mn [Da] after hydrolysis GPC
Phtalmide Poly(vinyl acetate) (II) 10,000 10,000 15,000 1.5 10,000 5,200 Poly(vinylacetate-co-N-vinyl
acetamide) (V)
34,000 6,600 13,700 2.1 6,500 3,300 Poly(vinyl
acetate-co-N-Vinyl-N-methyl acetamide) (VIII)
34,000 5,000 6,700 1.3 4,000 2,100-2,200
Table S3. Poly (vinyl alcohol) determination by Iodine KI blue complexometry
Nanoparticle type Total gold mass
[mg] Total polymer mass [mg] Polymer mass in supernatant [mg] Final packing density [units/nm2] Amine density [units/nm2]
Primary Pendant 7.5 5.3 0.5 10.9 99
Secondary Pendant 7.5 3.3 1.8 5.4 38
Tertiary Pendant 7.5 3.3 2.4 3.1 19
Primary Chain End 7.5 6.8 4.4 3.6 4
Au NPs Functionalization and Characterization
Citrate Au NPs at a concentration of 376 μg Au/mL was obtained and used as a stock solution for subsequent polymer functionalization. All citrate Au NPs were functionalized by ligand exchange with the corresponding polymer at an initial packing density of 12 polymer units/nm2. All reactions were allowed to stir overnight at room temperature. The resulting functionalized Au NPs were centrifuged at 10,000 g for one hour. Supernatant was removed and kept to analyze the uncoated polymer via iodine- PVA boric acid-complexometry (Figure S17). The NPs were re-dissolved in water Milli-Q and passed through a cotton filters to remove large aggregates formed during centrifugation.
The final packing density was assessed via iodine- PVA boric acid-complexometry (Table S3). The final Au concentration was estimated via UV-Vis spectroscopy following reports by Haiss et al.[4]
Colloidal stability measurements were made using dynamic light scattering (DLS). First, NPs were buffered in a 0.1 M NaOH solution. Particles were then diluted into RPMI-1640 cell culture media supplemented with 10% fetal bovine serum to a final concentration of
Supporting Information 11
40 μg Au/mL. Depolarized DLS measurements were made on a 3D LS spectrometer using a linearly polarized and collimated Cobolt 05-01 diode pumped solid state laser (λ = 660 nm, P max = 500 mW) over 24 hours at 37 °C.
The previous formulations prepared for colloidal stability were centrifuged at 10,000 g during one hour and re-suspended in PBS. This procedure was performed three times. Zeta-potential measurements were performed on a 90Plus PALS (Brookhaven Instruments Cooperation), equipped with a platinum electrode. The ζ-potential values were calculated from electrophoretic mobility using the Smoluchowski method for data processing (10 cycles). The viscosity, refractive index and dielectric constant of pure water were used to characterize the solvent.
Cellular Uptake by Inductively Coupled Plasma-Optical Emission Spectroscopy
A549 human lung epithelial cells and J774A.1 mouse monocyte/macrophages were acquired from ATCC/LGC Standards. For cell uptake studies, cells were used between passage 5 to 25. Into a 6-well plate, A549 human lung epithelial cells or J774A.1 murine monocyte/macrophages were seeded at 570,000 cells/well (60,000 cells/cm2). Cells were subcultured in RPMI-1640 supplemented with 10% fetal bovine serum (FBS) and 1% penicillin-streptomycin. For each uptake time point, cells were seeded in triplicate (i.e. three wells per time point per particle type/treatment). There were two main reasons for using serum supplemented cell-culture media, as opposed to human plasma or even whole blood, in this study. Firstly, the A549 and J774A.1 cell lines were optimised for culture in FBS-supplemented media, which also means the vast majority of comparative studies to date have used similar expose conditions. Secondly, recent findings indicate that even more complex environments, e.g. plasma or whole blood with anti-clotting agents, do not necessarily correlate any closer with the protein corona formed in vivo. Therefore, further efforts should be made to understand correlations between protein coronas formed in different exposure
Supporting Information 12
scenarios to that formed in vivo – something currently very challenging, technically, to accomplish accurately.
Cells attached overnight, and the next day the different NP formulations were added. Each NP formulation was buffered 1:1 in a 0.1 M NaOH solution, before diluting to a final concentration of 40 μg Au/mL in supplemented RPMI-1640 cell culture media. Cells were incubated with NPs overnight in an incubator at 37 °C and 5% CO2. After incubation, cells were washed twice with sterile phosphate buffered saline (PBS), excess PBS was removed, and cells were sealed and stored at -80 °C until further preparation for ICP-OES analysis.
Samples were brought to room temperature, and then 200 μL of nitric acid 60% and 100 μL of hydrogen peroxide 35% were added sequentially to the cells. The cells were predigested for 3 hours and sonicated at 50 °C for 15 minutes. Following, 400 μL of hydrochloric acid 37% solution were added to cells and digested overnight. The residual digestion mixture was transferred into a 15 mL Falcon tube and diluted to 5 mL with Milli-Q water. The cellular-uptake was measured using ICP-OES (Optima 7000DV, Perkin Elmer). Measurements were performed at a wavelength of 242.8 nm, at an axial plasma view. The plasma flow was 15 L/min and the sample flow rate 1.5 mL/min. A washing step was performed by the instrument between each measurement and each sample was measured three times on each repetition. The cellular uptake was calculated by dividing the measured Au mass by the mass of 1 NP divided by the seeded cells number/well.
Toxicity Experiments
For cytotoxicity studies, A549 human lung epithelial or J774A.1 murine monocyte/macrophages were seeded in a 96-well plate at 10,000 cells/well (31,250 cells/cm2) or 20,000 cells/well (62,500 cells/cm2), respectively. Each NP formulation was buffered in 0.1 M NaOH as described above, and added to cells at a final concentration of 40 μg Au/mL in
Supporting Information 13
supplemented RPMI-1640 cell culture media. Supplemented media only was used as a negative control, and 0.2% Triton X-100 was used as a positive control.
After overnight incubation of NPs at 37 °C and 5% CO2, an aliquot of cell culture media (100 μL) was removed and tested for lactate dehydrogenase activity using a standard cytotoxicity kit (Sigma-Aldrich). Remaining CCM was removed from wells, and cells were washed 2 × with sterile PBS. Next, 100 μL of 88 μM resazurin HCl dissolved in CCM was added to each well. Cells were incubated protected from light for 3 hr at 37 °C and 5% CO2. Fluorescent intensity was measured at an excitation wavelength of 560 nm and emission wavelength of 590 nm, and cell viability was determined by comparing fluorescence values of cells exposed to NPs to cells treated with only media.
1D SDS-PAGE and Silver Staining Analysis
Sample solutions prepared for the zeta potential measurement were used for protein analysis. Each formulation was mixed 4:1 with a 5 × concentrated Laemmli reducing sample buffer. Samples were denatured/desorbed for 48 hr at 75 °C. Next, 40 μL of each sample was loaded into a 4-15% gradient Mini-Protean® TGXTM precast gel (Bio-Rad, Hercules, California, USA) besides a Precision Plus ProteinTM Dual Color (Bio-Rad) molecular weight standard. Samples were run using a Bio-Rad electrophoresis system, first at 80 V until they entered the gel and then at 120 V. Proteins were stained using a previously described silver staining protocol.[5]
Mass Spectrometry Sample Preparation and Analysis
For MS analysis, NPs incubated with CCM were concentrated by ultrafiltration using vivaspin columns (30 kDa MWCO). Samples were heated in SDS-PAGE loading buffer, reduced with 1 mM DTT for 10 min at 75 °C and alkylated using 5.5 mM iodoacetamide for 10 min at room temperature. Protein mixtures were separated on 4-12% gradient gels (Nupage, Thermo
Supporting Information 14
Fisher). The gel lanes were cut into two equal slices, the proteins were in-gel digested with trypsin (Promega) and the resulting peptide mixtures were processed on STAGE tips and analyzed by LC-MS/MS.[6,7]
Mass spectrometric (MS) measurements were performed on a QExactive Plus mass spectrometer coupled to an EasyLC 1000 nanoflow-HPLC. HPLC-column tips (fused silica) with 75 μm inner diameter were self-packed with Reprosil-Pur 120 C18-AQ, 1.9 μm (Dr. Maisch) to a length of 20 cm. Samples were applied directly onto the column without a pre-column. A gradient of A (0.1% formic acid in water) and B (0.1% formic acid in 80% acetonitrile in water) with increasing organic proportion was used for peptide separation (loading of sample with 0% B; separation ramp: from 5-30% B within 85 min). The flow rate was 250 nL/min and for sample application 600 nL/min. The mass spectrometer was operated in the data-dependent mode and switched automatically between MS (max. of 1 × 10⁶ ions) and MS/MS. Each MS scan was followed by a maximum of ten MS/MS scans using normalized collision energy of 25% and a target value of 1000. Parent ions with a charge state from z = 1 and unassigned charge states were excluded for fragmentation. The mass range for MS was m/z = 370-1750. The resolution for MS was set to 70,000 and for MS/MS for 17,500. MS parameters were as follows: spray voltage 2.3 kV; no sheath and auxiliary gas flow; ion-transfer tube temperature 250 °C.
The MS raw data files were uploaded into the MaxQuant software version 1.4.1.2 for peak detection, generation of peak lists of mass error corrected peptides, and for database searches.[8] A full-length UniProt bovine database additionally containing common contaminants such as keratins and enzymes used for in-gel digestion (based on UniProt bovine FASTA version December 2016) was used as reference. Carbamidomethylcysteine was set as fixed modification and protein amino-terminal acetylation {deamidation (NQ), pyro-Glu, pyro-Gln} and oxidation of methionine were set as variable modifications. iBAQ was chosen as quantitation mode. Three missed cleavages were allowed, enzyme specificity
Supporting Information 15
was trypsin/P, and the MS/MS tolerance was set to 20 ppm. The average mass precision of identified peptides was in general less than 1 ppm after recalibration. Peptide lists were further used by MaxQuant to identify and relatively quantify proteins using the following parameters: peptide and protein false discovery rates, based on a forward-reverse database, were set to 0.01, minimum peptide length was set to 7, minimum number of peptides for identification and quantitation of proteins was set to one which must be unique, minimum ratio count was set to two, and identified proteins were re-quantified. The “match-between-run” option (2 min) was used.
Supporting Information 16
2. Supporting Information Results
F
Figure S1: (A-D) DDLS field auto-correlation functions of NPs in supplemented RPMI after
24 hours exposure. (E) DLS field auto-correlation function of citrate Au NPs in Milli-Q water. Solid lines correspond to the best fit curve and red circles represent experimental data.
Supporting Information 17
Figure S2. (A) Resazurin and (B) LDH cell viability assays in A549 human lung epithelial
cells and J774A.1 mouse monocyte/macrophages. Cells treated with only cell culture media acted as the negative control, and cells treated with 0.2% Triton X-100 were the positive control. Statistical significance was determined using ANOVA and Tukey’s HSD test (p < 0.05).
Supporting Information 18
A
B
Figure S4. GPC traces of (A) phtalamide end functionalized poly(vinyl acetate) (II). (B)
poly(vinyl acetate-co-N-vinyl acetamide) (V) and poly(vinyl acetate-co-N-Methyl-N-vinyl acetamide) (VIII) in THF.
Supporting Information 19 Measured:1745.75 Measured:2175.93 Calculated mass: 1745.78 x’=7, y’=11 Calculated mass: 2175.96 x’=7, y’=16 x’=6, y’=19 x’=6, y’=20 x’=6, y’=19 x’=6, y’=20 x’=7, y’=18 x’=7, y’=19 x’=5, y’=20 x’=5, y’=21 x’=4, y’=21 x’=4, y’=22 x’=3, y’=22 x’=3, y’=23 x’=9, y’=16 x’=9, y’=17 x’=8, y’=17 x’=8, y’=18
A
B
C
Figure S5. (A) MALDI-ToF mass spectrum of aminolyzed poly(vinyl acetate-co-N-vinyl
acetamide) (V), red lines depict the calculated position of the 12C peaks with increasing numbers of repeat units. (B) MALDI-ToF mass spectrum of poly(vinyl
acetate-co-N-Methyl-N-vinyl acetamide) (VIII) .(C) Zoom on the maximum peaks in mono-isotopic resolution,
Supporting Information 20
Figure S6. 1H-NMR spectrum of thiolated poly(vinyl alcohol-co-N-di-Methyl-N-vinyl amine) (X) recorded in D2O.
Supporting Information 21
Figure S7. HSQC 2D 13C-1H-NMR spectra of thiolated poly(vinyl alcohol-co-N-Methyl-N-vinyl amine) and thiolated poly(alcohol-co-N-Methyl-N-vinyl alcohol-co-N-di-Methyl-N-alcohol-co-N-Methyl-N-vinyl amine) with or without TFA recorded in D2O (IX/X).
Supporting Information 22
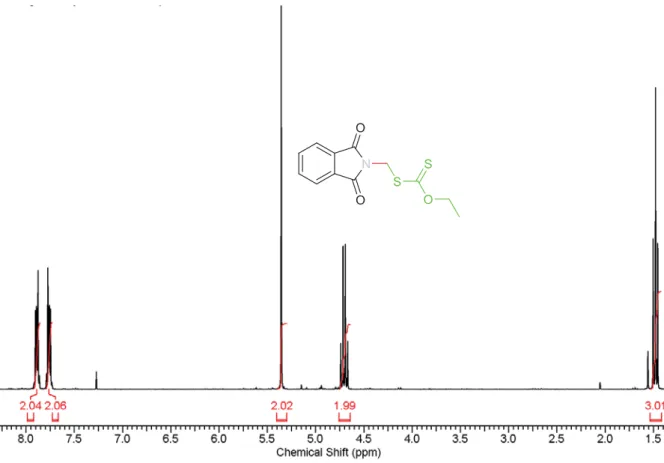
Figure S8. 1H-NMR spectrum of O-ethyl S-2-phtalimidomethylxanthate CTA (I) recorded in CDCl3.
Supporting Information 23
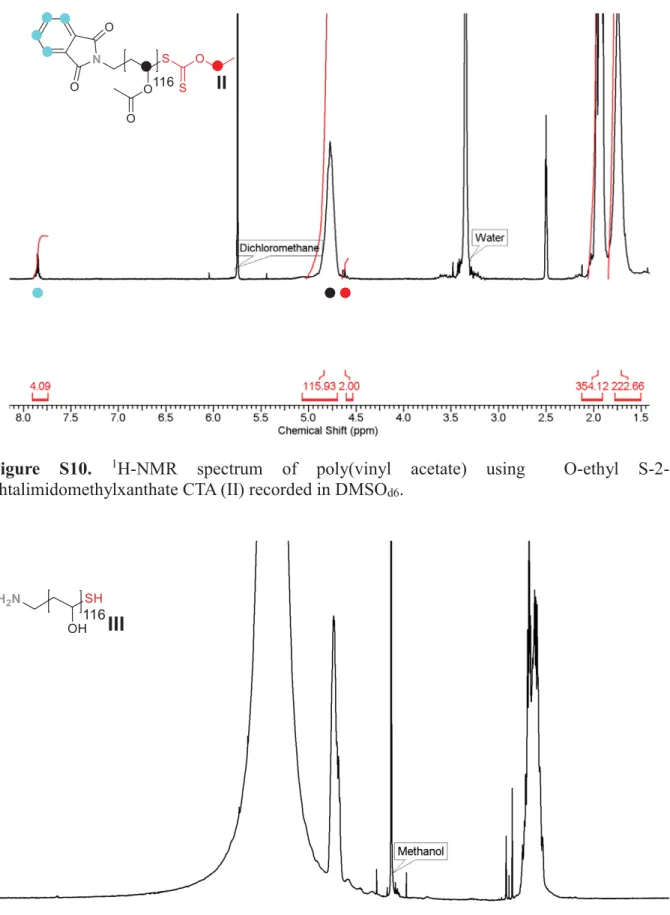
Figure S10. 1H-NMR spectrum of poly(vinyl acetate) using O-ethyl
S-2-phtalimidomethylxanthate CTA (II) recorded in DMSOd6.
Figure S11. 1H-NMR spectrum of poly (vinyl alcohol) amino end functionalized (III) recorded in D2O.
Supporting Information 24
Figure S12. 1H-NMR spectrum of ethyl 2-(ethoxythiocarbonylthio) propanoate (IV) recorded in CDCl3.
Supporting Information 25
Figure S14. 1H-NMR spectrum of poly(vinyl acetate-co-N-vinylacetamide) (V) recorded in CDCl3.
Supporting Information 26
Figure S15. 1H-NMR spectrum of thiolated poly(vinyl alcohol-co-N-vinylacetamide) (VI) recorded in D2O.
Figure S16. 1H-NMR spectrum of thiolated poly(vinyl alcohol-co-N-vinylamine) (VII) recorded in D2O.
Supporting Information 27
Figure S17. 1H-NMR spectrum of Poly(vinyl acetate-co-N-Vinyl-N-methyl acetamide) (VIII) recorded in CDCl3.
Supporting Information 28
Figure S18. (A) UV-Vis extinction spectra of primary pendant amino polymer supernatant
complexed with a mixture of boric acid and KI/I2 using standard addition method and (B) the associated calibration curve. (C) UV-Vis extinction spectra of secondary and tertiary amino polymers using a standard method and (D) the associated calibration curve. (E) UV-Vis extinction spectra of primary chain end polymers and (F) the associated calibration curve.
Supporting Information 29
Supporting Information 30
Table S4. Cellular uptake quantification. Au3+ calibration standards determined by ICP-OES
Au3+ standards [ppm] Net intensity [a.u.]
0.000 47 ± 30 0.025 279 ± 16 0.050 584 ± 5 0.075 932 ± 3 0.100 1220 ± 8 0.125 1818 ± 9 0.150 1818 ± 9 0.200 2384 ± 23 0.250 3099 ± 27 0.500 6157 ± 144 1.000 12196 ± 109 3.000 36989 ± 109 5.000 62843 ± 254 7.000 86054 ± 333
Table S5. Quantification of cellular uptake for Secondary and Tertiary NPs. Au3+ determined
by ICP- OES
Sample Cells Au3+ [ppm] Number of NPs/cell Average
Pendant Secondary x1 A549 0.7 10,925
10,296 ± 622 Pendant Secondary x2 A549 0.6 10,281
Pendant Secondary x3 A549 0.6 9,681 Pendant Tertiary x1 A549 0.7 11,822
11,327 ± 433 Pendant Tertiary x2 A549 0.7 11,022
Pendant Tertiary x3 A549 0.7 11,136 Pendant Secondary x1 J774A.1 9.9 156,203
157,542 ± 1,632 Pendant Secondary x2 J774A.1 10.1 159,360
Pendant Secondary x3 J774A.1 9.9 157,062 Pendant Tertiary x1 J774A.1 8.7 136,907
141,244 ± 4,781 Pendant Tertiary x2 J774A.1 8.9 140,456
Supporting Information 31
Table S6. Cellular uptake quantification. Au3+ calibration standards determined by ICP-OES
Au3+ standards [ppm] Net intensity [a.u.]
0.000 295 ± 27 0.025 351 ± 16 0.050 581 ± 9 0.075 796 ± 9 0.100 987 ± 5 0.125 1207 ± 32 0.150 1404 ± 3 0.200 1863 ± 5 0.250 2347 ± 5 0.500 4685 ± 37 1.000 9299 ± 63 3.000 27396 ± 110 5.000 44462 ± 223 7.000 61847 ± 423
Table S7. Cellular uptake quantification for Primary Pendant and Chain End NPs. Au3+
determined by ICP- OES
Sample Cells Au3+ [ppm] Number of NPs/cell Average
Primary Chain End x1 A549 0.029 459
448 ± 174 Primary Chain End x2 A549 0.039 617
Primary Chain End x3 A549 0.017 269 Primary Pendant x1 A549 11.88 187,906
179,207 ± 9,787 Primary Pendant x2 A549 11.45 181,105
Primary Pendant x3 A549 10.66 168,610 Primary Chain End x1 J774A.1 0.179 2,831
2,562 ± 236 Primary Chain End x2 J774A.1 0.156 2,467
Primary Chain End x3 J774A.1 0.151 2,388 Primary Pendant x1 J774A.1 10.03 158,645
157,221 ± 4,979 Primary Pendant x2 J774A.1 10.20 161,334
Supporting Information 32
Figure S20. Brightfield microscopy images of J774A.1 mouse monocyte/macrophages after
24 hours incubation with Au NPs at 40 μg Au/mL.
Figure S21. Brightfield microscopy images of A549 human lung epithelial cells after 24
Supporting Information 33
3. Supporting Information References
[1] N. Bastús, J. Comenge, V. Puntes, Langmuir 2011, 27, 11098.
[2] A. A. A. Smith, T. Hussmann, J. Elich, A. Postma, M.-H. Alves, A. N. Zelikin, Polym.
Chem. 2012, 3, 85.
[3] M. Dréan, P. Guégan, C. Jérôme, J. Rieger, A. Debuigne, Polym. Chem. 2016, 7, 69. [4] W. Haiss, N. T. K. Thanh, J. Aveyard, D. G. Fernig, Anal. Chem. 2007, 79, 4215. [5] M. Chevallet, S. Luche, T. Rabilloud, Nat. Protocols 2006, 1, 1852.
[6] A. Shevchenko, H. Tomas, J. Havli, J. Olsen, M. Mann, Nat. Protocols 2006, 1, 2856. [7] J. Rappsilber, M. Mann, Y. Ishihama, Nat. Protocols 2007, 2, 1896.