HAL Id: hal-03065555
https://hal.archives-ouvertes.fr/hal-03065555
Submitted on 21 Dec 2020HAL is a multi-disciplinary open access archive for the deposit and dissemination of sci-entific research documents, whether they are pub-lished or not. The documents may come from teaching and research institutions in France or abroad, or from public or private research centers.
L’archive ouverte pluridisciplinaire HAL, est destinée au dépôt et à la diffusion de documents scientifiques de niveau recherche, publiés ou non, émanant des établissements d’enseignement et de recherche français ou étrangers, des laboratoires publics ou privés.
Distributed under a Creative Commons Attribution| 4.0 International License
Transcriptomics at Maize Embryo/Endosperm Interfaces
Identifies a Transcriptionally Distinct Endosperm
Subdomain Adjacent to the Embryo Scutellum
Nicolas Doll, Jérémy Just, Véronique Brunaud, José Caïus, Aurélie Grimault,
Nathalie Depège-Fargeix, Eddi Esteban, Asher Pasha, Nicholas Provart,
Gwyneth Ingram, et al.
To cite this version:
Nicolas Doll, Jérémy Just, Véronique Brunaud, José Caïus, Aurélie Grimault, et al.. Transcriptomics at Maize Embryo/Endosperm Interfaces Identifies a Transcriptionally Distinct Endosperm Subdomain Adjacent to the Embryo Scutellum. The Plant cell, American Society of Plant Biologists (ASPB), 2020, 32 (4), pp.833-852. �10.1105/tpc.19.00756�. �hal-03065555�
1 LARGE-SCALE BIOLOGY ARTICLES
1 2
Transcriptomics at maize embryo/endosperm interfaces identify a novel
3
transcriptionally distinct endosperm sub-domain adjacent to the embryo
4
scutellum (EAS).
5
Nicolas M. Doll1, Jeremy Just1, Véronique Brunaud2,3, José Caïus2,3, Aurélie Grimault1,
6
Nathalie Depège-Fargeix1, Eddi Esteban4, Asher Pasha4, Nicholas J. Provart4, Gwyneth C.
7
Ingram1, Peter M. Rogowsky1 and Thomas Widiez1*
8 9
1 Laboratoire Reproduction et Développement des Plantes, Univ Lyon, ENS de Lyon, UCB Lyon 1, 10
CNRS, INRAE, F-69342, Lyon, France. 11
2 Institute of Plant Sciences Paris Saclay IPS2, CNRS, INRA, Université Paris-Sud, Université Evry, 12
Université Paris-Saclay, Bâtiment 630, F-91405 Orsay, France. 13
3 Institute of Plant Sciences Paris-Saclay IPS2, Paris Diderot, Sorbonne Paris-Cité, Bâtiment 630, F-14
91405, Orsay, France. 15
4 Department of Cell and Systems Biology/Centre for the Analysis of Genome Evolution and Function, 16
University of Toronto, Toronto, Ontario M5S 3B2, Canada. 17
* Address correspondence to thomas.widiez@ens-lyon.fr 18
19
Running Title:
Maize embryo/endosperm interfaces transcriptomics 2021
One-sentence summary
: A previously undescribed population of endosperm cells adjacent to 22the embryo scutellum shows transcriptomic enrichment in transport functions and is influenced by 23
embryo development. 24
25
The author responsible for distribution of materials integral to the findings presented in this 26
article in accordance with the policy described in the Instructions for Authors 27
(www.plantcell.org) is: Thomas WIDIEZ (thomas.widiez@ens-lyon.fr) 28
Abstract
29Seeds are complex biological systems comprising three genetically distinct tissues nested 30
one inside another (embryo, endosperm and maternal tissues). However, the complexity of 31
the kernel makes it difficult to understand inter compartment interactions without access to 32
spatially accurate information. Here we took advantage of the large size of the maize kernel 33
to characterize genome-wide expression profiles of tissues at embryo/endosperm interfaces. 34
Our analysis identifies specific transcriptomic signatures in two interface tissues compared 35
to whole seed compartments: The scutellar aleurone layer (SAL), and the newly named 36
endosperm adjacent to scutellum (EAS). The EAS, which appears around 9 days after 37
pollination and persists for around 11 days, is confined to one to three endosperm cell layers 38
adjacent to the embryonic scutellum. Its transcriptome is enriched in genes encoding 39
transporters. The absence of the embryo in an embryo specific (emb) mutant can alter the 40
expression pattern of EAS marker genes. The detection of cell death in some EAS cells 41
together with an accumulation of crushed cell walls suggests that the EAS is a dynamic zone 42
from which cell layers in contact with the embryo are regularly eliminated, and to which 43
additional endosperm cells are recruited as the embryo grows. 44
2
Introduction
45
Cereal grains are not only essential for plant propagation, but are also high value 46
products which represent an important source of calories and proteins for human nutrition 47
and animal feed, as well as a coveted resource for bio-sourced industries. In maize, the 48
accumulation of oil in the embryo and of starch and protein in the endosperm requires the 49
development of adapted structures and a coordinated regulation and distribution of nutrient 50
flow from the mother plant. The development of the embryo, which will form the future 51
plant, and the endosperm, which will nourish the embryo during germination occurs in three 52
main phases (Berger, 1999; Dumas and Rogowsky, 2008; Lopes and Larkins, 1993). During 53
the first two weeks of early maize seed development, embryo and endosperm cells 54
differentiate into populations forming distinct tissues and organs (Leroux et al., 2014; 55
Randolph, 1936), including two storage organs, the scutellum of the embryo and the starchy 56
endosperm (early development phase). These two zygotic compartments then start to 57
accumulate large quantities of storage compounds during the following two to three weeks 58
(filling phase), while the surrounding maternal tissues provide or transport the necessary 59
nutrient supplies (Porter et al., 1987; Wu and Messing, 2014). During the final four weeks 60
(maturation phase), the kernel dehydrates and enters into quiescence prior to dispersal 61
(Sabelli and Larkins, 2009; Sreenivasulu and Wobus, 2013; Vernoud et al., 2005). These three 62
phases are determined by distinct genetic programs and characterized by distinct anatomical 63
and cytological features. Spatially, the maize kernel is organized like Russian dolls, the 64
embryo being enclosed within the endosperm, which is itself surrounded by the pericarp. 65
A closer look at the highly differentiated structure displayed by the maize embryo 66
shows that four days after pollination (DAP) two distinct parts can be distinguished: an apical 67
embryo proper and a basal suspensor that will degenerate at the end of early development 68
(Doll et al., 2017; Giuliani et al., 2002). At around 8 DAP the embryo proper generates, at the 69
abaxial side, a shield-shaped organ, the above-mentioned scutellum. The shoot apical 70
meristem develops on the adaxial side. Marking the apical pole of the future embryonic axis, 71
the shoot apical meristem will produce several embryonic leaves over time. The root apical 72
meristem differentiates within the embryo body defining the basal pole of the embryonic 73
axis. Shoot and root meristems will be surrounded by the protective coleoptile and 74
coleorhiza respectively (Bommert and Werr, 2001; Randolph, 1936; Vernoud et al., 2005). 75
3 The surrounding endosperm, which occupies 70% of the kernel volume at the end of the 76
early development (Leroux et al., 2014; Rousseau et al., 2015; Sabelli and Larkins, 2009; Zhan 77
et al., 2017), has been described as differentiating only four main cell types. The basal 78
endosperm transfer layer (BETL) and the aleurone layer (AL) are two peripheral cell types in 79
contact with maternal tissues. The embryo-surrounding region (ESR) is formed of small 80
densely cytoplasmic cells encircling the young embryo. Lastly, the starchy endosperm (SE) 81
corresponds to the central region of the endosperm, which subsequently accumulates huge 82
amounts of storage compounds before undergoing progressive programmed cell death. The 83
developing endosperm is surrounded by maternal tissues: the nutritive nucellus that 84
degenerates as the endosperm expands, and the protective pericarp, which comprises the 85
pedicel at the basal pole (Berger, 2003; Olsen, 2001; Sabelli and Larkins, 2009; Zhan et al., 86
2017). 87
The parallel growth and profound developmental transformations of the three kernel 88
compartments highlight the need for constant coordination, which likely requires a complex 89
inter-compartmental dialog (Ingram and Gutierrez-Marcos, 2015; Nowack et al., 2010; 90
Widiez et al., 2017). Since maternal tissues, endosperm and embryo are symplastically 91
isolated, their apoplastic interfaces represent essential zones for this dialog (Diboll and 92
Larson, 1966; Van Lammeren, 1987). A good example to illustrate the importance and 93
specialisation of interfaces is carbon transport. Sugars must be transported from the 94
maternal tissues to the embryo for growth and fatty acid accumulation, passing through the 95
endosperm, which needs to retain part of the carbon for its own growth as well as the 96
biosynthesis of starch and storage proteins (Chourey and Hueros, 2017; Sabelli and Larkins, 97
2009). In maize, nutrients are unloaded from open ends of the phloem vessels into the 98
placento-chalazal zone of the maternal pedicel (Bezrutczyk et al., 2018; Porter et al., 1987). 99
At the base of the endosperm, the BETL cells form dramatic cell wall ingrowths, thus 100
increasing the exchange surface (Davis et al., 1990; Kiesselbach and Walker, 1952). BETL cells 101
express a specific set of genes, including MINIATURE1, encoding a cell wall invertase, which 102
cleaves sucrose into hexoses. These are taken up by the sugar transporter SWEET4c, which 103
has been demonstrated to be the key transporter of sugar at the pedicel/endosperm 104
interface, since the defects in seed filling of the corresponding sweet4c mutant lead to a 105
miniature kernel phenotype (Cheng et al., 1996; Kang et al., 2009; Lowe and Nelson, 1946; 106
Sosso et al., 2015). The remaining endosperm interface with maternal tissues (initially the 107
4 nucellus and later on the pericarp) is the AL, which is not known to contribute to nutrient 108
exchange during seed development (Gontarek and Becraft, 2017). 109
The interface between the endosperm and the embryo is also developmentally 110
dynamic. At 3-6 DAP, the embryo is totally surrounded by ESR-type cells. As the embryo 111
expands, it emerges from the ESR, which consequently becomes restricted to the zone 112
surrounding the basal part (suspensor) of the embryo and ultimately disappears together 113
with the suspensor at the end of the early development phase (Giuliani et al., 2002; 114
OpsahlFerstad et al., 1997). From 8-9 DAP, the upper part (embryo proper) forms two new 115
interfaces: (1) At the adaxial side the embryo is enclosed by a single cell layer, which is called 116
the scutellar aleurone layer (SAL) in barley (Jestin et al., 2008). (2) At the abaxial side, the 117
embryo is brought into direct contact with central starchy endosperm cells (Van Lammeren, 118
1987). This interface is constantly moving due to the growth of the scutellum inside the 119
endosperm. On the embryo side of this interface, the epidermis of the scutellum has a 120
distinct morphology and gene expression pattern (Bommert and Werr, 2001; Ingram et al., 121
2000). The dynamics of the endosperm/embryo interface, and the processes that occur 122
there, remain largely undescribed. 123
At many inter-compartmental interfaces, such as the BETL, the ESR or the AL, the 124
cells constitute readily identifiable tissues with distinctive and often striking cell 125
morphologies, and with defined organisations and established functions (except for the ESR) 126
(for review see Doll et al., 2017). In many cases specific sets of genes are expressed in these 127
tissues, as revealed by the identification and characterisation of marker genes, for example 128
of MATERNALLY EXPRESSED GENE 1 (MEG1), MYB-RELATED PROTEIN 1 (MRP1) and BETL1 to 129
4 (Cai et al., 2002; Gómez et al., 2002; Gutiérrez-Marcos et al., 2004; Hueros et al., 1999a,
130
1999b) in the BETL, VIVIPARIOUS 1 (VP1) in the AL (Suzuki et al., 2003), or ESR1 to 3 in the 131
ESR (OpsahlFerstad et al., 1997). 132
Genome-wide gene expression studies at numerous developmental stages of whole 133
kernels and/or hand-dissected endosperm and embryo (Chen et al., 2014; Downs et al., 134
2013; Li et al., 2014; Lu et al., 2013; Meng et al., 2018; Qu et al., 2016) have been 135
complemented by a recent transcriptomic analysis of laser-capture micro-dissected cell 136
types and sub-compartments of 8 DAP kernels (Zhan et al., 2015). However, even the latter 137
study did not address specifically the transcriptomic profiles of the embryo/endosperm 138
5 interfaces and did not answer the question of whether the endosperm at the 139
scutellum/endosperm interface is composed of cells with specific transcriptional identities. 140
In this study, we took advantage of the large size of the maize kernel to characterize 141
the genome-wide gene expression profile at embryo/endosperm interfaces at 13 DAP. RNA-142
seq profiling revealed that endosperm cells in close contact with the embryo scutellum have 143
a distinct transcriptional signature allowing us to define a new endosperm zone named EAS 144
for Endosperm Adjacent to Scutellum, which is specialized in nutrient transport based on GO 145
(Gene Ontology) enrichment analysis. In situ hybridization shows that the EAS is confined to 146
one to three endosperm cell layers adjacent to the scutellum, whereas kinetic analyses show 147
that the EAS is present when the scutellum emerges at around 9 DAP and persists 148
throughout embryo growth, up to approximately 20 DAP. The detection of cell death in the 149
EAS together with impaired expression of EAS marker genes in an embryo specific mutant 150
suggests that the EAS is adevelopmentally dynamic interface influenced by the presence of 151
the neighbouring growing embryo. 152
153 154
6
Results
155
RNA-seq profiling of 13 DAP maize kernel compartments and
156
embryo/endosperm interfaces.
157
To obtain the gene expression patterns of embryo/endosperm interfaces in maize 158
kernels, six (sub)compartments were hand-dissected for transcriptomic analysis (Figure 1 159
and Supplemental Figure 1). The three whole compartments were: the maternal tissues 160
excluding the pedicel which were labelled pericarp (Per), the whole endosperm (End), and 161
the whole embryo (Emb) (Figure 1). The sub-compartments corresponding to three distinct 162
embryo/endosperm interfaces were the scutellar aleurone layer (SAL) (the single endosperm 163
cell layer at the adaxial side of the embryo), the apical scutellum (AS) (corresponding to the 164
embryo tip composed uniquely of scutellum tissues without the embryo axis), and a new 165
region that we named endosperm adjacent to scutellum (EAS) corresponding to several 166
layers of endosperm cells in close contact with the scutellum at the abaxial side of the 167
embryo (Figure 1 and Supplemental Figure 1). The tissues were collected from kernels of 168
inbred line B73 (used to establish the maize reference genome) at 13 DAP (embryo size of 169
about 2.5 mm), the earliest developmental stage at which hand dissection of these 170
embryo/endosperm interfaces was feasible, and also the transition from early development 171
to the filling phase. For each of the six samples, four biological replicates, each composed of 172
a pool of dissected tissues from two different plants, were produced (Supplemental Table 1). 173
A total of 24 RNA-seq libraries were constructed and sequenced in paired-end mode using 174
Illumina HiSeq2000 technology. The resulting reads (on average 62 million pairs per sample) 175
were checked for quality, cleaned and mapped to the current version of the B73 maize 176
reference genome (AGPv4). On average 95.8% (± 0.4%) of the pairs were mapped, and on 177
average 78.3% (± 5.3%) corresponded to annotated genes (Supplemental Figure 2A). Pairs 178
that mapped to multiple genes (10.2% ± 5.3%) or to no gene (5.2% ± 1.1%), as well as 179
ambiguous hits (1.5% ± 0.6%) were filtered (Supplemental Figure 2A). A gene was considered 180
to be not expressed if it gives rise to less than 1 read per million. At least 25 000 genes were 181
found to be expressed per replicate, with the largest number found in the SAL (~30 000 182
genes expressed, Supplemental Figure 2A). The results generated for each replicate are 183
available in Supplemental Data Set 1. Venn diagrams were generated to visualize overlaps 184
between the sets of genes expressed in the three whole compartments (Per, Emb and End), 185
7 and between the sets of genes expressed in the End and the two endosperm sub-186
compartments (EAS and SA) (Figure 2A-B). 187
In order to assess the relationships between the different samples, a principal 188
component analysis (PCA) was performed (Figure 2C). As expected, biological replicates 189
grouped together, indicating experimental reproducibility. The PCA also revealed distinct 190
sample populations corresponding to each (sub)compartment with the exception of the AS 191
and Emb samples, which were partially superimposed (Figure 2C). Interestingly, the two 192
endosperm interfaces SAL and EAS formed groups that were distinct both from each other, 193
and from the whole endosperm samples. The EAS was more similar to the whole endosperm 194
8 than the SAL, indicating a more similar transcriptomic landscape (Figure 2C). To explore 195
potential contamination between tissues during the dissection process, the expression 196
profiles of previously identified marker genes with tissue-specific expression patterns were 197
investigated (Figure 2D-G). ZmLEC1 (Zm00001d017898) and ZmNAC124 (Zm00001d046126, 198
named ZmNAC6 by Zimmermann and Werr, 2005), two embryo-specific genes, were 199
specifically expressed in the embryo samples in our dataset (Figure 2D). As expected, 200
ZmLEC1 was more strongly expressed in the Emb than in the AS sample (Zhang et al., 2002).
201
Absence of ZmNAC124 expression in the AS was consistent with the strong and specific in 202
situ hybridisation signal for this gene in the basal part of the embryonic axis (Zimmermann
203
and Werr, 2005). The two endosperm-specific genes ZmZOU/O11 (Zm00001d003677) and 204
O2 (Zm00001d018971) were found to be strongly expressed in the End and EAS, and weakly
205
in the SAL samples (Figure 2E) (Feng et al., 2018; Grimault et al., 2015; Schmidt et al., 1990). 206
A weak expression in the Per sample was unexpected but consistent with other 207
transcriptomics data (Sekhon et al., 2011), and could also reflect possible contamination of 208
the Per samples with aleurone layer, since the aleurone layer has a tendency to stick to the 209
pericarp (See discussion part). In addition, the preferential expression of AL9 and 210
Zm00001d024120 genes in the aleurone was reflected by a stronger signal in SAL compared
211
to End (Gomez et al., 2009; Li et al., 2014; Zhan et al., 2015). AL9 (Zm00001d012572) and 212
Zm00001d024120 also showed a signal in the pericarp samples, again indicating a possible
213
contamination of the Per samples by SAL (Figure 2F). The expression patterns of ESR marker 214
genes (ESR1, ESR2 and ESR3) were also evaluated in our samples. At 13 DAP, the ESR 215
comprises a small endosperm region situated at the base of embryo, around the suspensor 216
(OpsahI-Ferstad et al., 1997). We observed elevated expression of ESR markers in the SAL 217
and to less extent in the EAS (Figure 2G). Previous in situ hybridizations of ESR1 transcripts 218
9 showed that ESR1 expression is restricted to the ESR and absent from the EAS and most if 219
not all of the SAL at both 12 and 14 DAP (OpsahI-Ferstad et al., 1997). However, the basal 220
part of the SAL is in direct contact with the ESR (OpsahI-Ferstad et al., 1997), and the 221
published data do not exclude the possibility that the ESR1 signal might extend to the SAL in 222
this basal part. The apparent elevated expression of ESR marker genes in our SAL 223
transcriptomes may thus reveal contamination with adjacent ESR cells during dissection 224
and/or expression in the basal part of the SAL. 225
In order to compare our full transcriptomic data set with published RNA-seq data, we 226
used a unique, spatially resolved, maize kernel transcriptome (Zhan et al., 2015). Although 227
different (sub)compartments and developmental stages (8 DAP vs 13 DAP) were used, we re-228
treated both RNA-seq raw data-set using the same bioinformatic pipeline and the same 229
genome version (see Material and Methods) in order to increase comparability. We then 230
performed a PCA on joint datasets. The first principal component (PC1) carries 43.7% of the 231
variance and clearly separates the two datasets (Supplemental Figure 3A). It may reflect a 232
“batch effect”, combination of biological effect of the age of sampling (8 DAP vs 13 DAP), 233
and technical differences between the two transcriptomes (growing environment, library 234
preparation, etc). The next components group together samples from the two datasets, and 235
still carries a relatively high fraction of the variance (26.9% and 9.7% for PC2 and PC3, 236
respectively). When PC2 was plotted against PC3, 13 DAP Emb is most similar to 8 DAP Emb 237
samples among the 8 DAP samples (Supplemental Figure 3B), indicating that although 238
important differences exist between these two datasets, these two embryo samples share 239
some similarities in their transcriptomic profiles. Likewise, the 13 DAP AS is most similar to 240
the 8 DAP Emb samples among 8 DAP samples (Supplemental Figure 3B). The 13 DAP SAL 241
groups most closely to the two 8 DAP samples BETL and ESR. Interestingly, the 13 DAP EAS 242
samples form an independent group that is closer to the two 8 DAP starchy endosperm 243
samples (which are the central starchy endosperm (CSE) and the conducting zone (CZ)), 244
among the 8 DAP samples (Supplemental Figure 3B). 245
In summary, we have generated RNA-seq profiles from 13 DAP maize kernel 246
compartments and embryo/endosperm interfaces. We have made this data available to the 247
community in a user-friendly format via the eFP Browser
248
(http://bar.utoronto.ca/efp_maize/cgi-bin/efpWeb.cgi?dataSource=Maize_Kernel) (Private 249
10
link for reviewers:
http://bar.utoronto.ca/~asher/efp_maize/cgi-250
bin/efpWeb.cgi?dataSource=Maize_Kernel) (See supplemental Figure 4 for examples). 251
252
Preferentially expressed genes and biological processes associated with
253
specific maize kernel (sub)compartments.
254
Differential expression analyses were performed between the 6 (sub)compartments 255
by comparing expression levels between pairs of tissues using a likelihood ratio test with
p-256
values adjusted by the Benjamini-Hochberg procedure to control false discovery rates (see
257
Material and Methods). Genes with both adjusted p-values lower than 0.05 and an
258
expression difference of 4-fold or greater (log2(Fold Change) ≥ 2) were classed as
259
differentially expressed genes (DEGs) (Supplemental Table 2). The full lists of DEGs for the 15
260
inter-tissue comparisons performed are available in Supplemental Data Set 2.
261
To identify the biological processes associated with the DEGs, a gene ontology (GO)
262
analysis was performed. Due to the limited resources available, a new genome-wide
263
annotation of all predicted proteins was carried out and linked to GO terms (see Material
264
and Methods). In a first instance, GO terms enriched in the two zygotic compartments Emb
265
and End were identified by analysing DEGs upregulated in each compartment compared to
266
the two other main compartments (Table 1). The top ten GO terms enriched in the DEGs
267
upregulated in the embryo relative to endosperm and pericarp, showed a significant
268
enrichment in GO terms related to the cell cycle, DNA organization and cytoskeleton
269
organization, consistent with the extensive developmental and mitotic activity within the
270
embryo at this stage (Table 1). In contrast the GO terms enriched in the DEGs upregulated in
271
the endosperm relative to embryo and pericarp were linked to metabolic functions such as
272
nutrient reservoir activity and starch biosynthetic (Table 1). These enrichments were
273
consistent with the fact that the endosperm is a nutrient storage compartment where starch
274
and reserve proteins are synthesized (Nelson and Pan, 1995; Zheng and Wang, 2015).
275 276
Enrichment for putative transporters at the endosperm/embryo interface
277
Focusing in on the embryo/endosperm interfaces, DEGs between the three sub-278
compartments (AS, SAL and EAS) and their whole compartments of origin were identified 279
11 (Supplemental Table 2). 682 genes were found to be differentially expressed between AS 280
and Emb according to the above criteria. Among them, 82 were more strongly and 600 more 281
weakly expressed in AS compared to Emb samples (Supplemental Table 2). As expected, 282
ZmNAC124, which is expressed in the coleorhiza (Figure 2D and Figure 3C, D) (Zimmermann
12
and Werr, 2005) was found among the genes showing reduced expression in the apical 284
scutellum. Only the GO term “DNA binding transcription factor activity” were found to be 285
significantly enriched in our analysis in the comparison of AS vs Emb (Table 2). 286
The comparison between the EAS and the End revealed 1 498 DEGs with 485 genes 287
showing stronger expression in the EAS than the End, and 1 013 genes with the inverse 288
profile (Supplemental Table 2). Among the genes more strongly expressed in the EAS, our 289
GO analysis revealed a significant enrichment in only one GO term (GO analysis on molecular 290
function terms at F3 level): “transmembrane transporter activity” (Table 2), which suggests a 291
stronger expression of transporter-encoding genes in the EAS compared to End. 292
Finally, 2 975 genes were found to be differentially expressed between SAL and End, 293
1 995 corresponding to genes more strongly expressed in the SAL, and 980 to genes with 294
lower expression levels in the SAL (Supplemental Table 2). Interestingly, in the first group our 295
GO analysis revealed an enrichment in two (out of 4) GO terms related to transport (Table 296
2). 297
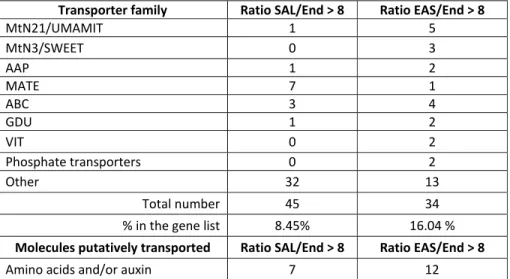
A closer look at gene families encoding transporters amongst DEGs confirmed the 298
overrepresentation seen in the GO analysis and revealed differences between the SAL and 299
EAS. Among the genes that were at least 8 times more strongly expressed compared to End, 300
8.45 % (45/532) of the genes enriched in the SAL and 16.04 % (34/212) of the genes enriched 301
in the EAS have at least one orthologue in rice or in Arabidopsis that encodes a putative 302
transporter (Table 3). In the SAL, transcripts of genes encoding MATE (Multi-antimicrobial 303
extrusion protein), which have been implicated in a diverse array of functions (for review see 304
Upadhyay et al., 2019) and ABC (ATP-binding cassette) transporters were found to be the 305
most strongly enriched, whereas in the EAS, genes encoding transporters from the 306
MtN21/UMAMIT (Usually Multiple Acids Move In And Out Transporter), MtN3/SWEET 307
(Sugars Will Eventually be Exported Transporter), and ABC transporter-families were the 308
most represented. When looking at the putative molecules transported, a large number of 309
genes encoding putative amino acid transporters were found to show stronger expression in 310
the EAS than End samples, although genes encoding transporters for various other 311
molecules including sugars, heavy metals, phosphate, inorganic ions or nucleotides also 312
showed stronger expression (Table 3). Regarding the comparison of SAL vs End, transporters 313
mainly annotated as involved in amino acid and inorganic ions transport were identified 314
(Table 3). In summary, our work shows that both SAL and EAS cells strongly express putative 315
13 transporter-encoding genes, suggesting that these cells are characterised by an elevated 316
transmembrane transport of various molecules, and potentially mediate nutrient 317
repartitioning around the embryo. However, each tissue preferentially expresses different 318
classes of transporters, with MtN21/UMAMIT and MtN3/SWEET transporters involved in 319
amino acid and or sugar transport respectively, more likely to be enriched in the EAS. 320
321
The EAS is restricted to one to three endosperm cell layers adjacent to the
322
scutellum.
323
The SAL has both cellular and biochemical characteristics of the aleurone making it 324
inherently different from other endosperm tissues (Gontarek and Becraft, 2017; Zheng and 325
Wang, 2014). In contrast, EAS cells have not been reported to have distinct features that 326
allow them to be distinguished cytologically from SE cells, which compose the majority of 327
the volume of the endosperm (Van Lammeren, 1987). However, our transcriptomic analysis 328
suggests that these cells deploy a specific genetic program. In order to (1) confirm EAS 329
expression specificity and to (2) provide a more precise spatial resolution to define and 330
characterize this new region, in situ hybridizations were performed with a set of 6 genes 331
more than 10 fold enriched in the EAS transcriptome compared to the End transcriptome 332
(Supplemental Table 3, and Supplemental Figure 4 for two examples of eFP browser 333
pattern). Three of these genes encode putative transporters, namely SWEET14a 334
(Zm00001d007365) and SWEET15a (Zm00001d050577) encoding putative sugar transporters 335
of the SWEET family, and Zm00001d009063, called UMAMIT_EAS1, encoding a putative 336
amino acid transporter belonging to the UMAMIT family (Müller et al., 2015; Sosso et al., 337
2015). The three remaining genes were phosphatidylethanolamine-binding protein 11 338
(pebp11, Zm00001d037439), a serine carboxypeptidase-like (Zm00001d014983 or SCL_EAS1) 339
and Zm00001d017285, a gene with no name and unknown function (Supplemental Table 3). 340
The negative control chosen for in situ hybridizations, was an antisense probe generated 341
against a GFP-encoding ORF. The positive control was ZmNAC124 (Zm00001d046126), which 342
is specifically expressed in the Emb compartment in our transcriptome (Figure 2D and 343
Supplemental Table 3) and which had previously been shown by in situ hybridization to be 344
expressed in specific embryonic tissues (Zimmermann and Werr, 2005). In situ hybridizations 345
were performed on 13 DAP kernels, the same stage as used for the transcriptome analysis. 346
14 The 4 probes detecting SWEET15a (Figure 3G, H), PEPB11 (Figure 3K, L), Zm00001d017285 347
(Figure 3M, N) and SCL_EAS1 (Figure 3O, P) gave a strong signal restricted to a few layers of 348
endosperm cells immediately adjacent to the scutellum, with little or no expression detected 349
elsewhere in the kernel. For the probe directed against SWEET14a the signal was strong in 350
the EAS, but was also present, albeit more weakly, in other kernel tissues, especially in the 351
embryo and aleurone (Figure 3E, F). The probe against UMAMIT_EAS1 gave a weaker signal 352
restricted to the apical part of the EAS region, consistent with the lower expression levels of 353
this gene in our transcriptome data (Supplemental Table 3). However, the signal for 354
UMAMIT_EAS1 was specific to these EAS cells (Figure 3I, J). These results confirmed that EAS
15 cells have a specific transcriptional program and that this programme (and thus the EAS) is 356
restricted to 1 to 3 layers of endosperm cells adjacent to the scutellum as confirmed by 357
sagittal sections (Figure 5A, B). 358
The EAS is a dynamic region reflecting the period of strong embryo growth.
359
To evaluate the dynamics of gene expression in the EAS during kernel development, 360
in situ hybridizations were carried out on kernels at different developmental stages (9, 11,
361
14, 17 and 20 DAP) (Figure 4 and Supplemental Figure 5). The four probes giving a strong and 362
EAS-specific signal at 13 DAP (SWEET15a, PEPB11, Zm00001d017285, SCL_EAS1) were used 363
(Figure 4). In 9 DAP kernels, the probes for PEPB11 and SCL_EAS1 showed no signal, whereas 364
those for SWEET15a and Zm00001d017285 gave a strong signal in the endosperm cells 365
adjacent to the apical part of the embryo (Figure 4 and Supplemental Figure 5). This signal 366
was restricted to a few layers of cells in the vicinity of the nascent scutellum. At this stage, 367
the basal part of the embryo was still surrounded by ESR cells and no signal was detected in 368
this region. At 11 DAP, all four probes tested gave a very strong signal in the layers of 369
endosperm cells adjacent to the scutellum. At 14 DAP and 17 DAP, the signal was still 370
detected and restricted to the cell layers in close contact with the embryo (Figure 4 and 371
Supplemental Figure 5). Finally, at 20 DAP the signal decreased for all four probes with a 372
total disappearance for SWEET15a. Together, these results revealed that the EAS 373
transcriptomic region was restricted to a defined time window. Its onset at 9 DAP was 374
concomitant with the formation of the scutellum, marking a switch in embryo/endosperm 375
interactions from an ESR/embryo to an EAS/scutellum interface. Its decline occurred around 376
20 DAP when rapid embryo growth comes to an end. 377
EAS cells originate from the starchy endosperm (SE) and undergo cell death.
378
Despite the preferential or specific expression of EAS marker genes, and consistent 379
with their SE-like morphology, EAS cells also showed some transcriptomic characteristics of 380
the SE such as a strong expression of genes encoding ZEIN storage proteins (Supplemental 381
Figure 6). The presence of ZEIN transcripts in the EAS region is supported by in situ 382
hybridization data (Woo et al., 2001). In order to perform a more global comparison, we 383
asked to which samples from the Zhan et al (2015) dataset (at 8 DAP) our EAS transcriptome 384
was most similar, using PCA (Supplemental Figure 3). Interestingly, on the third principal 385
16 component (PC3), EAS at 13 DAP was most similar to two specific starchy endosperm sub-386
17 regions at 8 DAP: the central starchy endosperm (CSE) and the conducting zone (CZ) 387
(Supplemental Figure 3B). As EAS cells, both CZ and CSE have no striking morphological 388
characteristics differentiating them from the starchy endosperm, strengthening the idea that 389
EAS originate from the starchy endosperm. 390
To address the question of EAS cell fate in proximity to the scutellum, sagittal 391
sections of the EAS/scutellum interface were both hybridized with an EAS-specific probe 392
(against SWEET15a transcripts) and stained with calcofluor to reveal cell walls (Figure 5A-B). 393
Accumulation of cell wall material occurred at the endosperm interface with the scutellum, 394
which may result from the compaction of crushed endosperm cells. Interestingly, in situ 395
hybridization signal for the EAS marker genes was found in the first uncrushed cell layer 396
(Figure 5B). An appealing model is that EAS cells are actually SE cells that are forced into 397
juxtaposition with the scutellum because of the invasive growth of the embryo into the SE 398
during kernel development (Figure 6), suggesting that the EAS program may not be fixed 399
within a static group of cells but instead be triggered as SE cells enter into contact with the 400
scutellum. 401
If this model is correct, EAS cells would be likely to be successively eliminated as they 402
come into contact with the embryo. Terminal deoxynucleotidyl transferase dUTP Nick End 403
Labelling (TUNEL) assays were performed on 15 DAP kernels to visualize DNA degradation as 404
a potential indicator of the presence of dying cells. However, it should be noted that TUNEL 405
signals are neither a fully reliable indicator of all forms of cell death, nor diagnostic of 406
specific cell death programmes (Charriaut-Marlangue and Ben-Ari, 1995; Labat-Moleur et al., 407
1998). In addition to the PC and coleoptile regions, both of which had previously been shown 408
to give strong TUNEL signals (Giuliani et al., 2002; Kladnik et al., 2004), we also observed a 409
clear TUNEL positive signal in some EAS cells in close contact with the scutellum (Figure 5C, 410
D). This result is consistent with the possibility that a form of cell death occurs at this 411
interface. To clarify whether transcriptional activation of EAS specific genes is linked to the 412
initiation of known cell death programmes, the expression levels of genes associated with 413
programmed cell death in plants were analysed (Supplemental Figure 7) (Arora et al., 2017; 414
Fagundes et al., 2015). Surprisingly orthologues of none of the previously identified 415
programmed cell-death associated genes was found to be particularly up regulated in the 416
EAS compared to other samples. In addition, no enrichment of GO terms associated with 417
18 programmed cell death was found in the DEGs strongly expressed in the EAS relative to the 418
End samples. Similar results were obtained when comparing genes strongly expressed in the 419
EAS relative to the Emb, which remains alive (the GO term “programmed cell death” 420
(GO:0012501) was slightly enriched (Ratio of 1.56) but in a not statistically significant 421
manner (p-value=0.098)). These data suggested that either only a small proportion of EAS 422
cells undergo cell death, or that crushing of EAS cells does not trigger a “classical” 423
programmed cell death programme. A parallel could be drawn with accidental cell death 424
(ACD) defined in animals, in which cells die as a result of their immediate structural 425
breakdown due to physicochemical, physical or mechanical cues (Galluzzi et al., 2015). 426
Impaired expression of some EAS marker genes in emb mutants.
427
To test to what extent the proximity of the embryo/scutellum was required for EAS 428
gene expression, the embryo specific mutation emb8522 was used in an R-scm2 genetic 429
background enhancing the early embryo deficient phenotype (Sosso et al., 2012). In this 430
19 background the recessive emb8522 mutation produced vestigial embryos composed of a 431
small heap of cells. Nevertheless, a cavity corresponding to the size a normal embryo was 432
generated that was only very partially occupied by the aborting embryo (Heckel et al., 1999; 433
Sosso et al., 2012). Self-fertilization of heterozygous plants carrying the emb8522 mutation 434
was performed, and in situ hybridizations were carried out on 13 DAP sibling kernels with 435
either phenotypically wild-type or mutant embryos, to visualize the transcripts of four EAS 436
marker genes (Figure 7). Similar EAS specific expression patterns were observed in R-scm2 437
kernels with embryos (Figure 7) to those observed in B73 kernels (Figure 3 and 4) for all 438
genes tested, indicating a conservation of EAS cell identity in this genetic background. In emb 439
kernels, the probes detecting Zm00001d017285 and SWEET15a still showed a signal in the 440
EAS region but with an altered distribution (Figure 7). In emb kernels, Zm00001d017285 441
expression was found to be restricted to the apical part of the embryo cavity and SWEET15a 442
expression expanded to the SAL, suggesting an inhibitory role of the normal embryo on 443
SWEET15a expression in this tissue. Interestingly the two other EAS marker genes tested
444
showed either only very weak expression (SCL_EAS1) or no expression (PEPB11) in emb 445
20 kernels, indicating a promoting effect of the normal embryo on the expression of these two 446
genes (Figure 7). 447
448 449
21
Discussion
450
Transcriptomes at embryo/endosperm interfaces
451
As in other flowering plants, seed development in maize is governed by specific 452
temporal and spatial genetic programs, distinguishing early development, filling and 453
maturation on one hand and embryo, endosperm and pericarp on the other (Chen et al., 454
2014; Downs et al., 2013; Li et al., 2014; Lu et al., 2013; Meng et al., 2018; Qu et al., 2016). 455
Recently a transcriptome analysis on nucellus (including the fertilized embryo sac) increased 456
the temporal resolution and allowed unprecedented access to information regarding the 457
genetic control of early seed developmental (Yi et al., 2019). The most detailed spatial 458
analysis to date used Laser-Capture Microdissection (LCM) on 8 DAP kernels (Zhan et al., 459
2015) to reveal the expression of specific populations of genes in the maternal tissues, the 460
embryo and the main endosperm cell types namely ESR, BETL, AL and SE (which was 461
subdivided in CSE and CZ). Although providing an extremely valuable resource, these studies 462
did not address the question of whether specific transcriptional domains exist at the 463
embryo-endosperm interface. 464
Both the endosperm and embryo are complex compartments with several 465
morphologically and functionally distinct domains (Olsen, 2004b; Sabelli and Larkins, 2009). 466
Because they undergo complex and coordinated developmental programmes, the interfaces 467
between the embryo and the endosperm represent important, and constantly changing 468
zones of exchange, both in term of nutrition and communication (Ingram and Gutierrez-469
Marcos, 2015; Nowack et al., 2010; Widiez et al., 2017). In order to understand these 470
interactions two subdomains of the endosperm and one subdomain of the embryo were 471
hand-dissected: the scutellar aleurone layer (SAL) at the adaxial side of the embryo; the 472
starchy endosperm in close contact with the abaxial side of the embryo (EAS); and the 473
scutellum of the embryo (AS). 13 DAP kernels were chosen for our analysis because at this 474
stage the embryo has emerged from the ESR and is establishing new interactions with 475
endosperm. From a practical point of view, 13 DAP is also the earliest stage allowing reliable 476
hand dissection of the chosen interfaces. 477
Contamination with neighbouring tissues is an important issue in any dissection 478
experiment. For example, in Arabidopsis, an extremely valuable and globally very reliable 479
resource generated by LCM (Belmonte et al., 2013; Le et al., 2010) was recently shown to 480
22 contain some inter-compartment contamination, which caused problems for the 481
investigation of parental contributions to the transcriptomes of early embryos and 482
endosperms (Schon and Nodine, 2017). In our study, precautions were taken to limit inter-483
tissue contamination by (i) washing each sample before RNA extraction (see material and 484
methods) and (ii) generating four biological replicates for each tissue. Marker gene analysis 485
confirmed the conformity of the samples with the exception of a potential minor 486
contamination of pericarp by the AL, suggested by the apparent expression of both the AL9 487
and Zm00001d024120 aleurone marker genes and the endosperm marker genes 488
ZmZOU/O11 and O2 in the pericarp sample (Figure 2E, F). This could have been caused by
489
the tendency of the AL to stick either to the starchy endosperm or to the pericarp. In 490
addition, residual ESR tissues at 13 DAP might have contaminated both our SAL and EAS 491
samples (Figure 2G). 492
493
The EAS, a novel endosperm subdomain likely involved in carbon and
494
nitrogen fluxes from the endosperm to the embryo
495
Transcriptomic profiling of the two endosperm interfaces with the embryo (SAL and 496
EAS) revealed specific transcriptional signatures. While this could have been expected for 497
the cytologically distinct SAL, it was rather unexpected for the cell layers adjacent to the 498
abaxial side of the embryo, which do not present any obvious cytological differences to 499
other SE cells (Van Lammeren, 1987). Based on the observed enrichment of hundreds of 500
transcripts in these cell layers, they represent a novel subdomain of the endosperm which 501
we named “endosperm adjacent to scutellum” (EAS). 502
GO analysis revealed a significant enrichment in the GO category transmembrane 503
transporter activity for both the SAL and EAS, and additionally for lipid transporter activity 504
for SAL (Table 2). A closer look at DEGs for both EAS and SAL shows the presence of different 505
transporter gene families (Table 3). Interestingly, many UMAMITs and SWEETs, thought to 506
transport amino acids/auxin and sugars, respectively, were found enriched in the EAS. 507
UMAMITs and SWEETs are considered to be bi-directional transporters, although they tend 508
to act as exporters when located at the plasma membrane, exporting nutrients down 509
concentration gradients generated by sinks in adjacent tissues (Chen et al., 2012; Müller et 510
al., 2015). Two non-exclusive hypotheses could explain the elevated expression of 511
23 transporter-encoding genes in the EAS: either these cells actively take up nutrients that 512
arrive from the BETL via the SE and then export them into the apoplastic space surrounding 513
the growing embryo, or they are simply involved in recycling nutrients from dying 514
endosperm cells that are crushed by the growing embryo. 515
With regard to nutrient uptake on the embryo side, one might expect the expression 516
of genes encoding nutrient importers at the surface of the scutellum in order to take up 517
apoplastic metabolites. However, in our apical scutellum transcriptome (AS) we were not 518
able to detect differentially expressed importer-encoding genes with respect to the entire 519
embryo (Emb). While this could suggest that the regulation of importer activity does not 520
occur at the transcriptional level, it seems more likely that our transcriptomic comparison AS 521
vs Emb was not well designed for the identification of such genes, since the whole embryo is
522
mainly composed of scutellum tissues. 523
In the future a more detailed comparison of the gene expression profiles of the BETL 524
(import) and the EAS (export) regions could be informative. The BETL is an interface 525
specialized in nutrient transfer from maternal phloem terminals to the endosperm (Chourey 526
and Hueros, 2017). The hexose transporter SWEET4c is preferentially expressed in the BETL, 527
and loss of function of sweet4c results in the production of a shrivelled endosperm, 528
illustrating the critical importance of hexose transport in the BETL for normal endosperm 529
growth (Sosso et al., 2015). Interestingly, sweet4c is also found in the DEGs showing strong 530
expression in the EAS compared to the endosperm as a whole, possibly suggesting 531
commonalities between BETL and EAS function. EAS-specific knock-down of SWEET4C might 532
be one strategy to test this hypothesis and to address the question of possible redundancy 533
with SWEET14a and SWEET15a, also enriched in the EAS. Nonetheless, notable differences 534
exist between the EAS and the BETL. Firstly BETL cells have structural features including 535
dramatic cell wall ingrowths that make them unique in the endosperm (Chourey and Hueros, 536
2017; Leroux et al., 2014). In contrast EAS cells cannot be morphologically differentiated 537
from the SE (Van Lammeren, 1987). Secondly, the BETL represents a static interface, 538
contrary to the EAS which is displaced as the embryo scutellum expands (Figure 6) during the 539
most rapid growth-phase of the embryo (Chen et al., 2014). 540
The EAS is a developmentally dynamic interface
24 The detection of DNA fragmentation, a characteristic of cell death, in EAS cells (Figure 542
5C, D), together with an accumulation of cell wall material in this zone (Figure 5A, B) 543
suggested that endosperm cells are eliminated as the embryo grows. An important question 544
is whether this involves a genetically controlled cell-autonomous death or a more atypical 545
and passive cell death process caused by embryo growth. In the Arabidopsis seed, where 546
most of the endosperm degenerates during seed development, the expression of 547
developmental cell death marker genes such as PLANT ASPARTIC PROTEASE A3 (AtPASPA3) 548
or BIFUNCTIONAL NUCLEASE 1 (AtBFN1) has been detected at the embryo interface 549
(Fourquin et al., 2016; Olvera-Carrillo et al., 2015). In maize, less is known about molecular 550
actors involved in developmental cell death. To the best of our knowledge, cell death marker 551
genes have not been comprehensively identified in maize. Nevertheless a survey of putative 552
cell death marker genes derived from comparisons with other plant systems, showed their 553
expression in EAS cells, but without any significant enrichment compared to other 554
compartments (Supplemental Figure 7 and Supplemental Data Set 2). Although cell death in 555
the EAS could be triggered by the activation of unknown cell death-associated genes, a more 556
likely explanation for our observations could be a dilution of the transcriptional signal in the 557
EAS transcriptome, making it undetectable. This is supported by TUNEL staining, which 558
revealed a very localised signal limited to a few cells at the immediate interface with the 559
embryo (Figure 5C, D). In addition, previous cell death staining with Evans blue, did not 560
reveal any massive cell death in the EAS, further supporting the hypothesis of very localized 561
cell death events (Young and Gallie, 2000). 562
The precise spatial organisation of cell death and transporter expression remains 563
unclear but the expression of transporters might allow the recycling of nutrients from the 564
cells before they die. As these cells are SE in origin, they could already have initiated nutrient 565
storage at 13 DAP, as illustrated by substantial expression of ZEIN genes (Supplemental 566
Figure 6). Nutrient recycling could be an advantageous way for the plant to efficiently reuse 567
stored nutrients. Interestingly, in Arabidopsis the STP13 sugar transporter is upregulated in 568
several cell death contexts and the expression of many transporters increase during organ 569
senescence suggesting a function in nutrient recycling from dying cells (Graaff et al., 2006; 570
Norholm et al., 2006; Zhang et al., 2014). However, the precise role of transporters in 571
nutrient recycling remains poorly understood in plants. 572
25
The importance of the embryo for the expression of EAS marker genes
573
Since the EAS is a mobile interface, forming adjacent to the expanding scutellum, we 574
asked whether the presence/absence of the embryo influences the activation of EAS marker 575
genes (Figure 7). In emb8522 mutant kernels which produce a seemingly empty, but 576
normally sized embryo cavity containing an aborted embryo (Heckel et al., 1999; Sosso et al., 577
2012) the expression of different EAS marker genes was affected in different ways. The 578
SWEET15A gene was still expressed in EAS cells, but also became strongly expressed at the
579
opposite embryo/endosperm interface (SAL). Based on the precedent of the SWEET4c 580
transporter, which gene is induced by sugar (Sosso et al., 2015), it is possible that a similar 581
induction could occur in the case of SWEET15a. The absence of a normal embryo could lead 582
to a build-up of sucrose in the embryo cavity of emb8522 mutants leading to such an 583
induction. In contrast, the expression domain of the Zm00001d017285 marker gene is 584
reduced in emb8522 mutants, with expression becoming restricted to the apical part of the 585
EAS. Finally, the expression of PEPB11 and SCL_EAS1 is dramatically reduced in emb8522 586
mutants compared to phenotypically wild-type kernels. Our results suggest that EAS-specific 587
gene expression could be a result of several independent factors, some of which could 588
originate from the endosperm, and others from the embryo. The mechanisms involved in 589
embryo cavity formation remain elusive, although a recent study showed that the SHOHAI1 590
protein is required in the endosperm for the formation of the embryo cavity (Mimura et al., 591
2018). 592
Interestingly, the expression of both PEPB11 and SCL_EAS1 initiates relatively late in 593
the EAS, whereas the expression of SWEET15a and Zm00001d017285 initiates before 9 DAP. 594
This suggests the presence of at least two transcriptional programs in the EAS: one initiating 595
early and weakly influenced by the embryo and a second activated later, and more strongly 596
embryo-dependent. The generation of comparable transcriptomes at earlier developmental 597
stages could help us identify the key signals activating gene expression in the EAS, and 598
potentially pinpoint transcription factors regulating gene expression in this tissue. In parallel, 599
phenotypic analysis of loss-of-function mutants of genes enriched in the EAS is needed to 600
further elucidate the biological role of this novel endosperm subdomain. 601
26
Material and Methods
603
Plant material, plant growth conditions
604
A188 and B73 inbred lines were cultivated in the green house as described previously 605
(Rousseau et al., 2015). A188 inbred line depicted in supplemental figure 1 was cultivated in 606
a growth chamber as described previously (Doll et al., 2019). The emb8522 mutant in the R-607
scm-2 background (Sosso et al., 2012) and the B73 plants used for in situ hybridization were 608
grown in a field plot located at the ENS de Lyon, France. 609
Isolation of maize kernel compartments
610
Kernel (sub)compartments of the B73 inbred line were hand dissected and quickly 611
washed with HyClone Dulbecco's phosphate-buffered saline solution (ref. SH30378.02), 612
before freezing them in liquid nitrogen. For each (sub)compartment, four independent 613
biological replicates were produced (Supplemental Table 1). For each biological replicate, the 614
material comes from two independent, 13 day-old maize ears, i. e. a total of 8 different ears 615
was used for each (sub)compartment. Within each biological replicate, tissues from 4 to 84 616
kernels were pooled depending on the size of the considered (sub)compartment 617
(Supplemental Table 1). 618
RNA extraction and RNA-seq
619
Total RNAs were extracted with TRIzol reagent, treated with DNase using the Qiagen 620
“RNase-Free DNase Set”, and purified using Qiagen RNeasy columns according to the 621
supplier's instructions. RNA-seq libraries were constructed according to the 622
“TruSeq_RNA_SamplePrep_v2_Guide_15026495_C” protocol (Illumina®, California, USA). 623
Sequencing was carried out with an Illumina Hiseq2000 at the IG-CNS (Institut de 624
Génomique- Centre National de Séquençage). The RNA-seq samples were sequenced in 625
paired-end (PE) mode with a sizing of 260 bp and a read length of 2×100 bases. Six samples 626
were pooled on each lane of a HiSeq2000 (Illumina), tagged with individual bar-coded 627
adapters, giving approximately 62 millions of pairs per sample. All steps of the experiment, 628
from growth conditions to bioinformatics analyses, were managed in the CATdb database 629
(Gagnot et al., 2008, http://tools.ips2.u-psud.fr/CATdb/) with project ID 630
“NGS2014_21_SeedCom” according to the MINSEQE (minimum information about a high-631
throughput sequencing experiment) standard (http://fged.org/projects/minseqe/). 632
RNA-seq read processing and gene expression analysis
633
RNA-seq reads from all samples were processed using the same pipeline from
634
trimming to counts of transcripts abundance as follows. Read quality control was performed
635
using the FastQC (S. Andrew, http://www.bioinformatics.babraham.ac.uk/projects/fastqc/).
636
The raw data (fastq files) were trimmed using FASTX Toolkit version 0.0.13
637
(http://hannonlab.cshl.edu/fastx_toolkit/) for Phred Quality Score > 20, read length > 30
27
bases, and ribosomal sequences were removed with the sortMeRNA tool (Kopylova et al.,
639
2012).
640
The genomic mapper TopHat2 (Langmead and Salzberg, 2012) was used to align read
641
pairs against the Zea mays B73 genome sequence (AGP v4, (Jiao et al., 2017)), using the gene
642
annotation version 4.32 provided as a GFF file (Wang et al., 2016). The abundance of each
643
isoform was calculated with the tool HTSeq-count (Anders et al., 2015) that counts only
644
paired-end reads for which paired-end reads map unambiguously one gene, thus removing
645
multi-hits (default option union). The genome sequence and annotation file used was
646
retrieved from the Gramene database (http://www.gramene.org/ release 51, in September
647
2016 (Gupta et al., 2016)).
648
Choices for the differential analysis were made based on Rigaill et al., 2018. To
649
increase the detection power by limiting the number of statistical tests (Bourgon et al.,
650
2010) we performed an independent filtering by discarding genes which did not have at least
651
1 read after a count per million analysis (CPM) in at least one half of the samples. Library size
652
was normalized using the method trimmed mean of M-values (TMM) and count distribution
653
was modelled with a negative binomial generalized linear. Dispersion was estimated by the
654
edgeR package (version 1.12.0, McCarthy et al., 2012) in the statistical software ‘R’ (version
655
2.15.0, R Development Core Team, 2005). Pairwise expression differences were performed
656
using likelihood ratio test and p-values were adjusted using the Benjamini-Hochberg
657
(Benjamini and Hochberg, 1995) procedure to control FDR. A gene was declared to have a
658
differential expression if its adjusted p-value was lower than 0.05. The FPKM value
659
(Fragments Per Kilobase of transcript per Million mapped reads) is used to estimate and
660
compare gene expressions in eFP Browser. This normalization is based on the number of
661
paired-end reads that mapped each gene taking into account the gene length and the library
662
size. This RNA-seq read processing method was used for all analyses presented in this
663
manuscript, except for the comparison of our RNA-seq with published RNA-seq, for which
664
the data were processed as described below.
665
Comparison of our RNA-seq data-set with published RNA-seq data-set.
666
For the comparison of our dataset with previously published RNA-seq data (Zhan et
667
al., 2015), the raw RNA-seq reads published by Zhan et al. (2015) were retrieved from NCBI
668
SRA (Leinonen et al., 2011) from Bioproject PRJNA265095 (runs SRR1633457 to
669
SRR1633478). That represents 53 millions of pairs of length 2×100 bases, for 22 samples. The
670
reads from the two datasets were processed using the same pipeline: quality control was
671
performed using FastQC version 0.11.7 (S. Andrew,
672
http://www.bioinformatics.babraham.ac.uk/projects/fastqc/). Sequencing adapters were
673
clipped using cutadapt v1.16 (Martin, 2011) sequencer artefacts were removed using FASTX
674
Toolkit version 0.0.14 (http://hannonlab.cshl.edu/fastx_toolkit/), and custom Perl scripts
675
were applied to trim regions of reads having an average Phred quality score (Ewing and
676
Green, 1998) lower than 28 bases over a sliding window of 4 bases. We noticed some
677
samples retrieved from SRA exhibited a high ribosomal RNA content. We built a maize rRNA
28
database by comparing sequences from Silva (Quast et al., 2013) and RFAM (Kalvari et al.,
679
2018) to the Zea mays B73 genome sequence ; we then used this custom database to filter
680
the RNA-seq reads with sortMeRNA version 2.1b (Kopylova et al., 2012). Reads shorter than
681
25 bases at the end of this processing, or with no mate, were discarded.
682
The genomic mapper HISAT2 v2.2.0 (Kim et al., 2015) was used to align read pairs 683
against the Zea mays B73 genome sequence (AGP v4; Jiao et al., 2017), using the gene
684
annotation version 4.40 provided as a GFF file (Wang et al., 2016); a first mapping pass was
685
performed with the complete set of read pairs to discover unannotated splicing sites, before
686
the per-sample mapping, with options “-k 10 --no-discordant –no-softclip” and allowing
687
introns of length 40 to 150,000 bp. Mapped reads were counted by gene (not distinguishing
688
isoforms) using FeatureCounts (Liao et al., 2014). The genome sequence and annotation file
689
used was retrieved from the Gramene database (http://www.gramene.org/, release 51, in
690
September 2016; Gupta et al., 2016).
691
Normalization, differential analysis and PCAs were performed with DESeq2 (Love et
692
al., 2014) under R version 3.6.2 (R Development Core Team, 2005). The PCAs were done
693
using the 1000 genes with the highest variance, after applying the variance stabilisation
694
transformation (VST) described by Anders and Huber, 2010 and implemented in DESeq2
695
v1.24.0. In parallel, FPKM values (Fragments Per Kilobase of transcript per Million mapped
696
reads) and confidence intervals were estimated using Cufflinks version 2.2.1 (Roberts et al.,
697
2011) with options “--frag-bias-correct --multi-read-correct --max-multiread-fraction 1”.
698 699
Venn diagrams.
700For each compartment/sub-compartment, the mean of expression of the 4 samples
701
was calculated. If the value of the normalized read counts was equal or superior to 1, the
702
gene was considered as expressed. Venn diagrams were drawn using tools available at:
703
http://bioinformatics.psb.ugent.be/webtools/Venn/.
704 705
Functional annotation of Zea mays transcriptome, GO term enrichment
706
analysis
707
The Zea mays B73 genome sequence v4 (Jiao et al., 2017) and the gene annotation
708
v4.40 were used to predict transcript sequences using the gffread script from the Cufflinks
709
package v2.2.1 (Trapnell et al., 2013). In each isoform sequence, the putative ORFs were
710
identified using TransDecoder ((Haas et al., 2013)
711
https://github.com/TransDecoder/TransDecoder/wiki), and the amino acid sequence was
712
predicted. From 46 272 genes, 138 270 transcripts were predicted, leading to 149 699 amino
713
acid sequences.