HAL Id: insu-02136335
https://hal-insu.archives-ouvertes.fr/insu-02136335
Submitted on 22 May 2019HAL is a multi-disciplinary open access archive for the deposit and dissemination of sci-entific research documents, whether they are pub-lished or not. The documents may come from teaching and research institutions in France or abroad, or from public or private research centers.
L’archive ouverte pluridisciplinaire HAL, est destinée au dépôt et à la diffusion de documents scientifiques de niveau recherche, publiés ou non, émanant des établissements d’enseignement et de recherche français ou étrangers, des laboratoires publics ou privés.
Dynamics of foam flow in a rock fracture: Effects of
aperture variation on apparent shear viscosity and
bubble morphology
Mohammad Javad Shojaei, Antonio Rodriguez de Castro, Yves Méheust,
Nima Shokri
To cite this version:
Mohammad Javad Shojaei, Antonio Rodriguez de Castro, Yves Méheust, Nima Shokri. Dynam-ics of foam flow in a rock fracture: Effects of aperture variation on apparent shear viscosity and bubble morphology. Journal of Colloid and Interface Science, Elsevier, 2019, 552, pp.464-475. �10.1016/j.jcis.2019.05.068�. �insu-02136335�
Accepted Manuscript
Dynamics of foam flow in a rock fracture: Effects of aperture variation on ap-parent shear viscosity and bubble morphology
Mohammad Javad Shojaei, Antonio Rodríguez de Castro, Yves Méheust, Nima Shokri
PII: S0021-9797(19)30624-1
DOI: https://doi.org/10.1016/j.jcis.2019.05.068
Reference: YJCIS 24997
To appear in: Journal of Colloid and Interface Science
Received Date: 26 February 2019 Revised Date: 19 May 2019 Accepted Date: 20 May 2019
Please cite this article as: M. Javad Shojaei, A. Rodríguez de Castro, Y. Méheust, N. Shokri, Dynamics of foam flow in a rock fracture: Effects of aperture variation on apparent shear viscosity and bubble morphology, Journal
of Colloid and Interface Science (2019), doi: https://doi.org/10.1016/j.jcis.2019.05.068
This is a PDF file of an unedited manuscript that has been accepted for publication. As a service to our customers we are providing this early version of the manuscript. The manuscript will undergo copyediting, typesetting, and review of the resulting proof before it is published in its final form. Please note that during the production process errors may be discovered which could affect the content, and all legal disclaimers that apply to the journal pertain.
Dynamics of foam flow in a rock fracture: Effects of aperture variation on apparent shear viscosity and bubble morphology
Mohammad Javad Shojaei1, Antonio Rodríguez de Castro2,3, Yves Méheust4, Nima Shokri1 1The School of Chemical Engineering and Analytical Science, The University of Manchester, Manchester UK.
2Arts et Métiers ParisTech, 51006 Châlons-en-Champagne, France
3Laboratoire MSMP – EA7350, Rue Saint Dominique, 51006 Châlons-en-Champagne, France
4Univ. Rennes, CNRS, Géosciences Rennes, UMR 6118, 35000 Rennes, France
*Corresponding Author Dr. Nima Shokri
School of Chemical Engineering and Analytical Science Room C26, The Mill
The University of Manchester
Sackville Street, Manchester, M13 9PL, UK Tel: 0441613063980
Email: [email protected]
Abstract
There has recently been renewed interest in understanding the physics of foam flow in permeable media. As for Newtonian flows in fractures, the heterogeneity of local apertures in natural fractures is expected to strongly impact the spatial distribution of foam flow. Although several experimental studies have been previously performed to study foam flow in fractured media, none of them has specifically addressed that impact for parallel flow in a realistic fracture geometry and its consequences for the foam’s in situ shear viscosity and bubble morphologies. To do so, a comprehensive series of single-phase experiments have been performed by injecting pre-generated foams with six different qualities at a constant flow rate through a replica of a Vosges sandstone fracture of well-characterized aperture map. These measurements were compared to measurements obtained in a Hele-Shaw (i.e., smooth) fracture of identical hydraulic aperture. The results show that fracture wall roughness strongly increases the foam’s apparent viscosity and shear rate. Moreover, foam bubbles traveling in regions of larger aperture exhibit larger velocity, size, a higher coarsening rate, and are subjected to a higher shear rate. This study also presents the first in situ measurement of foam bubbles velocities in fracture geometry, and provides hints towards measuring the in situ rheology of foam in a rough fracture from the velocity maps, for various imposed mean flow rates. These findings echo the necessity of considering fracture wall when predicting the pressure drop through the fracture and the effective viscosity, as well as in situ rheology, of the foam.
Keywords: Fractured media, Foam flow, Aperture heterogeneity, Shear rheology, Bubble
1. Introduction
Fracture media are present in a wide range of geological media used for industrial applications including CO2 sequestration, subsurface/soil remediation, and Enhanced Oil Recovery (EOR) [1-5]. In these applications, when injecting a displacing fluid in a reservoir containing fractures, channeling and preferential flow paths occur, which leads to low sweep efficiency [6-8]. The use of foams, which consist of gas bubbles separated by thin liquid films denoted as lamellae [9-11], has proven to be a potential solution to overcome these issues [12-15]. In particular, a high viscous pressure drop is produced through the foam-saturated fracture, diverting the flow to less permeable regions and thus improving oil recovery [16-19].
Foams are generated by three main mechanisms: snap-off, lamellae division, and leave-behind [20, 21], and can exist in either bulk or confined form [22]. “Bulk foams” are foams with individual bubbles which are considerably smaller than the characteristic length scale of the porous medium [23]. This type of foams can be classified into ball (or wet) foam and polyhedral (or dry) foam, depending on the foam bubble shape [24]. Polyhedral foam bubbles are more common at high gas volume fractions, while spherical foam bubbles form at low gas volume fraction [24, 25]. On the other hand, confined foams are produced when the characteristic length scale of individual bubbles is of the same order of magnitude or greater than, the characteristic length scale of the porous medium [26].
Predicting and controlling foam coalescence is a key factor for successful foam flooding projects. Chambers and Radke [27] proposed two main mechanisms of foam coalescence. The first one is capillary-suction, which results from the Lamellae’s expansion and contraction to conserve mass as they go out through constrictions in the porous medium. The lamellae thin and thicken in a sequence of squeezing-stretching and draining-filling events.
This oscillation of the lamella thickness has a wider oscillation range at higher gas flow rate and larger pore-body to pore-throat aspect ratio [28], and can lead to lamella rupture. In this respect, Jimenez and Radke [28] stated that the capillary suction pressure increases with pore-body to pore-throat aspect ratio. The other mechanism stems from Ostwald ripening and occurs due to differences in gas pressure between neighboring bubbles of different sizes, due to Laplace law, which stipulates that the pressure drop across the interface is all the larger as the curvature ratio of the interface is smaller. That pressure difference results in gas diffusion from the smaller to the larger bubbles, and progressive vanishing of the smaller bubbles. According to Von Neumann’s law [29], the rate of change in bubble surface area depends on the number of neighbor bubbles, the surface tension of the liquid and the permeability of the porous medium. It is worth mentioning that whereas foam coarsening was extensively investigated in bulk systems, there is less evidence of this phenomenon in confined geometry [30], probably because the involved diffusive time scales are larger than the characteristic time of most laboratory experiments.
Foams can serve as efficient displacing fluids in porous media due to their specific rheological properties. A concept frequently used to characterize the rheology of foams is their apparent (or effective) viscosity, 𝜇app(Pa.s). Knowing the foam’s apparent injection velocity (or specific discharge) q (m/s), defined as the ratio of the total volumetric flow rate of the foam to the cross-sectional area of the fracture 𝑆 = 𝑤 × ℎm, with w being the width of the fracture and ℎm(m) its mechanic (that is, arithmetic mean) aperture, the pressure drop ∆𝑃
through the fracture of length L (m), and the permeability K (m2) of fracture, the (𝑃𝑎)
apparent viscosity is the viscosity that must be used in order to be able to write a Darcy’s law for the foam flow [29]:
(1) 𝜇 =𝐾∆𝑃=ℎ
In the preceding equation, ℎ = (12𝐾)1/2 (m) is the constant aperture of a smooth fracture (parallel plate) generating the same pressure drop as the considered real fracture when a Newtonian fluid is injected at the same flow rate.
It is important to note that 𝜇app is not an intrinsic property of the foam: its value is usually observed to decrease as q increases, which indicates a shear-thinning behaviour of the foam. Indeed, the foam bubbles tend to agglomerate at low flow rates, which impedes their relative movement, but are aligned and deformed in the direction of flow when the flow rate increases, resulting in a decrease in viscosity. Note however that the in-situ rheology of a foam in a porous medium whose characteristic pore size is on the same order as the typical foam bubble size, is not necessarily the same as that of the bulk flow of the same foam, since in the former case most friction occurs between the liquid films and the solid walls, while in the latter case viscous dissipation occurs mostly within liquid films between bubbles. In this regard, Hirasaki and Lawson [10] showed that the apparent viscosity of a foam is the sum of three contributions: (1) the flow resistance of slugs of liquid between gas bubbles (which results from viscous friction at the solid walls), (2) the flow resistance due to surface tension gradient between the front and rear of foam bubbles (3) and the resistance to deformation of foam bubbles as they pass through the pores. They considered both bulk foam flows and the flow of foam in porous media. They also showed that foam texture (i.e. the number of bubbles per unit area) is a key parameter controlling 𝜇app. Some studies showed that foam behaves as a yield stress fluid [31-33]. After the stress passes a threshold, foam bubbles rearrange and flow like a viscous non-Newtonian fluid. Princen [34] and Hohler and Cohen-Addad [35] showed that the yield stress is inversely proportional to the bubble size in bulk and bubble scale.
The effects of aperture variations on the creeping (that is, laminar with 𝑅𝑒 ≪ 1) flow through a rough fracture, in particular its departure from the ideal model of the flow through two perfectly smooth parallel palates [36], have been addressed extensively in the literature of the last 35 years [36-38]. Spatial variations of aperture result in flow channelling, which is all the larger as the fracture is more closed and as the correlation length between the facing fracture walls is larger [39]. Flow channelling usually coincides with a deviation of the hydraulic conductivity of the fracture from that of the parallel plate of identical mechanical (mean) aperture. Surprisingly, this effect has up to now been largely ignored in most studies dealing with foam flow in rock fractures, with a few striking exceptions, which we present below. Indeed, relatively few studies on foam flows in fractured media are reported in the literature, and several of them neglect fracture wall roughness, considering Hele-Shaw cell fractures which consist of the space between two parallel plane walls. For example, Yan et al. [40] studied the flow of an aqueous foam in a Hele-Shaw cell fracture at ambient conditions and showed how the gas fraction, mean bubbles size and ratio between the latter and the fracture aperture control foam displacement efficiency. They also showed experimentally, and evidenced theoretically, a diversion mechanism in which the foam tends to flow in thinner fractures rather than thicker fractures within a fractured medium. Osei-Bonsu et al. [41] also used a Hele-Shaw cell set-up analogous to a smooth fracture and investigated the link between foam quality, mean bubble size, mean flow behavior and the foam’s apparent viscosity; they also measured the recovery factor of a silicone oil. The experimental and theoretical study by Jones et al. [42] provides detailed insight into how pressure drops develop in such smooth channels when the foam can be considered two-dimensional (a feature observed by Kovscek et al. in natural fractures [26], see below) due to friction at the Plateau border between the lamella separating bubbles and wall films The effect of surface
further in addressing geometrical complexity, by considering both a constant aperture (Hele-Shaw) fracture, a checkerboard-like fracture with two different apertures of 20 and 40 micrometers, and a fracture possessing a three-level synthetic roughness, to study the effect of aperture variations on foam flow. They found that the geometry of the fracture can greatly impact foam generation mechanisms and foam texture. They visualize and analyzed quantitatively the size distribution of bubbles in situ, but did not measure their velocities. To our knowledge the first study to address foam flows in a realistic fracture geometry is that by Kovscek et al. [26], who studied the radial flow of an aqueous foam through a transparent replica of a natural rough-walled fracture at ambient conditions, and measured the pressure drop for various global flow rates and foam qualities [26]. They could characterize qualitatively the morphology of the bubbles in the fracture plane and in planes perpendicular to the fracture plane, evidencing the two-dimensionality of the foam under these conditions. But they did not obtain a quantitative characterization of the flow from the visualization of the bubbles. Very recently, AlQuaimi and Rosen [45] performed very detailed flow experiments at ambient conditions in synthetic fractures made of roughened glass plates to study foam generation mechanisms and propagation and found that fracture-wall roughness geometry played a major role in controlling the mechanisms of foam generation as well as the foam’s mobility. Note however that the geometries which they consider (roughened plates) does not correspond to the known geometry of fractures, i.e., geometries obtained from the fracturing of solid materials (rocks, metals, ceramics); in particular, AlQuaimi and Rossen’s geometries exhibit different spatial correlation properties than those of walls resulting from a fracturing process, and are much more akin to two-dimensional porous media than the latter. Other studies have addressed fractured media at a scale larger than the scale of a single fracture. Haugen et al. [46] studied foam flow in a carbonate rock cores cut along a plane containing their axis with a saw, at ambient conditions, and found that using pre-generated
foam greatly enhanced oil recovery by diverting the injected fluid from fracture to matrix. Fernø et al. [47] performed foam flow experiments at ambient conditions in fracture networks consisting of fractured marble tiles. They measured the global rheology of the foam and performed a qualitative analysis of bubble geometries some of the fracture. They also found that foam improved sweep efficiency significantly and delayed gas breakthrough. Using a synthetic porous two-dimensional micromodel containing a parallel plate fracture in its middle, Telmadarreie and Trivedi [48] examined the pore-scale phenomenology of heavy oil displacement by foam in fractured carbonate reservoirs at ambient conditions. Their mostly qualitative analysis revealed that foam not only acts as a mobility enhancement agent but also significantly increase heavy oil recovery from the oil-wet matrix. Gauteplass et al. [49] studied the mechanisms of foam generation in a porous microfluidic micromodel mimicking a sandstone geometry and characterized the role of snap off, evidence that it also occurs at the boundaries between fractures and the porous matrix.
In all the preceding studies addressing foam flow at the fracture scale, the only one to consider a realistic fracture geometry is the seminal paper by Kovscek et al. [26], but it addresses a radial flow (i.e., a point injection) for which the velocity decreases as the inverse of the distance to the injection point. The prime objective of the present research was to provide insight into the role of aperture spatial variations on the shear rheology of the foam, the foam bubbles size, and foam coarsening in a realistic fracture geometry under parallel flow conditions, with the additional knowledge of the bubble velocity field (following recent studies of foam flows in two-dimensional porous media [50, 51]), which has been measured in none of the earlier studies on foam flows in fractures. To do so, single-phase foam flow experiments were carried out using a replica of a Vosges sandstone fracture with well-characterized aperture map at several flow rates and different foam qualities. The results were
compared with those performed by Osei-Bonsu et al. [41] in a Hele-Shaw cell of constant aperture equal to the hydraulic aperture of the Vosges fracture.
2. Materials and Methods
2.1. Experimental Setups and Procedure
The experiments were conducted by injecting pre-generated foam in a replica of a Vosges sandstone fracture with a length L of 26.0 cm, a width w of 14.8 cm, a mechanical (mean) aperture hm of 0.86 mm and a hydraulic aperture h of 0.500 ± 0.005 mm. The details about the fabrication of the replica can be consulted elsewhere [52, 53]. The aperture map of the fracture replica, which was obtained by Nowamooz et al. [54] by using an image processing procedure based on the attenuation law of Beer-Lambert, is presented in FIGURE 1(a). The minimum aperture is 0 (closed regions) and the maximum aperture 2.294 mm. This figure shows that the smallest apertures are located in the center of the model, while the largest apertures are close to the inlet and the outlet. The probability density function (PDF) of the fracture apertures, shown in FIGURE 1(b), is peaked around 0.71 mm but not symmetrical, as a second smaller peak is seen around 1.13 mm. The power spectrum of one-dimensional profiles of the aperture map parallel to (FIGURE 1(c)) exhibits a power law behavior with a x global exponent -1.6, which indicates long-range spatial correlations along the aperture field. This called self-affine behavior is characterized by the exponent of self-affinity (the so-called Hurst exponent ), such that the exponent of the Fourier power spectrum should be 𝐻
[55]. Hence here. The properties of apethe rture field of geological ‒ (2𝐻 + 1) 𝐻 = 0.3
fractures are in large part inherited from those of the facing fracture walls which define them. In particular, the Fourier spectrum of the aperture field is expected to be self-affine with a Hurst exponent characteristic of the fracture surface topographies (which, for sandstone, is 0.5 [56]) at scales smaller than the correlation length between the two fracture walls, and to
exhibit a lesser decrease at larger scales due to matching of the two walls at these scales [57, 58]. The measured aperture field is consistent with such behaviour if one considers that the correlation length is on the order of the fracture’s length. In addition, an inflection of the spectrum towards a -2 exponent is visible at the largest probed wave numbers (see FIGURE 1(c)), Similarly, the PDF of fracture wall topographies has been measured to be Gaussian [59], from which it follows that the aperture field should have a PDF that is not very different from a Gaussian. In our data (FIGURE 1 (b)), a log-normal distribution which may be suggested by the asymmetry of the curve has been ruled out by plotting the PDF of log(a), and so the hypothesis of a Gaussian distribution with an additional secondary peak is the most likely. The secondary peak could be due to chemical weathering of the minerals over long times.
FIGURE 1. (a) Aperture map of the fracture used in the present experiments (data obtained from Nowamooz et al. [54]). (b) Probability density function (PDF) of the aperture map. (c) The Fourier power spectrum of 1D profiles parallel to , averaged over all profiles, exhibits a 𝑥 power law behaviour.
The foam was generated by simultaneous injection of gas and surfactant solution into a customized foam generator containing a sintered glass disc (Glass Scientific, UK) with a pore size distribution comprised between 16 and 40 µm. The foaming agent was prepared by adding a 1:1 blend of Sodium Dodecyl Sulphate and Cocamidopropyl betaine (2% active content) to a 0.25M NaCl aqueous solution. A dual piston pump (Prep Digital HPCL pump, A.I.T., France) was used to inject the surfactant solution at a controlled flow rate. The gas
phase was air, injected from a pressurized cylinder in series with a mass flow rate regulator (Brooks Instrument 5850S, Serv’ Instrumentation, France). The generated foam was transferred to the models using a tube with 4 mm internal diameter and then injected through four ports regularly spaced across the width of the inlet to ensure uniform foam injection. A membrane-type differential pressure sensor (DP15 Variable Reluctance Pressure Sensor, Validyne, USA) was used to measure the steady-state pressure drop through the model during foam injection. The outlet of the model was connected to the atmosphere. A digital camera with a resolution of 2045 × 2048 pixels was used to capture the dynamics of the process. A light box was placed under the flow cells to improve the illumination of the captured images. Two different series of fracture flow experiments were conducted in this study. First, pre-generated foams with different qualities were injected at a constant gas flow rate of 10 ml/min through the real fracture. The qualities of the injected foams were of 98, 95, 90, 85, 80 and 75% in each case. The fracture was saturated with air before injection of each foam. In these first series of experiments, the foam quality was varied by setting a different liquid flow rate while keeping the gas flow rate constant. Therefore, the total flow rate decreased with increasing foam quality. The second type of experiments aimed at assessing the effects of flow rate by injecting a single foam with a constant quality of 85% through the Vosges sandstone fracture at different gas flow rates: 10, 20, 30, 40, 50 and 60 ml/min. Each experiment was repeated three times to ensure reproducibility and possibly evaluate the uncertainty of the measurements. Error bars represent the standard deviation of the measurements over the three experimental runs performed under identical experimental conditions.
The results were compared to those obtained by Osei-Bonsu et al. [41] using a Hele-Shaw cell with a uniform aperture of 0.5 mm size (equal to the hydraulic aperture of the real
variations on the foam flow. A customized Hele-Shaw cell with dimensions of 31 × 20 × 0.5 cm was used by the latter authors, and the foam was generated by simultaneously pumping air and aqueous surfactant solution through a foam generator similar to the one used in the present experiments. The pre-generated foam was then delivered to the cell through a tube connected to a metal pipe junction, which was screwed to the inlet of the medium. Pressure transducers were also connected to the inlet and the outlet to measure the pressure drop throughout the Hele-Shaw cell.
At the end of the foam flood experiments in the real fracture, after the injection had been interrupted and once the pressure gradient along the fracture could be considered to have approached zero and foam bubbles to have become stagnant, the evolution over time of the size of the bubbles was recorded in different zones in order to assess the impact of the local aperture on foam coarsening.
Finally, another type of flow cell was used to characterize the bubble size distribution of the foams. Indeed, foams obtained with the same foam generator as in the rough fracture flow experiments were flown through a Hele-Shaw cell, that is, a parallelepipedal tank of thickness much 1 mm much smaller than its two other dimensions, and pictures of the foams were taken.
2.2. Image processing & segmentation
A combination of the open source image-processing program ImageJ [60], and of either custom-written MATLAB scripts or available MATLAB functions were used to segment and analyze the image sequences captured during the experiments. Two types of analyses were performed.
Firstly, the foams images taken in the 1mm Hele-Shaw cell were treated to measure the bubble size distribution of the foams, for the various foam qualities. The images were first thresholded and transformed into black and white pictures were the bubbles appeared white on a black background (see figure 2(a)), then the equivalent diameter of all connected white regions in the images was measured as 𝑑 = (𝐴/𝜋)1/2 from their area . We thus obtained the 𝐴 probability density functions for the bubbles’ apparent diameters. There are power laws (see figure 2(b)), except for the largest foam quality (0.98) for which we obtained an exponential distribution. The foam image appeared very different in the latter case, as compared to the others, so obtaining a different type of bubble size distribution was not surprising. For all images a range of small apparent diameters that were outside of the functional trend and corresponding to connected white regions with shapes very different from the circular shapes, were discarded in the analysis.
FIGURE 2. (a) Image of foam of quality 85% in the Hele-Shaw cell (with 12535 bubbles). (b) Corresponding PDF for the apparent diameters of bubbles in (a), fitted with a power law of exponent -2.63. The smallest connected white regions, which fell outside of this distribution and had very non-spherical shapes, were removed from (a).
The bubbles whose apparent diameter is smaller than the HS cell’s thickness (𝑒 = 1 mm) can be considered to have real diameter equal to the measured apparent diameter, while those with an apparent diameter larger than 1 mm are squeezed between the top and bottom glass plates, so their real diameter (when unconstrained) is different from the measured apparent diameter. We have considered that the bubbles of apparent diameter three times larger than the confining cell thickness had a cylindrical shape, and that their real diameter could therefore be estimated from the apparent diameter as 𝑑real=
(
(3/4)𝑒(
𝑑2)
. In the range of2
)
1/3apparent bubble diameters between 1 and 3 mm we have considered a smooth monotonic transition based on a nonlinear combination between these two regimes. The obtained results do not depend much on the functional form taken for that nonlinear combination. Finally the average diameter for the foam bubbles was computed from the distribution. Given the fact that the distribution is a power law, it was obviously important to perform the measurement on a large population of bubbles.
Secondly, pictures or the foams flowing inside the rough fracture, taken at regular time intervals, were used to obtain maps of velocity vectors of the foam bubbles inside the fracture using PIV (Particle Image Velocimetry) analyses, which estimates local velocity by cross-correlating sub-regions of the images between two successive time steps. We used package PIVLab [61] in MATLAB, with a single interrogation size of 128× 18 on the first pass, and 64 × 64 pixels on the second pass. The raw images were first applied a high pass filter of size 15 pixels (see figure 3(a-b)). The horizontal dimension of 2048 pixels corresponded to a length of 260 mm, hence one pixel corresponded to 127 µm in real space, about one order of magnitude smaller than the typical bubble size, but the PIV procedure provided a horizontal resolution of the velocity map of 16 mm. Note that the bubbles whose velocities were measured in this manner belonged to the top layer of bubbles, in contact with the upper wall
of the fracture. For some subparts of the image, the filtered image did not contain any significant “dots” to be traced, so no velocity was measured in these regions (see figure 3(b-d)). It is, in particular, the case for four circular regions along the center line of the flow cell, where pressure sensors were installed.
FIGURE 3. (a) Raw image of the foam flowing through the fracture (flow rate 10 ml/min, quality 85%). (b) Filtered image (high-pass filter). (c) Velocity field obtained with a window size of 128 for the first pass, and 64 for the second pass. (d) Corresponding map of the velocity magnitude. The white regions in (c) are regions where the image contrast was not a good image for the PIV to be successful. In (d) they have been filled by linear interpolation to the surrounding measured values, and the velocity map has been interpolated to match the original resolution.
3. Results and discussion
From analyzing images of the foams in the Hele-Shaw cell as explained in section 2.2, we obtain the mean bubble size for the freshly-generated foams, that is, the initial bubble size for the foams that are being injected in the rough fracture. This initial mean bubble size increases monotonically with the foam quality (see figure 4 (a)) but only varies by 25% when the foam quality varies between 80% and 95%. Between 95% and 98% the foam structure changes sharply and consequently the increase in mean bubble size is much more abrupt.
3.2. Bubble velocity fields
For Newtonian fluids, it is well known that the presence of in a real fracture of spatially-correlated regions of large (respectively, low) apertures results in the creation of tortuous preferential flow paths [36-38, 62]. This flow channeling impacts the fracture’s permeability (or transmissivity), but is also responsible for the anomalous (non-Fickian) transport [54]. According to the results of Tsang [63] for Newtonian fluids, this mechanism can generate pressure drops one or two orders of magnitude higher as compared to the case of a smooth Hele-Shaw cell. In the present experiments, tracing the trajectory of bubbles in the fracture plane shows that the bubbles do not follow an extremely tortuous path that avoids the low-aperture region in the central part of the fracture (see for example figure 3), but their velocity varies significantly along their trajectories, decreasing sharply in this central region. One should remember that such a foam flow is overall incompressible, so if the overall flux for this layer of bubbles varies longitudinal, it must be compensated by an antagonist change in the flux of other bubble layers which we do not measure. In any case, the aperture heterogeneities impact the velocity field significantly, and, therefore, the values of 𝜇app are expected to be higher in the rough fracture than in a smooth fracture of identical mean aperture.
The relationship between foam quality and 𝜇app for both the real fracture and e Hele-Shaw cell was calculated from the experimental measurements using Eq. (1). The results are presented in FIGURE 4 (b). It can be noticed that 𝜇app is much higher in the real fracture than in the Hele-Shaw cell for all investigated foam qualities at the considered flow rate, which is consistent with the increase in pressure drop resulting flow channelling which is responsible for changes in hydraulic conductivity. Note that the pressure loss sensitivity to aperture fluctuations is expected to be higher in the case of shear-thinning fluids and yield stress fluids as foams (shear viscosity depends on the local aperture) [64], as compared to Newtonian fluids.
FIGURE 4. (a) Dependence of the mean initial size of the generated bubble on the foam quality. (b) Relationship between the quality and the apparent viscosity of the injected foams in the real fracture and in the Hele-Shaw cell [41]. (c) Relationship between the quality and mean velocity, computed from the volumetric flow rate. (d) Relationship between the quality and the aperture threshold. The gas flow rate (q ) is 10 ml/min.
It can also be observed from FIGURE 4 (b) that the relationship between the foam’s apparent viscosity and its quality in the Vosges fracture is monotonically decreasing whereas this dependency is monotonically increasing in the Hele-Shaw cell. In their work, Osei-Bonsu et al. [41] stated that the bubbles of foam with a higher quality offer more resistance against interface deformation and hence exhibit lower mobility in the Hele-Shaw cell. In contrast, is all the larger as the foam quality is smaller in the present case of realistic fracture 𝜇𝑎𝑝𝑝
geometry, which is in agreement with some previous studies [44, 65, 66]. Note however that foam was mainly generated by snap off in a foam generator. As we increased the flow rate of surfactant to decrease the foam quality, more surfactant solution was available for foam generation, leading to an increased rate of foam generation and a decrease in the size of the mean bubble size of the foam at the inlet of the fracture (i.e., mean initial bubble size), as shown in FIGURE 4 (a). This also explains the decreasing dependence of the apparent viscosity μapp on the foam quality (FIGURE 4 (b)). Note however that in the data of FIGURE 4(c) the foam quality is not varied independently of all other parameters. Part of the dependence of μapp on the foam quality is due to the slight increase in mean velocity observed as the foam quality is decreased, which clearly appears in FIGURE 4 (c).
Visual observations (which will be discussed in more details in section 3.4) revealed that foam bubbles were stagnant in some parts of the fracture, which means (not surprisingly) that the foam behaved as a yield stress fluid. These observations also showed, in agreement with previous studies [34, 35], that the extension of the stagnant area in the rough fracture becomes smaller as the foam quality was decreased and smaller foam bubbles were generated. The apertures encountered in these areas where bubbles were stagnant were smaller than a threshold value. This threshold value was observed to vary with the foam quality, as shown in FIGURE 4(d), due to the dependence of the size of the bubble on the foam quality (FIGURE 4(a)).
3.4 Shear rate distribution in the rough fracture
FIGURE 5. Maps of velocity magnitude and wall shear rate at 85% foam quality for the rough fracture (a, c) at 10 ml/min gas flow rate and (c, d) at 20 ml/min gas flow rate.
A remarkable feature of the flow patterns in the real fracture is that bubbles were stagnant in the lowest aperture regions. As expected, the foam behaved as a yield stress fluid which does not flow when the applied shear stress is below a threshold value. In the present case, the local shear stress in the low-aperture area fell below the yield stress as the pressure gradient was not high enough at the lowest flow rates. The required pressure gradient to exceed this threshold is obtained by increasing the flow rate. This phenomenon can be seen by comparing the velocity map at 10 and 20 ml/min in FIGURE 5. As the flow rate increased, a larger area of the fracture plane was occupied by flowing foam bubbles.
3.5 Shear rate distribution in the fracture plane
Given that the foam is a shear thinning fluid, the variation in velocity leads to different viscosity values in different regions of the fracture. The equivalent Newtonian wall shear rate
was calculated from the aperture and velocity magnitude maps using the following 𝛾𝑁 expression [67]. (2) 𝛾𝑁= 6𝑣 𝑎
In the preceding equation, v is the local velocity magnitude, i.e. the average value of the velocity profile between both surfaces of the fracture. Here we assume that the local velocity magnitude which we measure and is represented in FIGURE 5 can be assimilated to v in Eq. (2). In the same equation, a is the local aperture value as represented in the aperture map of Figure 1. Eq. (2) applies to the 2-D flow of a constant viscosity liquid between two infinite parallel planes (the plane Poiseuille configuration). However, for flows of liquids with a shear-rate-dependent viscosity, the calculation of the shear rate is more complex as the velocity profile is no longer parabolic [68]. In this case, the true wall shear rate can be found using the Weissenberg–Rabinowitsch–Mooney equation [68]:
,
𝛾 =𝛾3𝑁
[
2 +𝑑𝑑(𝑙𝑛𝜏)(𝑙𝑛𝛾𝑁)]
(3)with the wall shear stress. It must be noted that the rough approximation 𝜏 𝛾 ≈ 𝛾𝑁 has been made in the present analysis. Improved accuracy can be achieved by calculating 𝑑𝑑(𝑙𝑛𝜏)(𝑙𝑛𝛾𝑁), which
is needed as input in Eq. (3). However, the experimental pressure distribution throughout the fracture would be required for the calculation of , which was not available in the present 𝜏 experiments.
The results in terms of wall shear rate distribution are shown in FIGURE 5, for foams of quality 85% and flow rates of 10 and 20 ml/min. This figure shows that the shear rate in the rough fracture is strongly impacted by the spatial variations of the aperture field, as expected from its definition. In contrast, it would be uniform within the Hele-Shaw cell of [41]. The
zero shear rate regions are simply the regions where the velocity of the foam is zero, which exist due to the fact that the foam is a yield stress fluid. The extension of these regions of stagnant bubbles became smaller as the flow rate was increased (see Figure 5).
The steady-state shear flow of bulk foams has been proved to be well described by the Herschel–Bulkley law [69] in previous works [70-72]. This empirical law can be written as follows:
{
𝜏 = 𝜏0+ 𝑎𝛾 𝑛 for 𝜏 > 𝜏0 𝛾 = 0 for 𝜏 ≤ 𝜏0 (4)Where is the yield stress, is the consistency and n is the flow index of the fluid. In the 𝜏0 𝑎 case of shear-thinning yield stress fluids, n is inferior to unity. For bulk foams it is usually in the range [0.2;0.4] (see for example[73]). The three parameters are generally calculated by fitting the data obtained by measuring the shear rate as a function of the applied shear stress 𝛾 τ using a rheometer, which is particularly challenging in the case of foams. For a foam flowing through a porous medium, the rheology is also expected to follow a similar Herschel-Bulkley rheology, but with values of the yield stress, consistency and yield stress that are different from those exhibited in bulk foam flow. Our present study provides hints towards a method to measure the in situ rheology of the foam flowing through the porous medium. The apparent shear rate of the complex fluid flowing through the real fracture 𝛾𝑎𝑝𝑝 can be obtained from the ratio of the characteristic pore velocity q (obtained by dividing the total flow rate by the cross-sectional area) and the characteristic microscopic length usually taken as 𝐾:
(5) 𝛾𝑎𝑝𝑝= 𝛼 𝑞𝐾
where 𝐾 =ℎ for a fracture and is an empirical shift factor known to be a function of both
2
input in the rheological model (Eq. 4) in order to predict the viscosity of the fluid in the porous medium. Nevertheless, , and n are unknown in the case of foams, so the preceding 𝜏0 𝑎 approach is hardly applicable. Also, it has been traditionally assumed that is independent of 𝛼 q. However, Rodríguez de Castro and Radilla [78] recently showed, using flow experiments of polymer solutions in rough fractures, that this assumption is no longer valid in the presence of a yield stress.
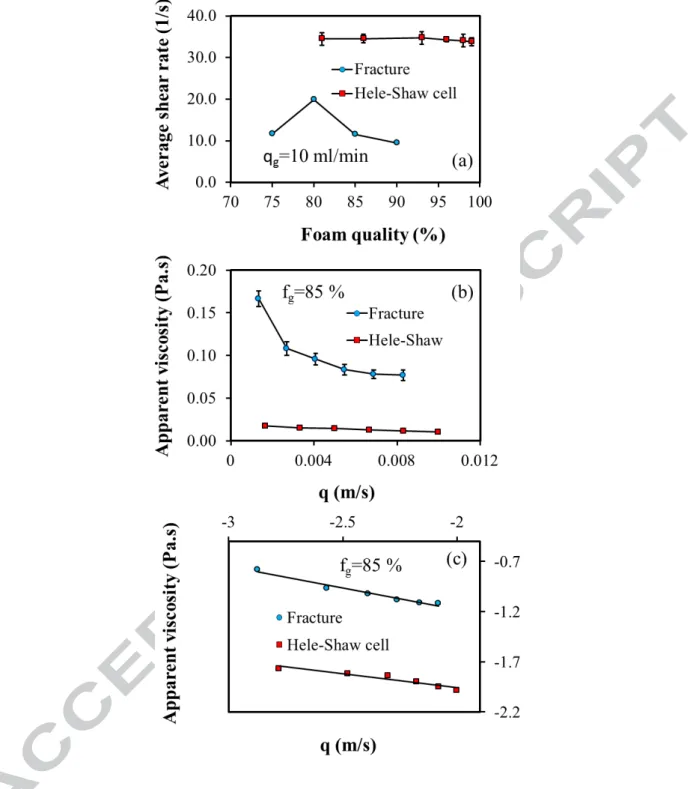
The average wall shear rate 𝛾𝑎𝑣 throughout the media, obtained from averaging the shear rate maps such as those shown in FIGURE 5 is plotted as a function of the foam quality for a flow rate of 10 ml/min in Figure 6(a). FIGURE 6(a) shows that the average shear rate is not monotonic as a function of the foam quality in the real fracture. It is reminded here that foam quality was varied by setting a different liquid flow rate while keeping the gas flow rate constant. Therefore, decreasing foam quality leads to increased rate of foam generation with finer texture (smaller bubbles). According to Princen [34] and Hohler and Cohen-Addad [35], the yield stress is inversely proportional to the size of the bubbles. Finer foam bubbles at lower foam quality have lower yield stress that lead to the flow of foam bubbles to a wider area of the fracture (FIGURE 4 (b-d)), which tends to increase the average shear rate. On the contrary, decreasing the foam quality means decreasing the average flow velocity (see Figure 4(c)) to some extent, which tends to promote a lower mean shear rate. These two competing effects may explain the non-monotonicity of the plot in Figure 6(a).
The average shear rate was also computed for the series of experiments at constant foam quality 85% and various flow rates ranging between 10 and 60 ml/min, but the acquisition frequency of 1 Hz allowed obtaining meaningful velocity fields only for the data recorded at 10 and 20 ml/min (at 11.5 and 22.6 m/s, respectively), with an increase when increasing the flow rate, as expected. In contrast, the dependence of the apparent viscosity could be obtained
from Eq. (1)) for all flow rates. Figure 6(b) shows apparent viscosity decreases with flow rate in both fracture and Hele-Shaw cell as expected due to shear thinning behavior of foam. It is shown in Figure 6(c) and seems consistent with a power law behavior, of exponent -0.41, to be compared to the exponent -0.27 for the Hele-Shaw cell data of Osei-Bonsu et al. Since only two measurements of the average shear rate were available, we could not check that the dependence of the apparent viscosity on the average shear rate was consistent with a power law behavior, but we propose that a method based on such “apparent rheograms” could be used to measure the in situ rheology of the foam in the porous medium.
FIGURE 6. (a) Dependence of the average shear rate on the foam quality at a 10 ml/min gas flow rate. (b) and (c) Apparent viscosity 𝜇app vs. the mean flow velocity q for foams of quality 85% in linear and log-log plot respectively. The same is also shown for the Hele-Shaw cell of identical transmissivity, for comparison.
Similarly, the shift factor (𝛼 =𝛾𝑎𝑣 𝐾/𝑞 assuming 𝛾𝑎𝑣~𝛾𝑎𝑝𝑝 in Eq. (5)) could be computed for the two flow rates 10 and 20 ml/min, to 1.30 and 1.26, respectively.
3.6. Correlations between foam coarsening and aperture distribution
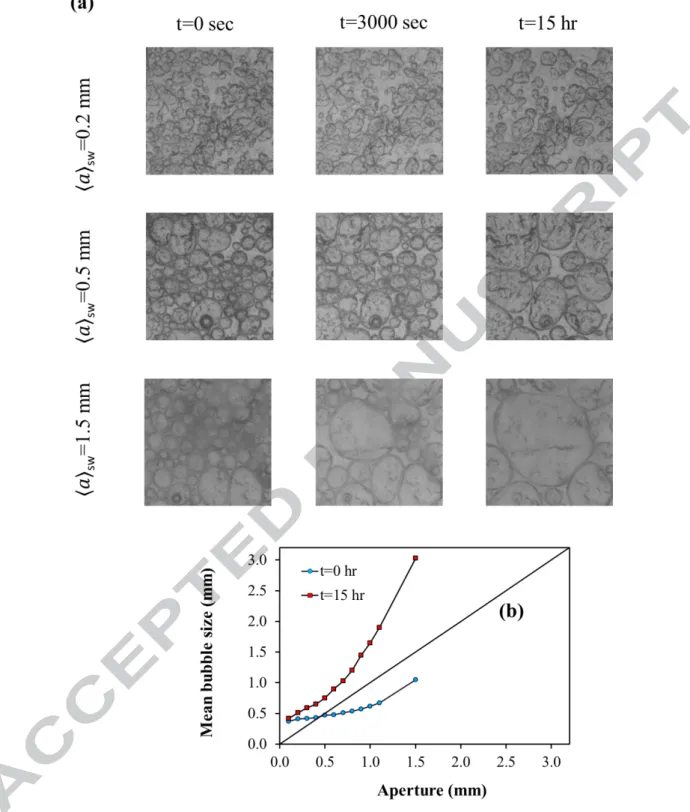
The nature of foams is dynamic; their structure changes with time due to foam coalescence by liquid drainage, film rupture and gas diffusion across the films separating neighboring bubbles [35]. It is interesting to observe how the local fracture aperture influences the coarsening dynamics of the foam after the flow has been stopped. To this end, closed views of the foam’s structure were recorded in sub-windows of the entire fracture plane positioned at different positions in that plane. All these sub-windows corresponded to different mean apertures (computed over the sub-window). The evolution of the mean bubble sizes was monitored for a total duration of 15 hours. FIGURE 7(a) shows pictures taken for three sub-windows for which the mean aperture was respectively 0.2, 0.5 and 1.5 mm, at three different times after the flow has been stopped: 0 s, 3000 s, and 15 h. The coarsening in time of the foam is clearly visible in all image, and appears to be all the faster as the mean aperture is larger. FIGURE 7(b) shows the corresponding dependence of the mean bubble size 〈𝑑〉sw on the mean aperture 〈𝑎〉sw, at times 0 s and 15 h after the flow has been stopped. The gas diffusion rate through the films is expected to be higher at earlier times as smaller foam bubbles with higher internal pressure exist in the system. Gas diffuses from smaller to larger bubbles with a rate that is proportional to the pressure difference between them, eventually leading to the vanishing of the smallest bubbles and continuous coarsening of the foam. The mean bubble size 〈𝑑〉sw is indeed observed increase in time, for a given 〈𝑎〉sw, as expected, but as we only have measurements at two different times we cannot quantify the changes in coarsening rates. More interestingly, at a given time the mean bubble size appears to be highly correlated to the mean aperture in the sub-windows, following a monotonically increasing dependence.
It is interesting to note that the mean aperture for which the plots are above the 〈𝑑〉sw= 〈𝑎〉sw line correspond to regions in which the mean horizontal size of the bubbles is larger than the aperture that confines them vertically. Consequently, it is very likely that there is only one layer of bubbles in these regions of the fracture planes. In contrast, as the mean aperture is larger than the mean horizontal bubble size, the bubbles are expected to be pseudo-spherical as they are not confined between the two fracture walls. Therefore, more than one layer of bubbles can exist in these regions. The plot obtained for the initial time (after the flow has been stopped) is particularly interesting as it shows the structural state of the foam resulting from its flow in the fracture. This means that smaller bubbles flow in smaller aperture regions, while larger bubbles flow in larger aperture regions. Furthermore, only bubbles present in low aperture regions (or mean aperture smaller than 0.5 mm) are confined vertically (despite being smaller than in regions of larger aperture). On the contrary, at t = 15 h after the flow has been stopped, the local mean bubble size is larger than the local mean aperture in all sub-windows, and so the foam can be expected to be confined vertically in all of them. In other words, at t = 15h the foam is two-dimensional in the entire fracture plane (i.e., there is a monolayer of bubbles everywhere).
FIGURE 7. (a) Bubbles observed in different sub-windows of the aperture plane, at successive times 0 s, 3000 s, and 15 h after the flow has been stopped. The mean fracture aperture in the sub-window in question is denoted 〈𝑎〉sw. (b) Dependence of the mean bubble size in the sub-window as a function of the mean aperture 〈𝑎〉sw.
As Cohen-Addad [79] showed, the foam’s apparent viscosity decreases during foam coarsening process. Accordingly, we can expect a deterioration of the sweep efficiency when using coarsened foam as displacing fluid, given the decrease in 𝜇app.
4. Conclusions
As for the creeping flow of a Newtonian fluid [80, 81], spatial variations of the aperture field of a rough fracture with a realistic geometry strongly impacts the flow of an aqueous foam. To the best of our knowledge, all previous experimental studies addressing foam flow in fractured media had only been conducted on fractured media manufactured by glass plates [40, 41, 44, 82], with unrealistic fracture geometries, or real fracture media but with no quantitative characterization of the aperture field [46, 83-85]. In additional, though several of these previous studies featured local visualization of bubble morphologies [26][40, 41, 44] [45, 46][48], and in some cases the measurement of bubble size distributions [40, 44], none of them reported bubble velocity measurements nor tried to link local bubble velocities to the in situ rheology of the foam. This study set out to provide an understanding of the effects of spatial aperture variations on the flow patterns, shear rheology, and bubble morphology during the flow of foams through a realistic fracture geometry, that is, a geometry that possesses the right spatial correlation properties which are known to be typical of fracture surfaces and the gap between them [86, 87]. To do so, a comprehensive series of single-phase flow experiments were conducted in a replica of natural rough-walled fracture (Vosges sandstone), and confronted to similar measurement performed in a Hele-Shaw cell fracture of identical hydraulic aperture. Based on these measurements, the following observations and conclusions can be drawn:
The aperture variation strongly affects the apparent viscosity of foam. In particular, the existence of spatially-correlated low- and high-aperture areas increases flow
tortuosity and the velocity contrast between preferential flow channels and stagnant zones, as is the case for the flow of a Newtonian fluid. By modifying the velocity field and, consequently, the shear rate distribution, it controls the in situ rheology of the foam.
Foam is a yield stress fluid and exhibits shear-thinning behavior when flowing through a porous medium, but the rheology is not necessarily the same as that of the bulk foam. Here we could not obtain a complete “in situ” rheogram for the 85 % foam from foam bubble velocity measurements, but we propose to use this method to measure the in situ rheology of the foam. In this case, the measurements that could be made point to a power law of exponent -0.41.
The foam’s bubble size inside the fracture is correlated to the local fracture aperture, and is all the larger as the local aperture is larger. The transition from bulk foam to a vertically-confined two-dimensional foam occurs in the fracture plane along the equi-aperture lines a=0.5 mm in our setup.
The dynamics of foam coarsening inside the fracture is correlated to the local aperture and is all the faster as the local aperture is larger.
A replica of a Vosges sandstone fracture with a given Hurst exponent was considered in the present study to investigate the effect of spatial distribution on apparent shear viscosity and bubble morphology. In future studies, it would be interesting to consider similar geometries with various Hurst (H) exponent values as well as, possibly, different matching (i.e., correlation) scales between the two fractures walls, and correlate the flow properties of the foam to theses stochastic geometrical parameters.
5. Acknowledgment
We would like to acknowledge the UK Engineering and Physical Sciences Research Council (EPSRC) for providing the Ph.D. studentship for Mohammad Javad Shojaei. We thank Pr. Giovanni Radilla for providing the equipment used in the experiments. We also thank Frédéric Bastien for his assistance with the experimental setup.
6. References
[1] Y.-S. Wu, Multiphase Fluid Flow in Porous and Fractured Reservoirs, Gulf Professional Publishing2015.
[2] C. Chen, D. Zhang, Pore-scale simulation of density-driven convection in fractured porous media during geological CO2 sequestration, Water Resources Research 46(11) (2010).
[3] O. Cicek, Compositional and non-isothermal simulation of CO2 sequestration in naturally fractured reservoirs/coalbeds: Development and verification of the model, SPE Annual Technical Conference and Exhibition, Society of Petroleum Engineers, 2003.
[4] F. Chen, X. Liu, R.W. Falta, L.C. Murdoch, Experimental demonstration of contaminant removal from fractured rock by boiling, Environmental science & technology 44(16) (2010) 6437-6442.
[5] B.B.S. Singhal, R.P. Gupta, Applied hydrogeology of fractured rocks, Springer Science & Business Media2010.
[6] C.F. Tsang, I. Neretnieks, Flow channeling in heterogeneous fractured rocks, Reviews of Geophysics 36(2) (1998) 275-298.
[7] A. De Wit, G. Homsy, Viscous fingering in periodically heterogeneous porous media. II. Numerical simulations, The Journal of chemical physics 107(22) (1997) 9619-9628.
[8] Y.M. Al-Wahaibi, First-contact-miscible and multicontact-miscible gas injection within a channeling heterogeneity system, Energy & Fuels 24(3) (2010) 1813-1821.
[9] K. Osei-Bonsu, N. Shokri, P. Grassia, Foam stability in the presence and absence of hydrocarbons: From bubble-to bulk-scale, Colloids and Surfaces A: Physicochemical and Engineering Aspects 481 (2015) 514-526.
[10] G. Hirasaki, J. Lawson, Mechanisms of foam flow in porous media: apparent viscosity in smooth capillaries, Society of Petroleum Engineers Journal 25(02) (1985) 176-190.
[11] M.J. Shojaei, K. Osei-Bonsu, S. Richman, P. Grassia, N. Shokri, Foam stability influenced by displaced fluids and by pore size of porous media, Industrial & Engineering Chemistry Research 58(2) (2018) 1068-1074.
[12] M. Abbaszadeh, F. Rodriguez De La Garza, C. Yuan, G.A. Pope, Single-Well Simulation Study of Foam EOR in Gas-Cap Oil of the Naturally-Fractured Cantarell Field, SPE Improved Oil Recovery Symposium, Society of Petroleum Engineers, 2010.
[13] A.H. Kvæstad, CO2-foaming agent retention in fractured chalk models: Experiments and simulations, University of Stavanger, Norway, 2011.
[14] S.A. Johansen, An Experimental Study of Foam Flow in Fractured Systems of Increasing Size, The University of Bergen, 2016.
[15] A. Telmadarreie, Evaluating the Potential of CO2 Foam and CO2 Polymer Enhanced Foam for Heavy Oil Recovery in Fractured Reservoirs: Pore-Scale and Core-Scale Studies, University of Alberta, 2017.
[16] Å. Haugen, M.A. Fernø, A. Graue, H.J. Bertin, Experimental study of foam flow in fractured oil-wet limestone for enhanced oil recovery, SPE Reservoir Evaluation & Engineering 15(02) (2012) 218-228.
[17] R. Farajzadeh, B. Wassing, P.M. Boerrigter, Foam assisted gas–oil gravity drainage in naturally-fractured reservoirs, Journal of Petroleum Science and Engineering 94 (2012) 112-122.
[18] M. Fernø, Ø. Eide, M. Steinsbø, S. Langlo, A. Christophersen, A. Skibenes, T. Ydstebø, A. Graue, Mobility control during CO 2 EOR in fractured carbonates using foam: Laboratory evaluation and numerical simulations, Journal of Petroleum Science and Engineering 135 (2015) 442-451.
[19] J. Zuta, I. Fjelde, Transport of CO2-foaming agents during CO2-foam processes in fractured chalk rock, SPE Reservoir Evaluation & Engineering 13(04) (2010) 710-719.
[21] M.J. Shojaei, K. Osei-Bonsu, P. Grassia, N. Shokri, Foam Flow Investigation in 3D-Printed Porous Media: Fingering and Gravitational Effects, Industrial & Engineering Chemistry Research 57(21) (2018) 7275-7281.
[22] A. Andrianov, R. Farajzadeh, M. Mahmoodi Nick, M. Talanana, P.L. Zitha, Immiscible foam for enhancing oil recovery: bulk and porous media experiments, Industrial & Engineering Chemistry Research 51(5) (2012) 2214-2226.
[23] A. Aronson, V. Bergeron, M.E. Fagan, C. Radke, The influence of disjoining pressure on foam stability and flow in porous media, Colloids and Surfaces A: Physicochemical and Engineering Aspects 83(2) (1994) 109-120.
[24] A. Kovscek, C. Radke, Fundamentals of foam transport in porous media, ACS Publications1994. [25] G. Verbist, D. Weaire, A. Kraynik, The foam drainage equation, Journal of Physics: Condensed Matter 8(21) (1996) 3715.
[26] A. Kovscek, D. Tretheway, P. Persoff, C.J.J.o.P.S. Radke, Engineering, Foam flow through a transparent rough-walled rock fracture, 13(2) (1995) 75-86.
[27] K. Chambers, C. Radke, Interfacial phenomena in petroleum recovery, Morrow, NR, Ed, 1990. [28] A. Jiménez, C. Radke, Dynamic stability of foam lamellae flowing through a periodically constricted pore, ACS Symposium series, AMER CHEMICAL SOC 1155 16TH ST, NW, WASHINGTON, DC 20036, 1989, pp. 460-479.
[29] J. Von Neumann, Metal interfaces, American Society for Metals, Cleveland 108 (1952).
[30] S. Jones, N. Getrouw, S. Vincent-Bonnieu, Foam flow in a model porous medium: I. The effect of foam coarsening, Soft matter 14(18) (2018) 3490-3496.
[31] F. Rouyer, S. Cohen-Addad, R. Höhler, Is the yield stress of aqueous foam a well-defined quantity?, Colloids and Surfaces A: Physicochemical and Engineering Aspects 263(1-3) (2005) 111-116.
[32] A. Lindner, P. Coussot, D. Bonn, Viscous fingering in a yield stress fluid, Physical Review Letters 85(2) (2000) 314.
[33] B. Gardiner, B. Dlugogorski, G. Jameson, R. Chhabra, Yield stress measurements of aqueous foams in the dry limit, Journal of rheology 42(6) (1998) 1437-1450.
[34] H. Princen, Rheology of foams and highly concentrated emulsions: I. Elastic properties and yield stress of a cylindrical model system, Journal of Colloid and interface science 91(1) (1983) 160-175. [35] R. Höhler, S. Cohen-Addad, Rheology of liquid foam, Journal of Physics: Condensed Matter 17(41) (2005) R1041.
[36] S.R. Brown, Fluid flow through rock joints: the effect of surface roughness, Journal of Geophysical Research: Solid Earth 92(B2) (1987) 1337-1347.
[37] Y. Méheust, J. Schmittbuhl, Flow enhancement of a rough fracture, Geophysical Research Letters 27(18) (2000) 2989-2992.
[38] Y. Méheust, J. Schmittbuhl, Geometrical heterogeneities and permeability anisotropy of rough fractures, Journal of Geophysical Research: Solid Earth 106(B2) (2001) 2089-2102.
[39] Y. Méheust, J. Schmittbuhl, Scale effects related to flow in rough fractures, Pure and Applied Geophysics 160(5-6) (2003) 1023-1050.
[40] W. Yan, C.A. Miller, G.J. Hirasaki, Foam sweep in fractures for enhanced oil recovery, Colloids and Surfaces A: Physicochemical and Engineering Aspects 282 (2006) 348-359.
[41] K. Osei-Bonsu, N. Shokri, P. Grassia, Fundamental investigation of foam flow in a liquid-filled Hele-Shaw cell, Journal of colloid and interface science 462 (2016) 288-296.
[42] S.A. Jones, B. Dollet, Y. Méheust, S.J. Cox, I.J.P.o.F. Cantat, Structure-dependent mobility of a dry aqueous foam flowing along two parallel channels, 25(6) (2013) 063101.
[43] A.G. Polden, Foam Generation and Flow in Fractures with Different Aperture, The University of Bergen, 2017.
[44] M. Buchgraber, L.M. Castanier, A.R. Kovscek, Microvisual investigation of foam flow in ideal fractures: role of fracture aperture and surface roughness, SPE Annual Technical Conference and Exhibition, Society of Petroleum Engineers, 2012.
[45] B. AlQuaimi, W.R.J.E. Rossen, Fuels, Foam generation and rheology in a variety of model fractures, 33(1) (2018) 68-80.
[46] Å. Haugen, N. Mani, S. Svenningsen, B. Brattekås, A. Graue, G. Ersland, M.A. Fernø, Miscible and immiscible foam injection for mobility control and EOR in fractured oil-wet carbonate rocks, Transport in porous media 104(1) (2014) 109-131.
[47] M.A. Fernø, J. Gauteplass, M. Pancharoen, Å. Haugen, A. Graue, A.R. Kovscek, G.J.S.J. Hirasaki, Experimental study of foam generation, sweep efficiency, and flow in a fracture network, 21(04) (2016) 1,140-1,150.
[48] A. Telmadarreie, J.J. Trivedi, New insight on carbonate-heavy-oil recovery: pore-scale mechanisms of post-solvent carbon dioxide foam/polymer-enhanced-foam flooding, SPE Journal 21(05) (2016) 1,655-1,668.
[49] J. Gauteplass, K. Chaudhary, A.R. Kovscek, M.A. Fernø, Pore-level foam generation and flow for mobility control in fractured systems, Colloids and Surfaces A: Physicochemical and Engineering Aspects 468 (2015) 184-192.
[50] B. Géraud, S.A. Jones, I. Cantat, B. Dollet, Y.J.W.R.R. Méheust, The flow of a foam in a two-dimensional porous medium, 52(2) (2016) 773-790.
[51] B. Géraud, Y. Méheust, I. Cantat, B.J.P.r.l. Dollet, Lamella division in a foam flowing through a two-dimensional porous medium: A model fragmentation process, 118(9) (2017) 098003.
[52] E. Isakov, S.R. Ogilvie, C.W. Taylor, P.W. Glover, Fluid flow through rough fractures in rocks I: high resolution aperture determinations, Earth and Planetary Science Letters 191(3-4) (2001) 267-282.
[53] G. Radilla, A. Nowamooz, M. Fourar, Modeling non-Darcian single-and two-phase flow in transparent replicas of rough-walled rock fractures, Transport in porous media 98(2) (2013) 401-426. [54] A. Nowamooz, G. Radilla, M. Fourar, B. Berkowitz, Non-Fickian transport in transparent replicas of rough-walled rock fractures, Transport in porous media 98(3) (2013) 651-682.
[55] J. Schmittbuhl, F. Schmitt, C. Scholz, Scaling invariance of crack surfaces, Journal of Geophysical Research: Solid Earth 100(B4) (1995) 5953-5973.
[56] J.-M. Boffa, C. Allain, R. Chertcoff, J.-P. Hulin, F. Plouraboué, S. Roux, Roughness of sandstone fracture surfaces: Profilometry and shadow length investigations, The European Physical Journal B-Condensed Matter and Complex Systems 7(2) (1999) 179-182.
[57] S.R. Brown, R.L. Kranz, B.P. Bonner, Correlation between the surfaces of natural rock joints, Geophysical Research Letters 13(13) (1986) 1430-1433.
[58] S.R. Brown, Simple mathematical model of a rough fracture, Journal of Geophysical Research: Solid Earth 100(B4) (1995) 5941-5952.
[59] L. Ponson, H. Auradou, M. Pessel, V. Lazarus, J.-P. Hulin, Failure mechanisms and surface roughness statistics of fractured Fontainebleau sandstone, Physical Review E 76(3) (2007) 036108. [60] W.S. Rasband, Imagej, us national institutes of health, bethesda, maryland, usa, http://imagej. nih. gov/ij/ (2011).
[61] W. Thielicke, E.J. Stamhuis, PIVlab-towards user-friendly, affordable and accurate digital particle image velocimetry in MATLAB, Journal of Open Research Software 2 (2014).
[62] S. Brown, A. Caprihan, R. Hardy, Experimental observation of fluid flow channels in a single fracture, Journal of Geophysical Research: Solid Earth 103(B3) (1998) 5125-5132.
[63] Y. Tsang, The effect of tortuosity on fluid flow through a single fracture, Water Resources Research 20(9) (1984) 1209-1215.
[64] A. Roustaei, T. Chevalier, L. Talon, I. Frigaard, Non-Darcy effects in fracture flows of a yield stress fluid, Journal of Fluid Mechanics 805 (2016) 222-261.
[65] J. Alverez, H. Rivas, W. Rossen, A unified model for steady-state foam behavior at high and low foam qualities, IOR 1999-10th European Symposium on Improved Oil Recovery, 1999.
[66] F. Vassenden, T. Holt, Experimental foundation for relative permeability modeling of foam, SPE/DOE Improved Oil Recovery Symposium, Society of Petroleum Engineers, 1998.
[67] C.J. Pipe, T.S. Majmudar, G.H. McKinley, High shear rate viscometry, Rheologica Acta 47(5-6) (2008) 621-642.
[68] C.W. Macosko, Rheology: principles, measurements, and applications, Wiley-vch1994.
[69] W.H. Herschel, R. Bulkley, Konsistenzmessungen von gummi-benzollösungen, Colloid & Polymer Science 39(4) (1926) 291-300.
[70] R.E. Reidenbach, K.W. McCleary, Advertising and male nudity: An experimental investigation, Journal of the Academy of Marketing Science 11(4) (1983) 444-454.
[71] P. Harris, S. Heath, Rheological properties of low-gel-loading borate fracture gels, SPE production & facilities 13(04) (1998) 230-235.
[72] L.F. Bonilla, S.N. Shah, Experimental investigation on the rheology of foams, SPE/CERI Gas Technology Symposium, Society of Petroleum Engineers, 2000.
[73] N.D. Denkov, V. Subramanian, D. Gurovich, A. Lips, Wall slip and viscous dissipation in sheared foams: Effect of surface mobility, Colloids and Surfaces A: Physicochemical and Engineering Aspects 263(1-3) (2005) 129-145.
[74] G. Chauveteau, Rodlike polymer solution flow through fine pores: influence of pore size on rheological behavior, Journal of Rheology 26(2) (1982) 111-142.
[75] K. Sorbie, P. Clifford, E. Jones, The rheology of pseudoplastic fluids in porous media using network modeling, Journal of Colloid and Interface Science 130(2) (1989) 508-534.
[76] X. Lopez, P.H. Valvatne, M.J. Blunt, Predictive network modeling of single-phase non-Newtonian flow in porous media, Journal of colloid and interface science 264(1) (2003) 256-265.
[77] S. Comba, D. Dalmazzo, E. Santagata, R. Sethi, Rheological characterization of xanthan suspensions of nanoscale iron for injection in porous media, Journal of hazardous materials 185(2-3) (2011) 598-605.
[78] A. Rodríguez de Castro, G. Radilla, Flow of yield stress and Carreau fluids through rough-walled rock fractures: Prediction and experiments, Water Resources Research (2017).
[79] S. Cohen-Addad, H. Hoballah, R. Höhler, Viscoelastic response of a coarsening foam, Physical Review E 57(6) (1998) 6897.
[80] Y. Méheust, J.J.J.o.G.R.S.E. Schmittbuhl, Geometrical heterogeneities and permeability anisotropy of rough fractures, 106(B2) (2001) 2089-2102.
[81] S.R.J.J.o.G.R.S.E. Brown, Fluid flow through rock joints: the effect of surface roughness, 92(B2) (1987) 1337-1347.
[82] A. Perez, V.S. ALVAREZ, F. SANCHEZ, A. MEDINA, Foam Injection into horizontal cells with channels of different openings, Revista Mexicana de Física 64(5) (2018) 530-538.
[83] A. Kovscek, D. Tretheway, P. Persoff, C. Radke, Foam flow through a transparent rough-walled rock fracture, Journal of Petroleum Science and Engineering 13(2) (1995) 75-86.
[84] B. Brattekas, A. Haugen, G. Ersland, O. Eide, A. Graue, M. Ferno, Fracture mobility control by polymer gel-integrated EOR in fractured, oil-wet carbonate rocks, EAGE Annual Conference & Exhibition incorporating SPE Europec, Society of Petroleum Engineers, 2013.
[85] M.A. Ferno, J. Gauteplass, M. Pancharoen, A. Haugen, A. Graue, A.R. Kovscek, G.J. Hirasaki, Experimental study of foam generation, sweep efficiency and flow in a fracture network, SPE Annual Technical Conference and Exhibition, Society of Petroleum Engineers, 2014.
[86] S.R.J.J.o.G.R.S.E. Brown, Simple mathematical model of a rough fracture, 100(B4) (1995) 5941-5952.
[87] S.R. Brown, R.L. Kranz, B.P.J.G.R.L. Bonner, Correlation between the surfaces of natural rock joints, 13(13) (1986) 1430-1433.