ORIGINAL PAPER
A novel method for quantification of sulfolane
(a metabolite of busulfan) in plasma by gas
chromatography
–tandem mass spectrometry
François Versace&Chakradhara Rao S. Uppugunduri&
Maja Krajinovic&Yves Théorêt&Fabienne Gumy-Pause&
Patrice Mangin&Christian Staub&Marc Ansari
Received: 21 June 2012 / Revised: 19 July 2012 / Accepted: 2 August 2012 / Published online: 24 August 2012 # Springer-Verlag 2012
Abstract The role of busulfan (Bu) metabolites in the ad-verse events seen during hematopoietic stem cell transplanta-tion and in drug interactransplanta-tions is not explored. Lack of availability of established analytical methods limits our un-derstanding in this area. The present work describes a novel gas chromatography–tandem mass spectrometric assay for the analysis of sulfolane (Su) in plasma of patients receiving high-dose Bu. Su and Bu were extracted from a single 100μL plasma sample by liquid–liquid extraction. Bu was separately derivatized with 2,3,5,6-tetrafluorothiophenol fluorinated agent. Mass spectrometric detection of the analytes was performed in the selected reaction moni-toring mode on a triple quadrupole instrument after electronic impact ionization. Bu and Su were analyzed with separate chromatographic programs, lasting 5 min each. The assay for Su was found to be linear in the
concentration range of 20–400 ng/mL. The method has sat-isfactory sensitivity (lower limit of quantification, 20 ng/ mL) and precision (relative standard deviation less than 15 %) for all the concentrations tested with a good trueness (100±5 %). This method was applied to measure Su from pediatric patients with samples collected 4 h after dose 1 (n046), before dose 7 (n056), and after dose 9 (n054) infusions of Bu. Su (mean±SD) was detectable in plasma of patients 4 h after dose 1, and higher levels were ob-served after dose 9 (249.9±123.4 ng/mL). This method may be used in clinical studies investigating the role of Su on adverse events and drug interactions associated with Bu therapy.
Keywords GC–MS/MS . Sulfolane .Busulfan .Metabolite . Pharmacokinetics . Therapeutic drug monitoring . Plasma
Introduction
Busulfan (Bu) is one of the most commonly used alkylat-ing agents in the myeloablative conditionalkylat-ing regimen before hematopoietic stem cell transplantation [1, 2]. Hepatic veno-occlusive disease, pulmonary interstitial fi-brosis, mucositis, and convulsions are the common ad-verse events seen with Bu therapy. Studies have shown association of these adverse events with high plasma levels of Bu, especially in children [3, 4]. However, occurrence of these events cannot be completely explained by the Bu plasma levels [5]. Indeed, the mechanisms of the adverse events are not clearly understood, and the role of Bu and its reactive metabolites on elucidating these events or their interaction with co-administered drugs is not clearly known.
François Versace and Chakradhara Rao S Uppugunduri contributed equally to this work.
Electronic supplementary material The online version of this article (doi:10.1007/s00216-012-6330-y) contains supplementary material, which is available to authorized users.
F. Versace
:
P. Mangin:
C. StaubUnit of Toxicology, University Center of Legal Medicine, 1211 Geneva, Switzerland
C. R. S. Uppugunduri
:
F. Gumy-Pause:
M. Ansari (*) Department of Pediatrics, Onco-hematology Unit, University Hospital of Geneva,1211 Geneva, Switzerland e-mail: [email protected] M. Krajinovic
:
Y. ThéorêtDepartment of Pharmacology, CHU Sainte Justine, University of Montréal,
H3C 3J7 Montréal, Canada DOI 10.1007/s00216-012-6330-y
Bu is metabolized by liver cytosolic glutathione-S-transfer-ase enzymes (GST isoforms GSTA1-1, GSTM1-1, and GSTP1-1) to form a positively charged conjugate known as a sulfonium ion conjugate [γ-glutamyl-β-(S-tetrahydrothiophe-nium)-alanyl-glycine], which dissociates non-enzymatically at alkaline pH and 37 °C or by enzymatic reaction catalyzed by cystathionine-γ-lyase to tetrahydrothiophene (THT), pyruvate, and ammonia [6,7]. THT is a lipophilic, volatile heterocyclic small molecule that gets oxidized to THT1,1-dioxide or sulfo-lane (Su) via the formation of THT,1-oxide [8,9]. THT, 1-oxide, Su, and its oxidation product 3-hydroxy Su have been identified as the urinary metabolites of Bu in humans [10]. It is presumed that several cytochrome P 450 enzymes (CYP iso-forms) might play a role in the oxidation of THT to Su and in the formation of 3-hydroxy Su. It is also presumed that these metabolites might play a role in altering the metabolism of cyclophosphamide administered after Bu. However, there are no data available on CYP isoforms catalyzing these oxidation reactions or on the distribution and fate of the metabolites, due to the lack of established analytical methods.
Two analytical methods for THT measurement have been described in the literature, and applied to in vitro and in vivo experiments [11,12]. Nevertheless, the use of these methods for plasma level measurements of THT is tedious, and the detection of THT in samples collected during clinical stud-ies is problematic due to its volatile nature. THT 1,1-dioxide or Su is a small molecule that is relatively stable compared to THT and is an immediate metabolite formed after oxida-tion of THT1-oxide. Su undergoes oxidaoxida-tion to 3-hydroxy Su, which is excreted in urine due to its hydrophilic nature [10]. Su is thus an important relatively stable intermediate metabolite, and its levels in plasma may be indicative of the metabolic fate of Bu. Even though a method for Su deter-mination from ground water was described for environmen-tal investigations [13], to the best of our knowledge, no method has been described in the literature for Su quantifi-cation in the plasma of patients receiving intravenous Bu.
In this article, we describe a novel gas chromatography– tandem mass spectrometric (GC–MS/MS) method for the mea-surement of Su in human plasma micro samples. This method can be easily implemented along with Bu measurements during routine monitoring without requiring additional sample volume using the same analytical platform. We believe that this strategy represents an efficient tool for the evaluation of metabolite distribution in patients receiving higher doses of Bu.
Material and methods Samples collection
Clinical samples were obtained from patients who underwent hematopoietic stem cell transplantation in the Department of
Pediatric Hematology and Oncology of the University Child-ren’s Hospital, Geneva, Switzerland (n03) and in the Depart-ment of Pediatrics of CHU Sainte Justine, Montreal, Canada (n056). The protocol was approved by the local hospital ethics committee, and each patient/parent signed a consent form.
These samples were collected for routine therapeutic drug monitoring of Bu, as explained elsewhere [14], under an ongoing European Group for Bone Marrow Transplant Bu polymorphism study. The study was conducted accord-ing to the revised Declarations of Helsinki, the standards of Good Clinical Practice, and the Swiss regulatory require-ments. The blank plasma used for calibration and validation was composed of Bu and Su-free pooled plasma provided by the University Hospital of Geneva.
Chemicals and reagents
Reference Su (>99.5 % pure), Bu, and 2,3,5,6-Tetrafluorothio-phenol (TFTP) were purchased from Sigma-Aldrich (Stein-heim, Germany). Su-d8 (99 % atoms deuterated Su) was obtained from ARMAR Chemicals (Döttingen, Switzerland), and Bu-d8 was provided by Toronto Research Chemicals Inc. (Toronto, Canada). These reference materials were stored at room temperature. Ethyl acetate and acetonitrile (HPLC grade) were obtained from Merck (Darmstadt, Germany). Isopropa-nol (>99.5 % pure) solvent, dried over molecular sieves, was obtained from Fluka (Buchs, Switzerland).
Stock solutions of Su and Su-d8 were prepared by weigh-ing 10 mg (correspondweigh-ing to 8 μL) of pure substances into 10 mL of Milli-Q water. As both Su and Su-d8 are solids at room temperature (melting point, 27.5 °C), small fragments of reference materials were thawed by heating at 35 °C. Working standard solutions [0.1 and 1μg/mL for Su, 10 μg/mL for Su-d8 as the internal standard (IS1)] were prepared by dilution in Milli-Q water. Stock and working standard solutions were freshly prepared when needed. A stock solution of Bu was prepared by weighing 10 mg of pure substance in 10 mL of acetonitrile. A stock solution of Bu-d8 was prepared by add-ing 1 mL of acetonitrile into the original flask containadd-ing 2.5 mg of pure substance. Working standard solutions [1 and 10 μg/mL for Bu, 2.5 μg/mL for Bu-d8 (IS2)] were then prepared in Milli-Q water. Stock and working standard solu-tions were stored at−20 °C.
Preparation of calibrators
Working standard solutions were used to spike drug-free plas-ma to reach the concentrations of interest. Calibration samples were prepared by adding the corresponding volume of ade-quate standard solution in 100 μL of blank plasma. Final concentrations of 500 ng/mL for Su-d8 (IS1) and 250 ng/mL for Bu-d8 (IS2) were achieved by adding 5 and 10μL of the corresponding working standard solutions, respectively.
Sample pretreatment
After spiking with ISs and adding 50μL of 1 M NaOH, 100μL of plasma was extracted with 500 μL of ethyl acetate by horizontal shaking (20 moves/s) for 5 min. After centrifu-gation (14,800 rpm, 1 min), the organic layer was removed. A 100-μL aliquot was separated for Bu quantitation. A 50-μL aliquot of isopropanol was added to the remaining 400μL, and the ethyl acetate was evaporated under a gentle flow of nitrogen at room temperature for approximately 10 min. A 1-μL aliquot of the remaining 50-1-μL isopropanolic residue was injected into the GC–MS/MS system.
The 100-μL remaining aliquot for Bu quantitation was treated as described by Quernin et al., with the following alterations [15]. Briefly, 100μL of Milli-Q water, 25 μL of 1 M NaOH, and 10μL of pure TFTP were added to the 100-μL organic phase. After mixing, the derivatization was achieved by heating at 60 °C for 30 min. After cooling, 200μL of ethyl acetate was added to the mixture for back extraction by strong horizontal shaking (20 moves/s). After centrifugation, the organic layer was evaporated to dryness under a gentle stream of nitrogen at room temperature. The residue was reconstituted in 50 μL of ethyl acetate, and 1 μL was injected into the GC–MS/MS system. The overall extraction procedure is summarized in the Electronic supplementary material (ESM) Fig.1.
GC–MS/MS analysis
Analyses were performed on a Varian CP 3800 gas chro-matograph (Walnut Creek, USA), equipped with a Varian CP-8400 autosampler and a Varian 300-MS triple quadru-pole mass spectrometer. Data acquisition and analysis were performed through the Varian MS workstation soft-ware (version 6.9.3). Chromatographic separation was made on a Zebron fused-silica capillary column (ZB-5 MS, 15 m×0.25 mm i.d., film thickness 0.25 μm, with a 10-m inert guard column) from Phenomenex (Torrance, USA). High-purity helium 50 (99.999 %) was used as the carrier gas with a constant flow of 1 mL/min. The injector temperature was set to 250 °C, and the injection was made in splitless mode, with the injection purge valve remaining closed for 1 min.
For Su quantitation, the initial oven temperature was set to 60 °C and held for 0.1 min. It was then increased to 82 °C at 70 °C/min and held for 1 min, increased to 105 °C at 70 °C/min and held for 0.5 min, increased to 280 °C at 70 °C/min, and finally maintained for 0.26 min. For Bu quantitation, the initial oven temperature was set to 60 °C and held for 0.5 min. It was increased to 200 °C at 70 °C/min and then to 280 °C at 50 °C/min. The final temperature was maintained for 0.90 min. Both GC runs lasted 5 min only. The transfer line, manifold, and ion source were heated at 275, 40, and
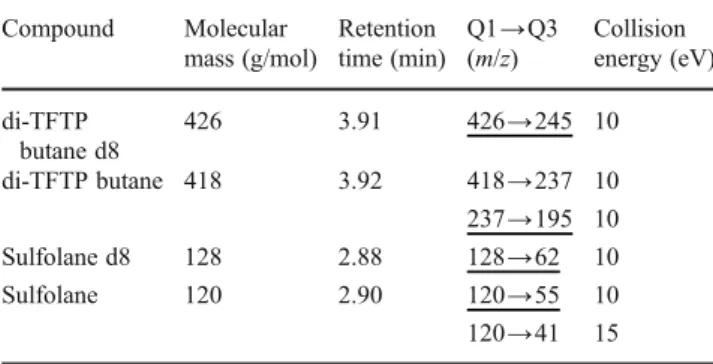
200 °C, respectively. Ionization was achieved in electronic impact mode (EI) at 70 eV. The MS/MS experiments were based on collisionally induced dissociation, which occurred in the collision cell with an argon pressure of 1.5 mTorr. Two selected reaction monitoring transitions were consid-ered for each analyte (Table 1). They were chosen accord-ing to their selectivity and sensitivity.
Validation procedure
The method was validated according to the European Med-icines Agency guidelines [16]. The validation was carried out over three nonconsecutive days (p03). A statistical treatment of the results, based on variance analysis, allowed a determination of the precision and trueness of the method for the selected concentration levels.
A validation day consisted of independently preparing calibrators and quality control samples (QC) with both analytes spiked in the same sample. Calibrators were pre-pared in duplicate (n02) at five concentrations levels, i.e., 20, 50, 100, 200, and 500 ng/mL for Su and 50, 200, 500, 1,000, and 2,000 ng/mL for Bu. These samples allowed the determination of the response functions of both analytes, calculated with the analyte to internal standard ratios. The calibration range was chosen according to the concentra-tions observed in a patient’s samples during the pre-validation step. The QC samples were prepared indepen-dently in quadruplicate (n04) at four concentration levels, i.e., 20, 40, 100, and 400 ng/mL for Su and 100, 200, 500, and 2,000 ng/mL for Bu.
The spiked samples were then treated as described earlier. The validation procedure permitted the determination of trueness, precision, linearity, and the limits of quantification. The lower limit of quantification (LLOQ) was determined as the lowest QC concentration with trueness and precision under ±20 %. The overall extraction recovery of Su was evaluated by comparison of the extracted samples with a non-extracted isopropanolic solution.
Table 1 MS/MS method parameters for busulfan and sulfolane Compound Molecular mass (g/mol) Retention time (min) Q1→Q3 (m/z) Collision energy (eV) di-TFTP butane d8 426 3.91 426→245 10 di-TFTP butane 418 3.92 418→237 10 237→195 10 Sulfolane d8 128 2.88 128→62 10 Sulfolane 120 2.90 120→55 10 120→41 15 Quantitative transitions are underlined; the others were used for identification
Recovery and stability tests
The stability of Bu in frozen plasma has already been investigated, and no further experiments were performed in this study [17]. The extraction procedure was also taken from the literature and was not re-evaluated [15]. The short-term stability of Su in plasma was evaluated at 100 and 400 ng/mL levels. These samples were analyzed in triplicate on the day 0, and aliquots were stored at−20 °C. They were then analyzed after 7, 14, 21 (n01), and 90 days (n03). The extraction recovery of Su was evaluated by comparing the Su peak areas of the extracted spiked plasma (n06) with a corresponding isopropanolic solution injected six times.
Results and discussion
Two difficulties had to be overcome in the development of a quantitative analytical method for Su along with Bu in pedi-atric plasma samples. First, Bu is not volatile enough for gas chromatography. Several derivatization protocols have been proposed to avoid this incompatibility [15,18–20], and liquid chromatography methods coupled to mass spectrometry are common [21,22]. However, the objective of this study was to quantify the Su in the patients’ single plasma sample along with Bu, which seemed to be more feasible by GC due to the nature of Su. The Bu extraction and derivatization procedure described by Quernin et al. was chosen and adapted for this purpose [15].
The physical properties of Su were also problematic for sample preparation. Evaporation to dryness of the working standard solutions or extracts followed in conventional pro-cedures could not be performed. Indeed, incoherent peak areas or even complete disappearance of Su was observed during the pre-validation step after evaporation of the meth-anolic standard solutions and extracts to dryness using ni-trogen or evaporating under vacuum. This was probably due to the partial or complete evaporation or sublimation of Su
occurring after solvent elimination at room temperature. This problem was solved by spiking the plasma sample directly with aqueous solutions of Su and Su-d8, and adding isopropanol in the ethyl acetate extract before evaporation. Isopropanol is fully miscible in ethyl acetate in the used proportions and has a lower volatility. This property allows for better control of the evaporation of the extracts. Moreover, isopropanol was found to be a suitable solvent for GC. The extraction recovery was estimated to be 93 % (n06, 6 % RSD).
The second difficulty was the small amount sample ma-terial because Bu derivatization step seemed to be incompat-ible with Su analysis. Indeed, no Su peak could be detected after Bu derivatization of the spiked plasma. Thus, two separated sample preparations had to be investigated, pref-erably from a single plasma sample of reasonable volume. Nevertheless, concentrations found in real clinical samples during the pre-validation step were sufficiently high to suit the instrument sensitivity without extensive pre-concentration. Therefore, a volume of 100 μL of plasma, split into two fractions after the addition of organic solvent, was found to be a good compromise between the sensitivity needs and the scarcity of available sample.
GC–MS/MS analysis of busulfan and sulfolane
Two MS/MS transitions were investigated for Su, although its nominal mass was small (120 u). As illustrated in Fig.1a, the EI of Su showed predominant fragment ions of mass to charge ratio (m/z) of 41, 56, and 28, corresponding to the loss of SO2 and fragmentation of the (CH2)4 chain. The
molecular ion (m/z 120) was abundant enough (28 %) to be selected as the precursor ion for two MS/MS transitions, which avoided the selection of very low mass fragments. This produced better selectivity and a substantial increase in the sensitivity of the method. In the case of Bu converted to di-TFTP butane, the molecular ion (m/z 418) was also abundant enough (34 %) to develop one MS/MS identifica-tion transiidentifica-tion (Fig.1b). The most abundant fragment (m/z
Fig. 1 Mass spectra of sulfolane (a) and busulfan derivatized to 1,4-TFTP-butane (b) after electron impact ionization. X-axis represents mass to charge ratio (m/z), and y-axis represents relative abundance in percentage and is related to the number of times an ion of a specific m/z ratio strikes the detector
237), corresponding to the loss of one TFTP group, was selected as the precursor ion for a quantitative transition.
Validation
During the pre-validation step, it was determined that a 1/X2 and 1/X weighted linear regression models were the most suitable for Su and Bu, respectively, giving the most repre-sentative response function. Validation data are summarized in Table2.
Selectivity and carryover
Selectivity was evaluated by injecting five different blank plasma samples, including the pooled plasma and patients’ plasma prior to infusion of Bu, to check the absence of an interfering peak at the retention times of interest. Figure2a, e
shows the typical chromatograms of extracted blank plasma, demonstrating the absence of interferences for Bu and Su transitions. Figure2b, fshows chromatograms for blank plas-ma spiked with Bu (200 ng/mL) and Su (20 ng/mL). No
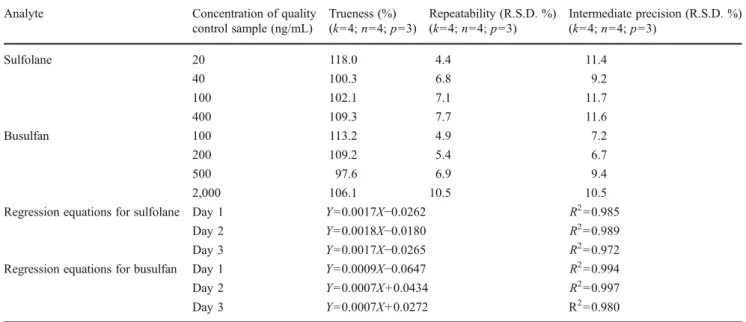
Table 2 Validation summary of quantification method for sulfolane Analyte Concentration of quality
control sample (ng/mL) Trueness (%) (k04; n04; p03) Repeatability (R.S.D. %) (k04; n04; p03) Intermediate precision (R.S.D. %) (k04; n04; p03) Sulfolane 20 118.0 4.4 11.4 40 100.3 6.8 9.2 100 102.1 7.1 11.7 400 109.3 7.7 11.6 Busulfan 100 113.2 4.9 7.2 200 109.2 5.4 6.7 500 97.6 6.9 9.4 2,000 106.1 10.5 10.5
Regression equations for sulfolane Day 1 Y00.0017X−0.0262 R200.985
Day 2 Y00.0018X−0.0180 R200.989
Day 3 Y00.0017X−0.0265 R200.972
Regression equations for busulfan Day 1 Y00.0009X−0.0647 R200.994
Day 2 Y00.0007X+0.0434 R200.997
Day 3 Y00.0007X+0.0272 R200.980
k is the number of concentration levels, n is the number of repetitions by level, and p is the number of nonconsecutive days. The regression equations used for calculations of Su after 1/X2 weighting for each of the 3 days generated with calibrator samples run in duplicates at five concentration levels (20, 50, 100, 200, and 500 ng/mL). Regression equations for Bu were 1/X weighted generated with calibrator samples run in duplicates at five concentration levels (50, 200, 500, 1,000, and 2,000 ng/mL). The measured concentration values at each quality control concentration level include mean±SD of values injected in quadruplicates on each of the three validation days. This validation was performed using the same plasma sample in which both Bu and Su were spiked for quantification by separate chromatography runs. Repeatability represents the intra-day variability, whereas intermediate precision represents inter-day variability
Fig. 2 Typical current ion chromatograms with the sulfolane GC–MS/MS method (green) and busulfan GC–MS/ MS method (red), showing injections of extracted blank plasma (a, e), extracted spiked blank plasma (b, f), and isopropanol (c, g). d An injection of a 10-μg/mL deriv-atized busulfan solution
interfering peak was observed in the transitions of Su when injecting highly concentrated (10μg/mL) derivatized Bu, as shown in Fig. 2d. Carryover was also investigated by injected isopropanol after four injections of the highest QC. The chromatograms showed no peaks for both analytes (Fig.2c, g).
Linearity, trueness, precision, and lower limit of quantification
Linearity was calculated by fitting the back-calculated centrations of the QCs as a function of the introduced con-centrations and by applying the linear regression model
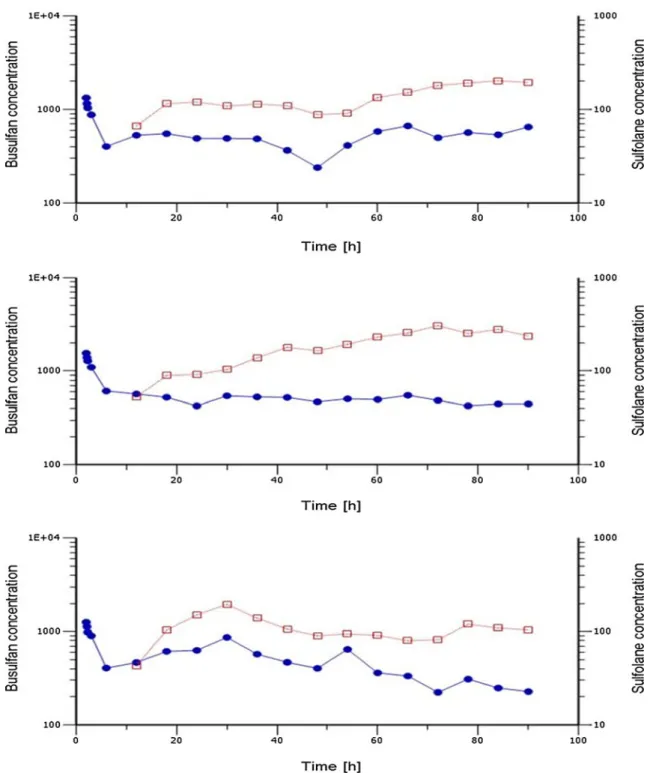
Fig. 3 Time vs. plasma concentration profiles of sulfolane and busul-fan measured in three different individuals. The sulfolane (red squares) and busulfan (blue circles) levels were measured at 0, 15, 30 min, 1, 4 h after the first dose and 4 h after each dose infusion up to the 15th dose. Sulfolane levels were detected at 4 h after the first dose infusion,
but were below the quantifiable levels, hence not included in the graph. X-axis represents time in hours, and y1-axis represents busulfan con-centration in nanograms per milliliter, y2-axis represents sulfolane concentration in nanograms per milliliter. Both y1 (left) and y2 (right) axes were in logarithmic scale
based on the least-squares method. The regression equa-tions for used both analytes and the coefficient of deter-minations (R2) are given in Table 2. The trueness and precision were determined for each analyte by injecting independent QC samples at different concentration levels and by calculation of the difference between measured and theoretical concentrations.
For Su, the trueness at 20 ng/mL (lowest QC) was found to be 118.0 % (<±20 %) and in the range of 100.3–109.3 % for the other QCs (<±15 %; Table2). For Bu, the trueness was found to be 113.2 % (<±15 %) at the lowest QC level and in the range of 97.6–109.2 % for the other levels (<±10 %). Precision values were assessed by calculating the relative standard deviations (RSD). The intra-day var-iability was expressed as repeatability and inter-day vari-ability was expressed as the intermediate precision. These values were less than ±15 % (acceptable levels) for all the concentrations tested (Table2). The lowest QC concentra-tion level for Su (20 ng/mL) and Bu (100 ng/mL) has trueness and precision less than ±20 %, and hence defined as the LLOQ. These LLOQ values were fully adequate to quantify both analytes in patients’ plasma receiving high doses of Bu. All the calibrator samples had trueness and precision profiles <±15 %. Validation parameters for Bu quan-tification were in accordance with previously described litera-ture [15, 19–22]. To our knowledge, no method for quantitation of Su in patients’ plasma had been published before, and no comparison could be made.
Stability of sulfolane in plasma samples and extracts
We explored short-term stability at room temperature and −20 °C. Extracts were found to be stable for more than 12 h at room temperature (data not shown). This is much longer than typical analysis sequence duration. Moreover, no sig-nificant decrease in Su concentration was observed after 90 days at−20 °C (See ESM Fig.2).
System stability
The analysis of a large number of samples allowed us to check the stability of the analytical system (ESM Fig. 3). The variation of area of the IS1 over 79 successive injections is relatively high (25 % RSD), partly due to the variation in the volume of organic layer removed from the extraction tube and to the variation of the final volume after evaporation of the ethyl acetate fraction, leading to disparity in concentration factors over the samples. How-ever, no significant difference (t test) was observed be-tween the means of the first and the last ten injections, indicating good robustness of the analytical method. Hence, this method showed to be suitable for large-scale clinical studies.
Application to clinical studies
Figure3shows the concentration–time profiles of Su and Bu in
three children receiving intravenous Bu (0.8 mg/kg) over a 2-h period in a conventional 16-dose protocol [14]. The Bu concentrations presented a typical pattern, with a rapid increase and decrease of plasmatic concentrations corresponding to the first dose intravenous infusion. Bu levels were relatively stable in individuals measured at 4 h (trough level) after each dose infusion up to the 15th dose. The Su concentrations showed an interesting profile. A constant increase in plasma concentra-tions over the doses was observed. Sulfolane was not detectable until the end of the 4 h following the first dose infusion, but it was readily quantifiable after the second dose infusion. Using large volumes of injections might have improved the sensitivity of the method and allowed for an earlier detection of Su. However, this was found to be unnecessary for this study as the concentrations rapidly reached quantifiable levels in all three patients. Based on these preliminary observations, three time points were chosen (4 h after dose 1, 4 h after dose 6, and 0 min after dose 9 infusion) to measure the Su levels in a large number of patients. The levels of Su and Bu from these samples at 4 h after dose 6 and 0 min after dose 9 infusions are presented in Table3. Su was detectable at 4 h after dose 1, but its levels were around the LLOQ (20 ng/mL), and may not have any analytical or clinical significance, hence were not discussed here. Higher levels of Su were observed after dose 9 infusion. All the plasma samples used for analysis were stored for more than 6 months (up to 3 years) at−80 °C. We also observed interindividual variability in the levels of both Bu and Su. Thus, by using this method, one can investigate the role of Su in determining adverse events and drug interactions during Bu treatment using plasma samples collected for routine Bu mon-itoring and during clinical studies.
Conclusion
This novel method presented in this article allowed the determination of Su in plasma micro samples. Validation
Table 3 Sulfolane and busulfan levels measured in real patient samples Sample Sulfolane (ng/mL) Busulfan (ng/mL) Before dose 7 infusion
(n056) 181.9±80.9 (179.1) 393.4±184.8 (365.7) End of dose 9 infusion
(n054)
249.9±123.4 (239.9) 1262.5±538.5 (1196.3)
All values are mentioned as mean±SD (median). The plasma levels of Su measured at 4 h after the first dose may not represent exact quantifiable levels since the lower limit of quantification is 20 ng/ mL, and the values were around 20 ng/mL and are not mentioned (n046) here due to the lack of analytical and clinical significance, but Su can be detected 4 h after starting busulfan first dose infusion
data showed a satisfactory degree of sensitivity, trueness, and precision. The extraction procedure for Su is fast and simple, and can easily be included in the routine analysis of Bu as no extra volume of plasma is required. Clinical studies may adopt this method for investigating the Bu metabolic fate and its mechanisms of toxicity. The method described here may be used for understanding the kinetics of Su in subjects receiving Bu infusion and its role in the adverse effects and drug interactions seen with Bu therapy.
Acknowledgments We are thankful to the patients and their parents who consented to participate to this study. This study was supported by the grants of the CANSEARCH Foundation, The Hans Wilsdorf, the Télémaque Foundations, and the Geneva Cancer League.
Conflicts of interest The authors declare no competing financial interests.
References
1. Fry TJ (2010) Pediatr Blood Cancer 55:1043–1044
2. Schattenberg AV, Levenga TH (2006) Curr Opin Oncol 18:667–670 3. Krivoy N, Hoffer E, Lurie Y, Bentur Y, Rowe JM (2008) Curr
Drug Saf 3:60–66
4. Bartelink IH, Bredius RG, Belitser SV, Suttorp MM, Bierings M, Knibbe CA, Egeler M, Lankester AC, Egberts AC, Zwaveling J, Boelens JJ (2009) Biol Blood Marrow Transplant 15:231–241 5. Zwaveling J, Bredius RG, Cremers SC, Ball LM, Lankester AC,
Teepe-Twiss IM, Egeler RM, den Hartigh J, Vossen JM (2005) Bone Marrow Transplant 35:17–23
6. Czerwinski M, Gibbs JP, Slattery JT (1996) Drug Metab Dispos 24:1015–1019
7. Cooper AJ, Younis IR, Niatsetskaya ZV, Krasnikov BF, Pinto JT, Petros WP, Callery PS (2008) Drug Metab Dispos 36:1546–1552 8. Roberts JJ, Warwick GP (1961) Biochem Pharmacol 6:205–216 9. Marchand DH, bdel-Monem MM (1985) Biochem Biophys Res
Commun 128:360–367
10. Hassan M, Oberg G, Ehrsson H, Ehrnebo M, Wallin I, Smedmyr B, Totterman T, Eksborg S, Simonsson B (1989) Eur J Clin Pharmacol 36:525–530
11. Ritter CA, Bohnenstengel F, Hofmann U, Kroemer HK, Sperker B (1999) J Chromatogr B: Biomed Sci Appl 730:25–31
12. Gibbs JP, Murray G, Risler L, Chien JY, Dev R, Slattery JT (1997) Cancer Res 57:5509–5516
13. Headley JV, Peru KM, Dickson LC (1999) J Chromatogr A 859:69–75
14. Ansari M, Lauzon-Joset JF, Vachon MF, Duval M, Theoret Y, Champagne MA, Krajinovic M (2010) Bone Marrow Transplant 45:261–267
15. Quernin MH, Poonkuzhali B, Montes C, Krishnamoorthy R, Dennison D, Srivastava A, Vilmer E, Chandy M, Jacqz-Aigrain E (1998) J Chromatogr B: Biomed Sci Appl 709:47–56
16. European Medicines Agency (EMEA). Draft guidelines on valida-tion of bioanalytical methods (2012) http://www.ema.europa.eu/ docs/en_GB/document_library/Scientific_guideline/2011/08/ WC500109686.pdf. Accessed 6 Feb 2012.
17. Balasubramanian P, Srivastava A, Chandy M (2001) Clin Chem 47:766–768
18. Ehrsson H, Hassan M (1983) J Pharm Sci 72:1203–1205 19. Vassal G, Gouyette A, Hartmann O, Pico JL, Lemerle J (1989)
Cancer Chemother Pharmacol 24:386–390
20. Embree L, Burns RB, Heggie JR, Phillips GL, Reece DE, Spinelli JJ, Hartley DO, Hudon NJ, Goldie JH (1993) Cancer Chemother Pharmacol 32:137–142
21. Stokvis E, Rosing H, Beijnen JH (2005) Mass Spectrom Rev 24:887–917
22. Ansari M, Uppugunduri CR, Deglon J, Theoret Y, Versace F, Gumy-Pause F, Ozsahin H, Dayer P, Desmules J, Daali Y (2012) Rapid Commun Mass Spectrom 26:1437–1446
![Figure 3 shows the concentration–time profiles of Su and Bu in three children receiving intravenous Bu (0.8 mg/kg) over a 2-h period in a conventional 16-dose protocol [14]](https://thumb-eu.123doks.com/thumbv2/123doknet/14835982.622308/7.892.458.818.106.214/figure-concentration-profiles-children-receiving-intravenous-conventional-protocol.webp)
