HAL Id: hal-00304933
https://hal.archives-ouvertes.fr/hal-00304933
Submitted on 1 Jan 2004HAL is a multi-disciplinary open access archive for the deposit and dissemination of sci-entific research documents, whether they are pub-lished or not. The documents may come from teaching and research institutions in France or abroad, or from public or private research centers.
L’archive ouverte pluridisciplinaire HAL, est destinée au dépôt et à la diffusion de documents scientifiques de niveau recherche, publiés ou non, émanant des établissements d’enseignement et de recherche français ou étrangers, des laboratoires publics ou privés.
water chemistry in mid-Wales
L. Ness, C. Neal, T. D. Davies, B. Reynolds
To cite this version:
L. Ness, C. Neal, T. D. Davies, B. Reynolds. Impacts of the North Atlantic Oscillation on stream water chemistry in mid-Wales. Hydrology and Earth System Sciences Discussions, European Geosciences Union, 2004, 8 (3), pp.409-421. �hal-00304933�
Impacts of the North Atlantic Oscillation on stream water
chemistry in mid-Wales
L. Ness
1, C. Neal
2, T.D. Davies
1and B. Reynolds
31School of Environmental Sciences, University of East Anglia, Norwich, NR4 7TJ, UK
2Centre for Ecology and Hydrology, Maclean Building, Crowmarsh Gifford, Wallingford, Oxon, OX10 8BB, UK 3Centre for Ecology and Hydrology, Bangor Research Unit, UWB, Deiniol Road, Bangor, Gwynedd, LL57 2UP, UK
Email for corresponding author: [email protected]
Abstract
Analysis of winter stream chemistry data from the Afon Hafren in mid-Wales reveals links between stream chemistry and the North Atlantic Oscillation (NAO). K, Y, Al and dissolved organic carbon (DOC) concentrations increase during high NAO index months (relatively warm and wet weather), while Ca, Mg and NO3 concentrations increase during low NAO months (relatively cold and dry conditions) with the increased concentrations lasting into the next month. The cause of the concentration changes varies between constituents: Y, Al and DOC are impacted by short term variations in rainfall; Mg and Ca are influenced by flow conditions; and NO3 is temperature controlled. The dominant control mechanism for K concentration seems to be related to rainfall after tree felling has taken place but, prior to felling, the relationships are less certain.
Keywords: nitrate, potassium, yttrium, aluminium, Dissolved Organic Carbon, magnesium, calcium, North Atlantic Oscillation, stream
chemistry, Plynlimon, Hafren
Introduction
Many of the varied mechanisms controlling stream chemistry are influenced by climatic conditions affecting either catchment inputs or within-catchment processes (Monteith et al., 2000; Neal et al., 2001). Variations in the climate of the North Atlantic can be characterised through the use of the North Atlantic Oscillation (NAO) index which is the difference in sea-level atmospheric pressure between the Icelandic low and Azores high pressure systems. The pressure difference influences the climatic conditions experienced across north-western Europe, especially during the winter months. A positive NAO index in the winter translates to relatively warm and wet conditions as Atlantic frontal systems are driven across the region. Correspondingly, negative NAO winters are cold, dry and dominated by air flow from the north-east (Hurrell, 1995). Changes in the strength of the prevailing wind conditions can cause variations in the total atmospheric deposition of sea-salts, affecting fresh water chemistry (Evans et al., 2001) and associated variations in temperature have been linked
to changes in stream NO3 concentrations (Monteith et al.,
2000). Recently, the NAO index has been showing a trend towards the positive phase, which may be due partly to increasing atmospheric greenhouse gas concentrations (Gillett et al., 2003), and may well continue into the future. The change in winter conditions and increased frequency of extremes may lead to greater variability in stream chemistry and impact stream ecosystem function (Bradley and Ormerod, 2001). However, these changes will be predictable only if the characters of the impacts of the different aspects of the NAO are understood.
This study investigates the links between streamwater NO3
concentrations at Plynlimon, mid-Wales, and the NAO. Previous work at this site has considered only the responses of stream NO3 concentrations in the moorland areas over
the December-March time period. The analysis has now been extended to consider the responses of K, Y, Al, DOC, Ca and Mg concentrations to the NAO in both the moorland and the forested part of the catchment on a monthly timescale. The Afon Hafren water quality data set used here
is one of the longest series of its kind in the UK, with ongoing data being collected since 1983 (Neal et al., 1997, 2001).
Study area and methods
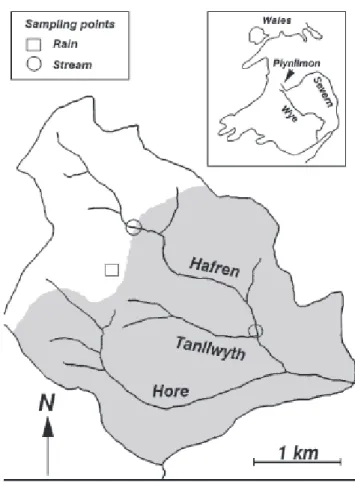
The Afon Hafren, one of the main tributaries of the River Severn, is located on the south-eastern slopes of Plynlimon in mid-Wales, about 30 km inland from the Irish Sea. The stream drains a catchment of 347 ha, spanning an altitude range of 350-690 m (Neal et al., 2004). The catchments bedrock consists of lower Palaeozoic mudstones, greywackes, sandstones and grits while the soils in the catchment are thin (around 70 cm deep) and acidic, consisting of mainly stagnopodzols, peats, brown earths and gleys, apart from on the mountain-top plateau where deep peat predominates. The vegetation within the catchment changes from semi-natural acidic moorland near the streams source to Sitka spruce plantation forestry further down the catchment. The forest was planted between 1937 and 1964 and remained intact until the late 1980s when phased harvesting began.
Air temperature in the catchment (measured at the Moel Cynnedd meteorological station at 350 m altitude until 1999) ranged from 13.7oC to 30.7oC over the period 19831999,
with a mean daily minimum of 4.0oC and a mean daily
maximum of 11.3oC. The catchment receives around
2500 mm of rainfall per year and losses through evapotranspiration are 500-700 mm per year. The stream flow is flashy, responding rapidly to rainfall inputs. Streamwater chemistry has been shown to vary with the proportion of waters from soil and groundwater sources entering the stream (Neal et al., 1990; Foster et al., 2001). The hydrochemistry of the Afon Hafren has been studied since May 1983, with weekly instantaneous grab sampling of the stream just upstream from the confluence with the Afon Hore (Lower Hafren site). In July 1990, further grab sampling was started at a site about 200 m above the upper edge of the forest (Upper Hafren site). Rainfall has been sampled weekly since May 1983 using two continuously open bulk collectors which are located at 570 m in the Hafren catchment (Fig.1) and at 390 m in the neighbouring Gwy catchment, 3 km away (Kirby et al., 1991). The stream and rainwater samples were analysed in the same manner for a wide range of chemical constituents including NO3, K, Y,
Al, DOC, Ca and Mg (Neal et al., 1997; Wilkinson et al., 1997). After an initial trial period, the rainfall samples from different altitudes were combined and analysed together as their chemical concentrations were very similar (Wilkinson
et al., 1997).
Using monthly NAO indices (http://www.cru.uea.ac.uk/ cru/data/nao.htm), the mean NAO index was calculated for
the periods December-February, December-March and January-March of each year from 1983-2002 (with the year referring to when the winter season finished). These periods were selected as they cover the time of annual minimum temperature and the part of the year when the NAO index is most clearly defined (Portis et al., 2001). Monthly rainfall totals were obtained from the Carreg Wen meteorological station within the Hafren catchment. Mean monthly temperature data were available from RAF Valley (located 100km away on Anglesey) and the CRU TS 2.0 temperature series (Mitchell et al., 2003). The first of these was site-specific and the second a regional generalisation (on a 0.5o
grid). However, the data sets were highly correlated with one another (Pearson correlation, r2 = 0.979, p < 0.01) so
the CRU TS 2.0 data were selected because this study was trying to link general climate patterns to local stream events. Monthly and DecemberFebruary, DecemberMarch and JanuaryMarch mean stream and rain concentrations were calculated for each chemical constituent. The corresponding atmospheric deposition totals were calculated using bulk rainfall concentration data and meteorological station rainfall totals.
Non-parametric (Spearman) correlation analysis was used
to determine if there was a significant relationship between the monthly mean streamwater concentrations of different species, monthly mean air temperature, monthly rainfall total and monthly NAO index for each winter month between December 1983 and March 2002. The same analysis was used for the December-February, December-March and January-March mean concentrations and indices. If the stream concentrations of any constituent showed a trend of increasing/decreasing concentration over time, regression analysis was used to test its significance. If the trend was significant at the p < 0.05 level, a correlation analysis was done
(i) between the concentrations and the NAO for the period the trend was occurring;
(ii) between the residuals from the regression and the NAO indices.
Results and discussion
The individual monthly NAO indices were highly significantly correlated with the corresponding months rainfall total and mean monthly temperature for the CRU TS 2.0 grid square covering Plynlimon (Spearmans Rank correlation, r2 = 0.631 and 0.546, respectively, p < 0.01 for
both).
NITRATE
Monthly mean NO3 concentrations in the Upper Hafren
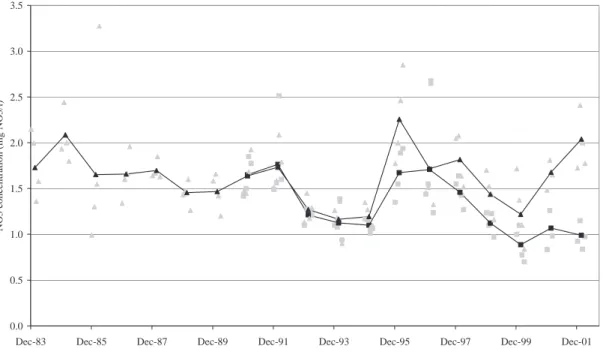
ranged from 0.70 to 2.67 mg NO3 l1 between 1990 and 2002
(Fig. 2). Over this time, the mean stream concentrations declined slightly (linear regression: r2 = 0.344, p < 0.05 for
December-March concentrations, also commented on by Neal et al., 2001). The period of elevated concentrations in the winter of 1996 was also observed at several other UK locations (Evans and Monteith, 2001). The total rainfall in each winter month was significantly inversely related to the mean stream NO3 concentration (Table 1) but NO3
concentrations were not related significantly to either the temperature or NAO index of the same month. However, if a lag time of a month was introduced, a significant link between the NO3 concentration of one month and the total
rainfall, mean temperature and NAO index of the previous month became apparent.
Decreases in atmospheric deposition totals could be the cause of the long-term decline in NO3 concentrations in the
Upper Hafren. Small declines in NO3 deposition have been
observed in some European locations, but in many places these are not statistically significant due to noise in the signal (Wright et al., 2001). However, Irwin et al. (2002) observed an average annual decrease in rainfall NO3
concentration of 0.1% between 1986 and 1999 at Plynlimon, while Reynolds et al. (1999) found a small decrease in wet deposited NO3-N between 1984 and 1995 over Wales. From
0.0 0.5 1.0 1.5 2.0 2.5 3.0 3.5
Dec-83 Dec-85 Dec-87 Dec-89 Dec-91 Dec-93 Dec-95 Dec-97 Dec-99 Dec-01
NO 3 conce n tr ation ( m g NO 3/ l)
Fig. 2. NO3 concentrations in the Upper and Lower Hafren. Individual points show the mean concentrations for December, January, February
and March in each year while the lines represent the mean December-March concentrations for each year. The Upper Hafren concentrations are represented by squares, the Lower Hafren values by triangles.
Table 1. Spearmans correlation coefficients (r2) for NO
3 with climatic variables. UH=Upper Hafren, LH=Lower Hafren. Significance
levels: ** = p < 0.01, * = p < 0.05, ns = not significant (p > 0.05).
Independent variable
NO3 concentration Monthly rainfall Mean monthly Monthly NAO Coefficient when dependent variable lags
(mgl-1)total (mm)temperature (oC)index the independent variable by a month
Monthly Mean monthly Monthly rainfall total temperature NAO
(mm)(oC)index UH -0.414 ** ns ns -0.473 ** -0.380 * -0.391 ** LH -0.265 * -0.288 * -0.272 * -0.494 ** ns -0.509 ** LH 1984-1993 ns ns ns -0.512 ** -0.339 * -0.410 * LH 1994-2002 ns ns -0.373 * -0.462 ** ns -0.624 ** -6 -4 -2 0 2 4 6
Jan-84 Jan-85 Jan-86 Jan-87 Jan-88 Jan-89 Jan-90 Jan-91 Jan-92 Jan-93 Jan-94 Jan-95 Jan-96 Jan-97 Jan-98 Jan-99 Jan-00 Jan-01 Jan-02
NAO
index
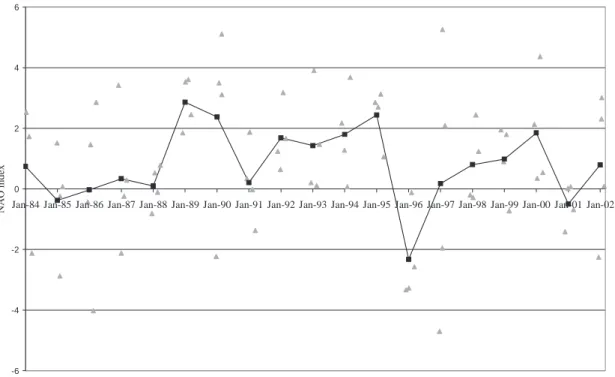
Fig. 3. Winter (December-March) North Atlantic Oscillation Index values 1983-2002. Triangles represent the North Atlantic Oscillation Index
values for the individual winter months; squares represent the December-March mean value.
the bulk rainfall data collected in the Hafren catchment, the annual NO3 deposition declined from over 20 kg ha1yr1 in
early 1990s to around 15 kg ha1yr1 in 2001. However, none
of these estimates took any account of occult or dry deposition other than through the unknown and variable amount of both contained in the wet deposition sampled by open collectors.
Rainfall NO3 concentrations over Plynlimon were affected
significantly by the NAO, with high NO3 concentrations
occurring in low NAO index months when there was an increased probability of air flow from Europe. However, NO3 wet deposition totals were not significantly related to
the NAO index in any way. The residuals of the regression of monthly Upper Hafren NO3 concentration were
significantly negatively correlated with the NAO of the previous month (Spearmans Rank correlation, r2 = 0.513,
p < 0.01, compared to r2 = -0.391, p < 0.01 for measured
stream NO3 concentrations). The pattern of NO3
concentration change seen in the Upper Hafren seems, therefore, to represent a general decline in stream NO3
concentrations over time with climatically influenced NO3
changes superimposed.
Over the study period, 1996 was the first negative NAO winter since 1985 (Fig. 3) and the most negative NAO year
since the 1820s. This winter had very high stream NO3
concentrations, probably caused by the extreme climate conditions (the mean minimum and maximum air temperatures recorded at the Moel Cynnedd meteorological station for winter 1996 were 0.94oC and 4.16oC, with an
absolute minimum of 10.4oC whereas the mean minimum
and maximum air temperatures for all the winters 1983 1998 were 0.42oC and 5.91oC, with only eight days overall
recording lower temperatures than the minimum seen in 1996). High stream NO3 concentrations in other locations
have been linked to freezing events killing fine plant roots and disrupting microbe, soil and plant interactions. This results in the release of NO3 into the soil, and as uptake by
damaged roots is limited, allows NO3 to be washed into the
streams (Monteith et al., 2000; Fitzhugh et al., 2003). Monteith et al. (2000) reported a strong link between the winter peak NO3 concentration and the December-March
NAO index in the Afon Gwy, another Plynlimon stream, and linked this to temperature. Therefore, as high NO3
concentrations in the Upper Hafren were associated with low NAO events (i.e. cold and dry conditions) this temperature dependent mechanism was probably operating in the Hafrens catchment as well. The present study shows that there are also links between the NAO and stream chemistry on time-scales shorter than the four month period considered by Monteith et al. (2000). A weak negative relationship was seen between the monthly mean NO3
concentration in the Lower Hafren and the NAO index. However, correlations between monthly mean stream NO3
concentrations and monthly NAO indices were stronger in both the Upper and Lower Hafren when a time lag of one month was introduced between the NAO index month and that of the mean concentration (Table 1). For example, the correlation between Upper Hafren NO3 concentration and
the monthly NAO index was not significant with no lag, but became significant at the p < 0.01 level (r2 = 0.391)
when a lag of 1 month was introduced; thecorrelation between Lower Hafren NO3 concentration and the monthly
NAO index increased from r2 = 0.272 (p < 0.05) to r2 = 0.509
(p < 0.01) when the monthly lag was introduced. These time lags could possibly be caused by the various different biological and hydrological processes involved in NO3
transport.
In the Lower Hafren, mean monthly NO3 concentrations
ranged from 0.84 to 3.28 mg NO3 l1 and mainly remained
within the range 12 mg NO3l1 (Fig. 2). Between 1983
and 1994, NO3 concentrations also appeared to decline in
the Lower Hafren (linear regression, r2 = 0.403, p < 0.05 for
December-March mean concentrations). From 1991 to 1993, NO3 concentrations at the two Hafren sites were very similar.
However, by 1994, NO3 concentrations in the Lower Hafren
were beginning to increase above those in the Upper Hafren. The relative increase in NO3 concentrations was due to forest
harvesting between the two measuring stations. In the Hafren Forest, the main felling technique leaves the tree stumps, needles and branches in situ (Neal, 2002a,b). When felling is carried out, biological NO3 demand from the trees is
eliminated and the damaged and decaying vegetation releases NO3, allowing more NO3 to enter streams, with the
effects lasting for a few years (Neal et al., 2001).
The data for the Lower Hafren were split into two periods (19841993 and 19942002) to see whether the relationship between stream NO3 concentrations and the NAO altered
after felling. Between 1984 and 1993, the Lower Hafren NO3 concentrations showed the most significant relationship
with the previous months rainfall and weaker relationships with the previous months NAO index and temperature (Table 1). However, in the period 1994 to 2002, the most significant relationships were with the NAO index and rain of the previous month. Correspondingly, there was no significant relationship with temperature, suggesting that the temperature dependent freezing process may have decreased in importance as the catchment conditions changed. Variations in stream NO3 concentration post-felling
may have been caused by NO3 released from decaying felled
material collecting in the soil until it was washed out by rainfall, so high concentration pulses reached the stream during rainfall following dry months. The NAO may have become a more important factor due to its greater correlation with rainfall than with temperature. Therefore, in the Hafren, it appears that NO3 is significantly affected by the NAO but
the effect can be altered by changes in catchment management.
Over timescales greater than a month, the link between mean NO3 concentration and the NAO index was still
apparent at times. The long lasting effects were visible as the mean January-March concentration in the Lower Hafren post-felling showed no significant correlation with the January-March NAO but was significantly correlated with the December-February NAO for this period (Spearmans Rank correlation r2 = 0.817, p < 0.01).
POTASSIUM
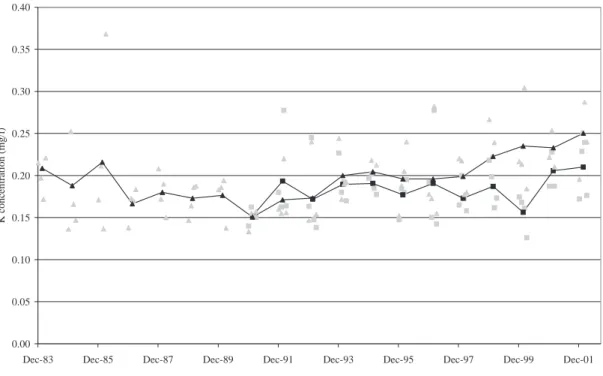
Between 1991 and 2002, mean monthly K concentrations in the Upper Hafren varied between 0.13 and 0.28 mg l1
(Fig. 4). There was no clear trend over time and a majority of the monthly mean concentrations were between 0.15 and 0.20 mg l1. Potassium concentrations in the stream were
only significantly correlated with rainfall totals (Table 2). In the Lower Hafren, K concentrations remained between 0.15 mgl-1 and 0.20 mgl-1 until 1994, when they began to
Fig. 4. K concentrations in the Upper and Lower Hafren. Key as for Fig. 2. 0.00 0.05 0.10 0.15 0.20 0.25 0.30 0.35 0.40
Dec-83 Dec-85 Dec-87 Dec-89 Dec-91 Dec-93 Dec-95 Dec-97 Dec-99 Dec-01
K c o nc en tra tion (mg/ l)
Table 2. Spearmans correlation coefficients (r2) for K with climatic variables. UH=Upper Hafren, LH=Lower Hafren. Significance
levels: ** = p < 0.01, * = p < 0.05, ns = not significant (p > 0.05).
Independent variable
K concentration Monthly rainfall Mean monthly Monthly NAO Coefficient when dependent variable lags (mg l-1)total (mm)temperature (oC)index the independent variable by a month
Monthly Mean monthly Monthly rainfall total temperature NAO
(mm)(oC)index
UH 0.400 ** ns ns ns ns ns
LH 0.292 * ns ns ns ns ns
LH 1983-1992 ns ns ns ns ns ns
LH 1993-2002 0.421 ** ns ns ns ns ns
increase steadily. The increase in stream water K concentration was caused by felling as K is released rapidly into the soil by damaged and decaying vegetation (Neal et
al., 1992). Prior to 1993, K concentration in the Lower
Hafren showed no significant correlation with the NAO index, rainfall totals or temperature but for the period 1993 to 2002, K became significantly correlated with rainfall totals from the same month (Table 2). This again indicated that felling has altered the effect that climate has on stream chemistry variations.
Unlike NO3, total monthly bulk atmospheric deposition
of K over the Hafren catchment was strongly related to the
months NAO index (Spearmans rank correlation, r2 =
0.649, p < 0.01). During high NAO index months, the rainfall totals at Plynlimon were larger and the rain came mainly from airstreams crossing the Atlantic, a significant source of K to the atmosphere. The K concentrations in the Upper Hafren were linked significantly to atmospheric deposition total (Spearmans rank correlation, r2 = 0.399, p
< 0.01). However, stream K concentrations were not significantly linked to the NAO index. In the Lower Hafren, the concentration of K before 1993 showed no significant relationship with bulk deposition or rainfall K concentration, possibly because the ecosystem is K limited (Emmett et al.,
1995) and K is tightly cycled by the plants in the soil-plant system (Hornung et al., 1986). After felling, K concentration in the Lower Hafren showed a positive relationship with both deposition and total rainfall (Spearmans Rank correlation r2 = 0.372, p < 0.05 and r2 = 0.421, p < 0.01) but,
again, not with the NAO index. As rainfall is a major driver of bulk deposition total, the significant correlation between deposition and stream K concentration is probably a result of auto-correlation and it is therefore possible that the link between deposition and stream concentrations at this site is apparent only because rainfall, which is important for deposition totals, washes out the K which is already present in the soil. Elsewhere in the catchment, K concentrations in stream water have increased during storm events as storm flow becomes enriched in K by its passage through the soil organic horizon (Chapman, 1994). Thus:
(i) in the Upper Hafren and after felling in the Lower Hafren (when the availability of K in the soil would be greater than before) such rainwater flushing events are probably occurring;
(ii) the predominant control on K concentrations in stream water appears to be hydrological in nature;
(iii) although variations in K concentration in the Upper and Lower Hafren could not be linked directly to the NAO index, atmospheric circulation is still important as rainfall variations in Europe are linked to NAO changes. The same frost damage mechanism causing NO3 release
from plants has been proposed to have a significant effect
on stream K concentrations (Fitzhugh et al., 2003) but there is little evidence that this occurred at Plynlimon. Hubbard Brook (Boormann and Likens, 1979; Likens and Boormann, 1995) in the north-eastern USA, where the frost mechanism was identified, is mostly second-growth deciduous northern hardwood forest and the region suffers more extreme winter conditions than Plynlimon. The difference in the catchments climate and ecosystems could account for the very different relationships between K and climate in the two locations. This shows that stream chemistry behaviour in one catchment cannot be used easily to predict behaviour in another when there are major differences in catchment characteristics and climate.
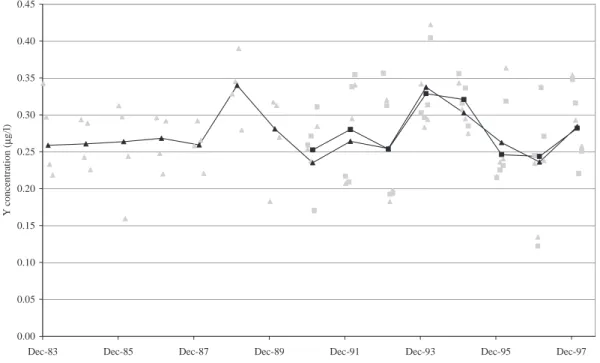
YTTRIUM, ALUMINIUM AND DISSOLVED ORGANIC CARBON
Yttrium, Al and DOC all showed very similar behaviour to each other and at both sampling sites on the Hafren. Yttrium concentrations in the Upper Hafren varied between 0.12 and 0.40 mg l1 from 1990 to 1998. The range of Y
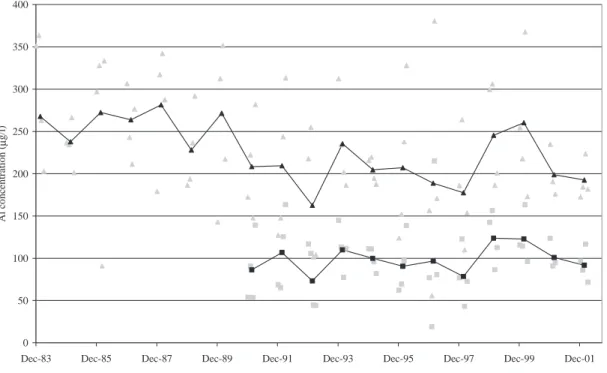
concentrations in the Lower Hafren over the study period was similar and although they showed no trend, any month to month concentration variability was reflected at both stream sites (Fig. 5). Aluminium concentrations in the Upper Hafren fluctuated between 19 and 215 mg l1. Those in the
Lower Hafren were consistently higher, varying between 56 and 380 mg l1 (Fig. 6). Again, there were considerable
changes from month to month, but the changes were always
0.00 0.05 0.10 0.15 0.20 0.25 0.30 0.35 0.40 0.45
Dec-83 Dec-85 Dec-87 Dec-89 Dec-91 Dec-93 Dec-95 Dec-97
Y co ncen tr at io n (µ g /l)
Fig. 6. Al concentrations in the Upper and Lower Hafren. Key as for Fig. 2. 0 50 100 150 200 250 300 350 400
Dec-83 Dec-85 Dec-87 Dec-89 Dec-91 Dec-93 Dec-95 Dec-97 Dec-99 Dec-01
Al c o nc en tra tion (µ g/l)
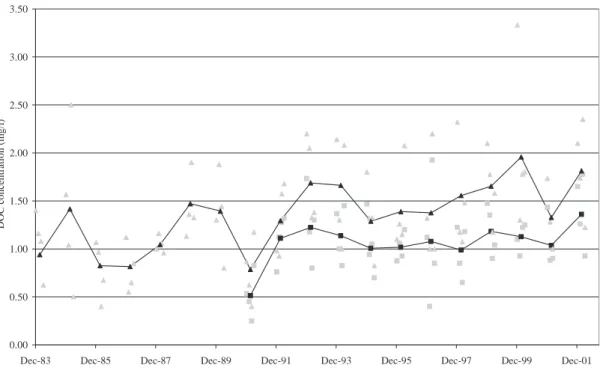
reflected at both sites. Dissolved Organic Carbon concentrations in the Upper Hafren ranged between 0.3 and 1.9 mg l1and the Lower Hafren showed a very similar
pattern of change, except the concentrations were slightly higher (Fig. 7). Yttrium, Al and DOC are linked in that they occur at their highest concentrations in the Plynlimon soil waters, although there is a delineation between acidic, organic rich soil waters (but Al and Y depleted) in their upper horizons where organic matter predominates and less acidic (but Al and Y enriched waters) in the lower soils due to aluminium oxide/hydroxide rich materials in the soil matrix of the lower horizons. Both Y and Al are derived from the lower soil horizons by acid dissolution of oxide and hydroxide phases in the lower soils. Yttrium, Al and DOC concentrations are highest in the streams at high flows as it is at this time when the waters are derived mainly from both the upper and lower soils zones (Neal et al., 1997): baseflow waters are of low Y, Al and DOC concentrations due to decomposition processes in the case of DOC and hydrolysis reactions for Y and Al under the less acidic conditions that appertain (Al and Y hydroxides can precipitate under higher pH conditions). Al and Y are approximately linearly related, and their correlation with DOC relates to the mixing of soil and groundwaters rather than a major linkage over speciation (for example, organic matter complexes with Al are relatively small (Neal, 1995)). The mean monthly concentrations of Y, DOC and Al were all closely correlated (p < 0.01) in the Upper Hafren and
showed significant correlations with the months NAO index (Table 3). The relationship between concentrations and the NAO index was of a very similar significance in the Lower Hafren. The strongest correlations for solute concentrations were with rainfall totals (Table 3), with the correlations with temperature being only slightly weaker. There was no correlation between monthly bulk deposition totals and stream concentration for these substances. The most significant correlations were those without a time-lag, suggesting a rapid response mechanism. The rainfall aspect of the NAO index was probably the controlling variable as storm flow waters, created by runoff originating from soil water and surface horizons, have higher Y, Al and H+
concentrations than base flow waters as mentioned above. Al and Y are known to undergo rapid flushing during rainfall events (Soulsby and Reynolds, 1993); this possibly helps to explain the lack of correlation between the concentrations of one month and the conditions of the previous month. Storm flow is also known to flush DOC out of the soil, creating high concentration events, especially when the flow path of the storm water avoids mineral horizons within the soil and antecedent conditions have been relatively dry (Eatherall et al., 1998).
If the longer term December-March indices were used, there was no significant correlation between the NAO index and Al or DOC concentrations. However, the December-March mean Y concentration in the Upper Hafren was correlated significantly with the DecemberMarch NAO
Fig. 7. DOC concentrations in the Upper and Lower Hafren. Key as for Fig. 2. 0.00 0.50 1.00 1.50 2.00 2.50 3.00 3.50
Dec-83 Dec-85 Dec-87 Dec-89 Dec-91 Dec-93 Dec-95 Dec-97 Dec-99 Dec-01
DOC c once n tr ation ( m g/l)
Table 3. Spearmans correlation coefficients (r2) for Y, Al and DOC with climatic variables. UH=Upper Hafren, LH=Lower Hafren.
Significance levels: ** = p < 0.01, * = p < 0.05, ns = not significant (p > 0.05).
Independent variable
Y, DOC (mg l-1) and Monthly rainfall Mean monthly Monthly NAO Coefficient when dependent variable lags
Al (mgl-1) conc. total (mm) temperature (oC)index the independent variable by a month
Monthly Mean monthly Monthly rainfall total temperature NAO
(mm)(oC)index UH Y 0.635 ** 0.491 ** 0.442 * ns ns ns UH Al 0.599 ** 0.371 * 0.296 * ns ns ns UH DOC 0.476 ** 0.451 ** 0.318 * ns ns ns LH Y 0.610 ** 0.466 ** 0.494 ** ns 0.255 * ns LH Al 0.460 ** ns 0.352 ** ns ns ns LH DOC 0.399 ** 0.456** 0.284* ns 0.252* ns
index (Spearmans Rank correlation, r2 = 0.717, p < 0.05)
and was significant in the Lower Hafren too (Spearmans Rank correlation r2 = 0.623, p < 0.05). Yttrium
concentrations were much lower than those of Al or DOC, so small stream concentration changes caused by rainfall totals may have been more visible and significant. This difference in relationship between long and shorter term periods shows the importance of considering processes at different timescales.
CALCIUM AND MAGNESIUM
Between 1990 and 2002, Ca concentrations in the Upper Hafren ranged from 0.37 to 0.71 mg l1 (Fig. 8). There was
no trend in the data, but mean concentrations varied substantially from month to month and were consistently around 0.3 mgl-1 greater in the Lower Hafren than the Upper
Hafren. The Ca concentration in the Upper Hafren was significantly negatively related to that months rainfall total, NAO index and mean temperature and the previous months NAO (Table 4, Spearmans Rank correlations, r2 = 0.776,
Fig. 8. Ca and Mg concentrations in the Upper and Lower Hafren. Individual points show the mean Ca concentrations for December, January,
February and March in each year while the solid lines represent the mean December-March Ca concentrations for each year. The Upper Hafren Ca concentrations are represented by squares, the Lower Hafren Ca values by triangles. The Upper Hafren mean December-March Mg concentrations are represented by squares joined by a dashed line and the Lower Hafren mean December-March Mg concentrations for each
year are represented by triangles joined by a dashed line. Individual monthly Mg concentrations are not shown.
0.0 0.2 0.4 0.6 0.8 1.0 1.2 1.4
Dec-83 Dec-85 Dec-87 Dec-89 Dec-91 Dec-93 Dec-95 Dec-97 Dec-99 Dec-01
Ca or M g c o nc en tr at io n ( m g /l )
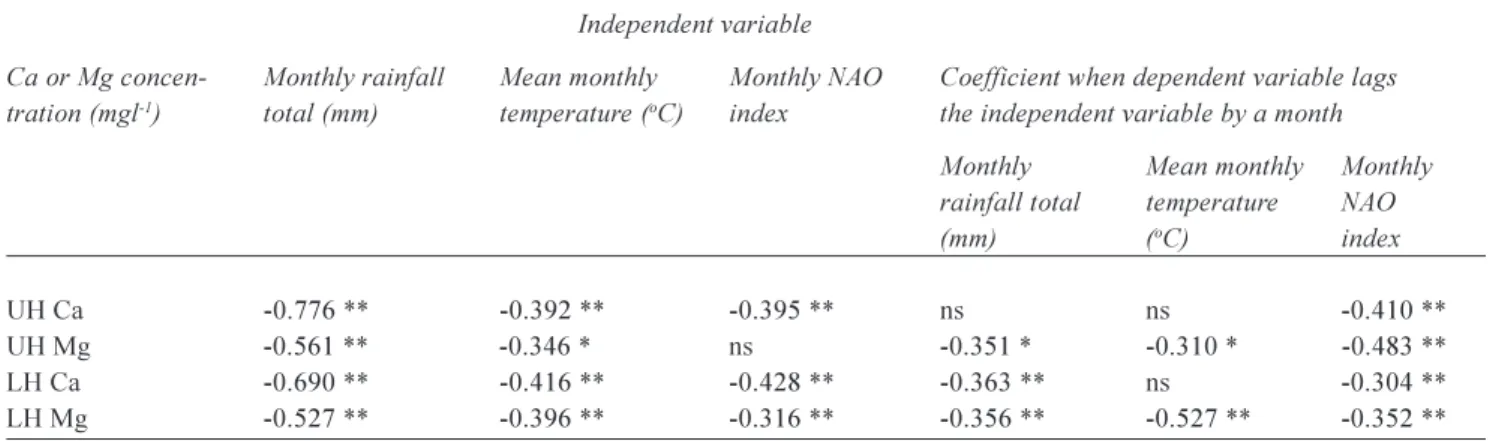
Table 4. Spearmans correlation coefficients (r2) for Ca and Mg with climatic variables. UH=Upper Hafren, LH=Lower Hafren.
Significance levels: ** = p < 0.01, * = p < 0.05, ns = not significant (p > 0.05). Independent variable
Ca or Mg concen- Monthly rainfall Mean monthly Monthly NAO Coefficient when dependent variable lags tration (mgl-1)total (mm) temperature (oC)index the independent variable by a month
Monthly Mean monthly Monthly rainfall total temperature NAO
(mm)(oC)index
UH Ca -0.776 ** -0.392 ** -0.395 ** ns ns -0.410 **
UH Mg -0.561 ** -0.346 * ns -0.351 * -0.310 * -0.483 **
LH Ca -0.690 ** -0.416 ** -0.428 ** -0.363 ** ns -0.304 ** LH Mg -0.527 ** -0.396 ** -0.316 ** -0.356 ** -0.527 ** -0.352 ** 0.395, 0.392 and 0.410, p < 0.01). In the Lower Hafren,
the significant correlations were the same, with the addition of a significant link between the Ca concentration and the rainfall total of the previous month (Table 4). Magnesium concentrations at both sites followed those of Ca very closely, suggesting similar controls and transport. In the Upper Hafren, the mean Mg concentration ranged between 0.47 and 0.74 mg l1. Again, any concentration changes were
reflected at both sites with concentrations around 0.15 mg l1 higher for the Lower Hafren. The Mg concentrations
in the Upper Hafren were significantly negatively correlated with the rain total, mean temperature and NAO index of the previous month and the rainfall and mean temperature of the same month (Table 4, Spearmans Rank correlations, r2
= 0.351, 0.310, p < 0.05, r2 = 0.483, 0.561, p < 0.01, r2
= 0.346, p < 0.05 ). Magnesium concentrations in the Lower Hafren showed the same relationships and also were significantly correlated with the NAO index of the same month.
Hore, also on Plynlimon (Neal, 2002a,b). Ca concentrations in the Lower Hafren, however, do not appear to have been affected by felling. This difference may be due to the Afon Hafren catchment containing less Ca rich bedrock than the Afon Hore catchment (Reynolds et al., 1987; Neal et al., 1997), the hydrology of the Hafren catchment allowing less dominance of base rich waters than the Hore or the felling activity in the Hafren catchment being less intense.
The primary cause of the variation of Ca and Mg concentrations with the NAO index was not atmospheric deposition because this was positively correlated with the NAO while the stream concentrations were inversely related to the NAO. Base flow waters in the Hafren have higher Ca concentrations than storm flow waters as they contain proportionally more water from the lower soil and bedrock where the weathering of calcium carbonate and calcium bearing silicates has been occurring (Reynolds et al., 1987; Neal et al., 1997). Changes in the proportion of the streams total flow coming from base flow are therefore a major control on the concentration of Ca in stream water (Reynolds
et al., 1987). Months with a low NAO index were relatively
dry, so base flow would have dominated the stream flow and the concentration-flow diagram for Ca and Mg showed the pattern typical of a component controlled by a groundwater source (Fig. 9), suggesting that their concentrations are controlled indirectly by the NAO through the volume of water from different sources present in the stream. Calcium (and to some extent Mg) concentrations
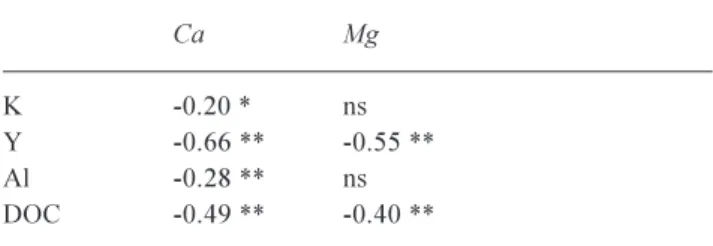
were also significantly negatively correlated with Y, Al and DOC (Table 5), as would be expected if their sources were different waters. The concentration-flow diagrams of Y, Al and DOC also appeared typical of those of constituents controlled by run-off sources (data not shown). The negative relationship of Ca and K concentrations was weaker (and even insignificant in the case of Mg), indicating that K concentrations may be influenced by processes more akin to those controlling Ca and Mg. As there are weathering sources of K in the catchment in the form of illite (a K rich mica) in the bedrock (Reynolds et al., 1997), this may account for the difference in relationship strength as base flow and storm flow waters (through the flushing of excess K from soils) would both be sources of K.
Some of the variation in stream Ca and Mg concentrations
Table 5. Spearmans correlation coefficients (r2) for Ca, Mg, K, Y,
Al and DOC stream water concentrations in the Lower Hafren. Significance levels: ** = p < 0.01, * = p < 0.05, ns = not significant (p > 0.05). Ca Mg K -0.20 * ns Y -0.66 ** -0.55 ** Al -0.28 ** ns DOC -0.49 ** -0.40 ** 0.0 0.2 0.4 0.6 0.8 1.0 1.2 1.4 0.00 0.05 0.10 0.15 0.20 0.25 0.30 0.35 0.40 0.45 Mean monthly flow (mm/15 min)
M ea n Ca and M g c oncentration (mg/ l)
Fig. 9. Mean Ca and Mg concentration variations with flow volume in the Lower Hafren. Ca concentrations are represented by triangles and
elsewhere has been linked to both rainfall totals and freezing events (Fitzhugh et al., 2003). However, freezing explained less of the variation in Mg and Ca concentration in the Hubbard Brook study than it did for K and NO3. In the Afon
Hafren, Ca and Mg were both correlated with temperature, but the correlation with rainfall was stronger and so the major control probably was the amount of rainfall.
The JanuaryMarch Ca and Mg concentrations in the Upper Hafren showed the strongest correlation with the DecemberFebruary NAO index (Spearmans Rank correlation, r2 = 0.804, 0.783, p < 0.01, respectively).
Therefore, the changes in Ca and Mg concentration due to the NAO are visible both immediately and for a while thereafter. The lag time seen in the longer term indices may be caused by different processes, such as freezing, but there is no clear evidence for this.
Conclusions
The long-term stream water quality record from the Afon Hafren in mid-Wales shows K, Y, Al and DOC concentrations increasing during high NAO index winter months, while Ca, Mg and NO3 concentrations increase
during low NAO index winter months, with the increased concentrations lasting into the next month. The mechanisms through which the NAO influences the concentrations of these different constituents in streamwater vary. Stream NO3
concentrations in the Afon Hafren are influenced by the NAO through temperature regulated processes in the soil but changes in catchment management, such as tree felling, can increase the importance of rain driven flushing. Potassium concentrations are affected by the rainfall volume aspect of the NAO and, again, the controls can be altered by catchment management changes. Little evidence is seen in the Afon Hafren data that freezing processes significantly increase stream K concentrations although this has been observed in the eastern USA. Yttrium, Al and DOC stream concentrations are all related to the NAO through the amount of rainfall occurring and the volume of runoff generated. Links between the NAO and stream Y concentrations have not been observed before and only the use of monthly, rather than longer-term, NAO indices allowed them to be seen in this study. Calcium and Mg are also indirectly influenced by the NAO through control of the streams flow regime. Again, no evidence of concentration increases linked to a temperature mechanism is seen at Plynlimon although this has been seen in the USA.
The value of long-term stream chemistry data sets such as those used here is great as the changes in chemical concentration caused by alterations to the catchment and catchment stores can be distinguished from those caused
by climate variability, a near impossibility with short data sets given the time-spans of the different types of drivers and responses. By establishing the relationships between aspects of long-term stream chemistry data sets and climate indices such as the NAO, the projection of future changes in some aspects of stream chemistry may be possible using this climate index. However, the exact value of the analysis will vary from constituent to constituent, depending on the method and time scale over which the NAO affects its concentration. Further, it will also be important to consider the different aspects of the NAO which may affect stream concentrations in different situations as the chemical response in streams flowing through different ecosystems has been shown to be dissimilar.
Acknowledgements
NAO index data was obtained from the Climatic Research Unit, University of East Anglia (http://www.cru.uea.ac.uk/ cru/data/nao.htm). Chemical data were collected by the Centre for Ecology and Hydrology, Wallingford and Bangor, funded by the Natural Environment Research Council.
References
Boormann, F.H. and Likens, G.E., 1979. Patterns and process in
a forested ecosystem. Springer, New York, USA. 226pp.
Bradley, D.C. and Ormerod, S.J., 2001. Community persistence among stream invertebrates tracks the North Atlantic Oscillation.
J. Anim. Ecol., 70, 987996.
Chapman, P.J., 1994. Hydrogeochemical processes influencing
episodic streamwater chemistry in a small headwater catchment, Plynlimon, mid-Wales. PhD thesis, University of London, UK.
416pp.
Climatic Research Unit, University of East Anglia, North Atlantic Oscillation index, http://www.cru.uea.ac.uk/cru/data/nao.htm. Eatherall, A., Naden, P.S. and Cooper, D.M., 1998. Simulating
carbon flux to the estuary: The first step. Sci. Total Envir., 210, 519533.
Emmett, B.A., Stevens, P.A. and Reynolds, B., 1995. Factors influencing nitrogen saturation in sitka spruce stands in Wales, UK. Water Air Soil Pollut., 85, 16291634.
Evans, C.D. and Monteith, D.T., 2001. Chemical trends at lakes and streams in the UK Acid Waters Monitoring Network, 1988-2000: evidence for recent recovery at a national scale. Hydrol.
Earth Syst. Sci., 5, 351366.
Evans, C.D., Monteith, D.T. and Harriman, R., 2001. Long-term variability in the deposition of marine ions at west coast sites in the UK Acid Waters Monitoring Network: impacts on surface water chemistry and significance for trend determination. Sci.
Total Envir., 265, 115129.
Fitzhugh, R.D., Likens, G.E., Driscoll, C.T., Mitchell, M.J., Groffman, P.M., Fahey, T.J. and Hardy, J.P., 2003. Role of soil freezing events in interannual patterns of stream chemistry at the Hubbard Brook experimental forest, New Hampshire.
Foster, H.J., Lees, M.J., Wheater, H.S., Neal, C. and Reynolds, B., 2001. A hydrochemical modelling framework for combined assessment of spatial and temporal variability in stream chemistry: application to Plynlimon, Wales. Hydrol. Earth Syst.
Sci., 5, 4958.
Gillett, N.P., Graf, H.F. and Osborn, T J., 2003. Climate Change and the North Atlantic Oscillation. In: The North Atlantic
Oscillation: Climatic Significance And Environmental Impact,
James W. Hurrell, Yochanan Kushnir, Geir Ottersen and M. Visbeck (Eds.), Geophysical Monograph Series, 134. Hornung, M., Stevens, P.A. and Reynolds, B., 1986. The Impact
of Pasture Improvement on the Soil Solution Chemistry of Some Stagnopodzols in Mid-Wales. Soil Use Manage., 2, 1826. Hurrell, J.W., 1995. Decadal trends in the North Atlantic
oscillation: regional temperatures and precipitation. Science,
269, 676679.
Irwin, J.G., Campbell, G. and Vincent, K., 2002. Trends in sulphate and nitrate wet deposition over the United Kingdom: 1986-1999.
Atmos. Environ., 36, 28672879.
Kirby, C., Newson, M.D. and Gilman, K., 1991. Plynlimon research: the first two decades. Institute of Hydrology Report
No. 109, Institute of Hydrology, Wallingford, UK, 188pp.
Likens, G.E. and Boormann, F.H., 1995. Biogeochemistry of a
forested ecosystem. Springer, New York, USA.159pp.
Mitchell, T.D., Carter, T.R., Jones, P.D., Hulme, M. and New, M., 2003. A comprehensive set of high-resolution grids of monthly climate for Europe and the globe: the observed record (1901-2000) and 16 scenarios (2001-2100). Tyndall Centre Working
Paper 55.
Monteith, D.T., Evans, C.D. and Reynolds, B., 2000. Are temporal variations in the nitrate content of UK upland freshwaters linked to the North Atlantic Oscillation? Hydrol. Process., 14, 1745 1749.
Neal, C., 1995. Aluminium speciation variations in an acidic upland stream draining the Hafren spruce forest, Plynlimon, Mid-Wales. J. Hydrol., 164, 3951.
Neal, C., 2002a. Assessing environmental impacts on stream water quality: the use of cumulative flux and cumulative flux difference approaches to deforestation of the Hafren Forest, mid-Wales. Hydrol. Earth Syst. Sci., 6, 421432.
Neal, C., 2002b. Nutrient concentrations and fluxes for podzolic and gley soils at Plynlimon, mid-Wales: implications for modelling inorganic nitrogen and phosphorus in upland UK environments. Hydrol. Earth Syst. Sci., 6, 403420.
Neal, C., Robson, A. and Smith, C.J., 1990. Acid neutralization capacity variations for the Hafren Forest stream, midWales -inferences for hydrological processes. J. Hydrol., 121, 85101. Neal, C., Fisher, R., Smith, C.J., Hill, S., Neal, M., Conway, T., Ryland, G.P. and Jeffrey, H.A., 1992. The effects of tree harvesting on stream-water quality at an acidic and acid-sensitive spruce forested area - Plynlimon, mid-Wales. J.
Hydrol., 135, 305319.
Neal, C., Wilkinson, J., Neal, M., Harrow, M., Wickham, H., Hill, L. and Morfitt, C., 1997. The hydrochemistry of the headwaters of the river Severn, Plynlimon. Hydrol. Earth Syst. Sci., 1, 583 617.
Neal, C., Reynolds, B., Neal, M., Pugh, B., Hill, L. and Wickham, H., 2001. Long-term changes in the water quality of rainfall, cloud water and stream water for moorland, forested and clear-felled catchments at Plynlimon, mid-Wales. Hydrol. Earth Syst.
Sci., 5, 459476.
Neal, C., Reynolds, B., Neal, M., Wickham, H., Hill, L. and Williams, B., 2004. The impact of conifer harvesting on stream water quality: the Afon Hafren, mid-Wales. Hydrol. Earth
System. Sci., 8, 503520.
Portis, D.H., Walsh, J.E., El Hamly, M. and Lamb, P.J., 2001. Seasonality of the North Atlantic oscillation. J. Climate, 14, 20692078.
Reynolds, B., Neal, C., Hornung, M. and Stevens, P.A. 1987. Baseflow buffering of streamwater acidity in five mid-Wales catchments. J. Hydrol., 87, 167185.
Reynolds, B., Fowler, D., Smith, R.I. and Hall, J.R., 1997. Atmospheric inputs and catchment solute fluxes for major ions in five Welsh upland catchments. J. Hydrol., 194, 305329. Reynolds, B., Lowe, J.A. H., Smith, R.I., Norris, D.A., Fowler,
D., Bell, S.A., Stevens, P.A. and Ormerod, S.J., 1999. Acid deposition in Wales: the results of the 1995 Welsh Acid Waters Survey. Environ. Pollut., 105, 251266.
Soulsby, C. and Reynolds, B., 1993. Influence of Soil Hydrological Pathways on Stream Aluminum Chemistry at Llyn-Brianne, Mid-Wales. Environ. Pollut., 81, 5160.
Wilkinson, J., Reynolds, B., Neal, C., Hill, S., Neal, M. and Harrow, M., 1997. Major, minor and trace element composition of cloudwater and rainwater at Plynlimon. Hydrol. Earth Syst.
Sci., 1, 557569.
Wright, R.F., Marchetto, A., Moldan, F., Prechtel, A., Rogora, M., Alewell, C., Cullen, J.M. and Evans, C.D., 2001. Trends in nitrogen deposition and leaching in acid-sensitive streams in Europe. Hydrol. Earth Syst. Sci., 5, 299310.