HAL Id: insu-03231646
https://hal-insu.archives-ouvertes.fr/insu-03231646
Submitted on 21 May 2021
HAL is a multi-disciplinary open access
archive for the deposit and dissemination of
sci-entific research documents, whether they are
pub-lished or not. The documents may come from
teaching and research institutions in France or
abroad, or from public or private research centers.
L’archive ouverte pluridisciplinaire HAL, est
destinée au dépôt et à la diffusion de documents
scientifiques de niveau recherche, publiés ou non,
émanant des établissements d’enseignement et de
recherche français ou étrangers, des laboratoires
publics ou privés.
Distributed under a Creative Commons Attribution| 4.0 International License
Urban-focused satellite CO2 observations from the
Orbiting Carbon Observatory-3: A first look at the Los
Angeles megacity
Matthäus Kiel, Annmarie Eldering, Dustin Roten, John Lin, Sha Feng,
Ruixue Lei, Thomas Lauvaux, Tomohiro Oda, Coleen Roehl, Jean-Francois
Blavier, et al.
To cite this version:
Matthäus Kiel, Annmarie Eldering, Dustin Roten, John Lin, Sha Feng, et al.. Urban-focused satellite
CO2 observations from the Orbiting Carbon Observatory-3: A first look at the Los Angeles megacity.
Remote Sensing of Environment, Elsevier, 2021, 258, pp.112314. �10.1016/j.rse.2021.112314�.
�insu-03231646�
Remote Sensing of Environment 258 (2021) 112314
Available online 1 March 2021
0034-4257/© 2021 The Author(s). Published by Elsevier Inc. This is an open access article under the CC BY license (http://creativecommons.org/licenses/by/4.0/).
Urban-focused satellite CO
2
observations from the Orbiting Carbon
Observatory-3: A first look at the Los Angeles megacity
Matth¨aus Kiel
a,*, Annmarie Eldering
a, Dustin D. Roten
d, John C. Lin
d, Sha Feng
b,j,
Ruixue Lei
b, Thomas Lauvaux
c, Tomohiro Oda
e,f,g, Coleen M. Roehl
h, Jean-Francois Blavier
a,
Laura T. Iraci
iaJet Propulsion Laboratory, California Institute of Technology, Pasadena, CA, USA
bDepartment of Meteorology and Atmospheric Science, The Pennsylvania State University, University Park, PA, USA
cLaboratoire des Sciences du Climat et de l’Environnement, CEA, CNRS, UVSQ/IPSL, Universit´e Paris-Saclay, Orme des Merisiers, Gif-sur-Yvette, France dDepartment of Atmospheric Sciences, University of Utah, Salt Lake City, UT, USA
eGlobal Modeling and Assimilation Office, NASA Goddard Space Flight Center, Greenbelt, MD, USA
fGoddard Earth Sciences Technology and Research, Universities Space Research Association, Columbia, MD, USA gDepartment of Atmospheric and Oceanic Science, University of Maryland, College Park, MD, USA
hDivision of Geological and Planetary Sciences, California Institute of Technology, Pasadena, CA, USA iNASA Ames Research Center, Moffett Field, CA, USA
jAtmospheric Sciences and Global Change Division, Pacific Northwest National Laboratory, Richland, WA, USA
A R T I C L E I N F O
Keywords:
Greenhouse gas emissions Carbon dioxide Anthropogenic Fossil fuel Los Angeles Megacity Remote sensing OCO-3 TCCON WRF-Chem X-STILT A B S T R A C T
NASA’s Orbiting Carbon Observatory-3 (OCO-3) was designed to support the quantification and monitoring of anthropogenic CO2 emissions. Its Snapshot Area Map (SAM) and target mode measurements provide an
inno-vative dataset for carbon studies on sub-city scales. Unlike any other current space-based instrument, OCO-3 has the ability to scan large contiguous areas of emission hot spots like cities, power plants, and volcanoes. These measurements result in dense, fine-scale spatial maps of column averaged dry-air mole fractions of carbon di-oxide (XCO2). For the first time, we present and analyze XCO2 distributions over the Los Angeles megacity (LA)
derived from OCO-3 SAM and target mode observations. Urban XCO2 enhancements range from 0 − 6 ppm
(median enhancements ≃ 2 ppm) relative to a clean background and show excellent agreement with nearby ground-based TCCON measurements of XCO2. OCO-3’s dense observations reveal intra-urban variations of XCO2
over the city that have never been observed from space before. The spatial variations are mainly driven by the complex fossil fuel emission patterns and meteorological conditions in the LA Basin and are in good agreement with those from co-located TROPOMI measurements of co-emitted NO2. Differences between measured and
simulated XCO2 enhancements from two models (WRF-Chem and X-STILT) are typically below 1 ppm with larger
differences for some sub regions. Both models capture the observed intra-urban XCO2 gradients. Further, OCO-3’s
multi-swath measurements capture about three times as much of the city emissions compared to single-swath overpasses. OCO-3’s frequent target and SAM mode observations will pave the way to constrain urban emis-sions at finer, sub-city scales.
1. Introduction
Urban areas account for more than 70% of the global anthropogenic CO2 emissions to the atmosphere. The largest emitters are megacities,
large urban systems with 10 million or more inhabitants (United Nations Department of Economic and Social Affairs, 2019). The megacities’ rapid growth in population and economic power results in increasing
carbon emissions which impact the composition of the atmosphere and the climate on a global scale. For example, the world’s 33 megacities emit more than 20% of the global anthropogenic fossil fuel CO2
emis-sions, but cover only about 3% of the Earth’s land surface (Stocker et al. 2013).
The Los Angeles megacity (LA) is one of the five largest fossil fuel CO2 emitters in the world (≃13.5 million inhabitants, ≃196.5 ± 43.7
* Corresponding author.
E-mail address: matthaeus.kiel@jpl.nasa.gov (M. Kiel).
Contents lists available at ScienceDirect
Remote Sensing of Environment
journal homepage: www.elsevier.com/locate/rsehttps://doi.org/10.1016/j.rse.2021.112314
MtCO2/year; Moran et al. 2018). It is an international aviation and
intermodal transportation hub, including the Los Angeles International Airport, the Port of Los Angeles, and a vast network of interconnected freeways for transportation. Further, large parts of the California oil and gas industry are concentrated primarily in the Greater LA Basin. The city has an extensive oil drilling infrastructure, with several local oil re-fineries and storage facilities (Chilingar and Endres 2005).
The city’s administration has set aggressive goals for a sustainable future. For example, the LA Green New Deal Plan aims to reduce green-house gas emissions by 65% by 2035 from 2008 baseline levels, reaching carbon neutrality by 2045 (https://plan.lamayor.org/). To achieve these ambitious goals, it is important to monitor and report anthropogenic carbon sources regularly. In addition to reporting emissions on a voluntary basis or under climate action activities, atmospheric obser-vations of greenhouse gases provide independent measurements that can help to monitor carbon sources as anthropogenic emissions are re-flected in atmospheric CO2 concentrations.
Several studies used atmospheric observations of CO2 over LA to
characterize fossil fuel emissions (Wunch et al. 2009; Brioude et al. 2013; Newman et al. 2013; Hedelius et al. 2018). Typically, urban emissions create persistent and localized CO2 domes over and downwind
of large cities that can be detected from space (Idso et al., 1998; Newman et al. 2013). For example, Kort et al. (2012) analyzed XCO2
measure-ments over LA derived from observations collected by the Greenhouse gases Observing Satellite (GOSAT) (Yokota et al. 2009; Kuze et al. 2009). They found statistically significant XCO2 enhancements of ≃ 3 parts per
million (ppm) compared to measurements over a nearby desert-like background site. Schwandner et al. (2017) analyzed single nadir track measurements over LA from NASA’s Orbiting Carbon Observatory-2 (OCO-2; Crisp et al., 2017; Eldering et al., 2017) and found that anthropogenic XCO2 enhancements peak over the urban core (≃ 4− 6
ppm) and decrease through suburban areas to rural background values more than 100 km away.
Recent studies examined the utility of CO2 data collected from OCO-
2 to constrain whole city scale urban emissions including LA (Wu et al. 2018; Wu et al., 2020; Ye et al., 2020). However, the OCO-2 type sampling has difficulties yielding information at sub-city scales. OCO-2 has a long revisit cycle of ≃ 16 days and a narrow swath of ≤ 10.3 km. This only allows a small portion of urban emissions to be detected during a single overpass if the meteorological conditions are favorable. Also, OCO-2 follows a sun-synchronous orbit, meaning that all observations are temporally limited to local afternoon.
NASA’s Orbiting Carbon Observatory-3 (OCO-3) includes an obser-vation mode specifically designed to measure anthropogenic emissions and overcomes some of the above mentioned limitations. NASA launched the OCO-3 instrument on May 4, 2019 from Kennedy Space Center to the International Space Station (ISS). OCO-3 has the ability to scan large contiguous areas (approximately 80 × 80 km2) on a single
overpass over emission hot spots like cities, power plants, or volcanoes. These observational modes are called Snapshot Area Map (SAM) and target mode and collect fine-scale spatial maps of XCO2 unlike what can
be done with any other current space-based instrument (Eldering et al. 2019). For example, due to its agile 2-axis pointing mirror assembly (PMA), OCO-3 can measure XCO2 over the entire LA Basin during the
span of only two minutes by collecting multiple swaths of data, providing information about XCO2 distributions on sub-city scales. In
addition, if the ISS orbit geometry is favorable, OCO-3 can collect SAM or target mode data over the same area within several days and at different times of the day, giving insights into day-to-day and diurnal variations of intra-urban XCO2 distributions.
Here, we present and analyze the very first sub-city scale XCO2
dis-tributions over LA derived from target and SAM mode observations collected by OCO-3 in October 2019 and February 2020. We use data from nearby Total Carbon Column Observing Network (TCCON, Wunch et al. 2011a) stations to validate the OCO-3 measurements over parts of LA and to calculate urban XCO2 enhancements. The dense, high
resolution OCO-3 observations reveal intra-urban variations of XCO2 over
LA that have never been observed from space before. We relate the observed variations to the underlying meteorological conditions and co- located NO2 measurements from the TROPOspheric Monitoring
Instru-ment (TROPOMI). Further, we compare the XCO2 enhancements
observed by OCO-3 with simulated values from two independent models that can resolve XCO2 variations across the city: an Eulerian, gridded
approach (WRF-Chem) and a time-inverted Lagrangian approach based on air parcels (X-STILT). Finally, we demonstrate the advantage of OCO- 3’s multi-swath measurement approach to capture large parts of city emissions compared to single-swath overpasses.
2. Datasets
2.1. OCO-3 XCO2 data
The OCO-3 instrument is currently mounted to the Japanese Exper-imental Module - Exposed Facility (JEM-EF) on board of the ISS and collects solar radiance spectra over the sunlit hemisphere in four observational modes: nadir, glint, target, and SAM. In SAM mode, OCO- 3’s agile 2-axis PMA is commanded to collect nearly adjacent swaths of data, resulting in a small map of measurements spanning approximately 80 × 80 km2, collected over a time span of approximately two minutes.
During target mode observations, OCO-3 collects a series of relatively long segments (usually 5 or 6 segments) resulting in a sequence of overlapping along-track swaths. Similar to OCO-2, OCO-3’s target mode observations provide the primary dataset for validation of the XCO2
product and are typically taken over sites that operate ground based TCCON instruments (Wunch et al. 2011a, 2017). The overlapping swaths can cover an area of up to ≃ 20 × 80 km2 (compared to 20 × 20
km2 for OCO-2), also creating small maps of XCO2 over TCCON city sites.
OCO-3 has also a slightly larger footprint size compared to OCO-2. The OCO-3 along track footprint size is ≃ 2.2 km at nadir and the cross-track footprint size is ≤ 1.6 km, resulting in a slightly larger footprint area (3.5 km2) compared to OCO-2 (3 km2).
In this study, we focus on the first XCO2 SAM and target mode
ob-servations taken by the OCO-3 instrument over LA in October 2019 and February 2020. We use the OCO-3 vEarly product which is publicly available through the NASA Goddard Earth Science Data and Informa-tion Services Center (GES DISC) for distribuInforma-tion and archiving (http://disc.sci.gsfc.nasa.gov/). This product uses the newest Atmo-spheric Carbon Observations from Space (ACOS, O’Dell et al. 2018) build 10 (b10) software suite using an early Ancillary Radiometric Product (ARP). The vEarly quality filtered and bias corrected XCO2
dataset shows reasonable performance for all viewing modes over land. As described in Taylor et al. (2020), the OCO-3 vEarly data contains time dependent residual pointing errors that occasionally exceed OCO-3’s footprint size, especially for large azimuth and elevation positions of the PMA. The team is currently investigating possible error sources (including timing errors, mounting angles, PMACal correction table updates) to reduce pointing errors in the next reprocessing campaign. For our analysis, we carefully checked the OCO-3 target and SAM mode data for possible pointing errors by investigating radiance levels of OCO- 3’s O2 A-band data from coastline crossing. The pointing error in the
data analyzed here appears to be below OCO-3’s footprint size and the data is well suited for investigations of city scale XCO2 gradients. A
detailed description of the OCO-3 vEarly XCO2 data product and its data
quality is given in (Taylor et al. 2020; Osterman et al. 2020). 2.2. TCCON XCO2 data
The TCCON is a global network of high-resolution ground-based Fourier Transform Spectrometers that record solar spectra in the near- infrared region. It provides measurements of column-averaged abun-dances of CO2 and other atmospheric gases such as CH4 and CO. TCCON
been used to validate data from multiple satellites, e.g. OCO-2, GOSAT, TROPOMI, and MOPITT (Wunch et al. 2011b; O’Dell et al. 2018; Bors-dorff et al., 2018; Kiel et al. 2019; Hedelius et al. 2019).
Here, we use the GGG2014 dataset (Wunch et al. 2015) from two TCCON sites in and outside of LA: XCO2 data from the Caltech TCCON
instrument located in Pasadena, CA (Wennberg et al. 2014), a city north- east of LA which is part of the greater LA metropolitan area, and XCO2
data from the TCCON instrument at NASA’s Armstrong Flight Research Center (AFRC, Iraci et al. 2016), located about ≃ 100 km north of LA near Edwards, CA (see Fig. 1). We use the Caltech TCCON data to validate OCO-3 XCO2 measurements over the northern part of LA and the
TCCON AFRC XCO2 dataset to derive background XCO2 estimates for each
OCO-3 overpass.
The AFRC instrument is separated from the greater LA metropolitan area by the San Gabriel mountains which form a natural border between the sparsely populated area around Edwards and LA (see Fig. 1). It is located about 25 km west-southwest of the Mojave desert, one of the driest deserts on Northern America. The biosphere around ARFC consists mainly of cacti and succulents. Both city and background observations are affected similarly by large scale CO2 transport but the AFRC site is
impacted minimally by local fluxes. At times the AFRC site is directly downwind of Bakersfield, measurements might be contaminated by anthropogenic CO2 emissions and therefore not suitable as clean XCO2
background values. HYSPLIT (Stein et al. 2016) back trajectory calcu-lations indicate that this is not the case for the analyzed days here. 2.3. Surface wind data
The meteorological conditions in the LA Basin are complex due to local topography and the city’s proximity to the coast. The wind expe-rienced at any given location is highly variable in time and affects the spatiotemporal distribution of XCO2 over LA. Typical day time
circula-tions show onshore winds from south-west direction with low wind
speeds (≃ 2 m/s), but circulations can change dramatically from day to day, for example during Santa Ana events when strong easterly winds (≃ 8− 13 m/s) travel from the desert into the LA Basin (Rolinski et al. 2019).
We include hourly wind measurements (speed and direction) from the National Centers for Environmental Prediction (NCEP) ADP Global Surface Observational Weather Data in our analysis (NCEP 2004). The data are composed of surface weather reports operationally collected by NCEP and include land and marine surface reports. We use data from eight stations in and around the LA Basin in our study. In addition, we use hourly wind data from seven surface measurement stations operated by the South Coast Air Quality Management District (SCAQMD). An overview of the station locations is given in Fig. 1.
2.4. WRF-Chem model simulations
Our Weather Research and Forecasting model with chemistry (WRF- Chem) setup and parameterizations follow the best combination concluded by Feng et al. (2016). The innermost domain (1.3 km spatial resolution in latitude and longitude) fully covers the OCO-3 SAM and target mode observations over LA. We choose the ERA5 reanalysis (Hersbach et al. 2020) for the meteorological initial and lateral boundary conditions and nudge the WRF-Chem transport to ERA5 through Four Dimensional Data Assimilation (Deng and Stauffer 2006). This modification offers better constraints to the model transport compared to the setup used in Feng et al. (2016). We use monthly 1 × 1 km2 fossil fuel emission estimates from the Open-source Data Inventory
for Atmospheric Carbon dioxide (ODIAC) Version 2019 (ODIAC2019, Oda et al. 2018) with refined point source information in and around LA. The CO2 mole fractions at each model grid represent fossil fuel CO2 mole
fractions (note that we do not add background or biogenic CO2 mole
fractions because we are only interested in CO2 enhancements over LA).
Finally, we apply OCO-3’s pressure weighting functions (PWF) and averaging kernels (AK) to the model data following Rodgers and Connor (2003).
2.5. X-STILT simulations
We carry out simulations using the column-averaged Stochastic Time-Inverted Lagrangian Transport (X-STILT) model to generate grid-ded XCO2 values at column receptors separated by ≃ 0.02∘ latitude and ≃
0.02∘ longitude across the LA Basin. From each receptor, an ensemble of
air parcels is tracked backwards in time for − 24 h from discretized heights within the column, all other model parameters are identical to the setup used in Wu et al. (2018). The PWF and AK are applied to the discretized release points within the column-receptor using values from the nearest available OCO-2 sounding (Wu et al. 2018).
The air parcels follow three-dimensional wind fields provided from NOAA’s High Resolution Rapid Refresh (HRRR) system (Alexander et al. 2010). The locations and amount of time that parcels spent within the planetary boundary layer are used to calculate the influence footprint, indicating the influence that a particular source region has on the downwind column-receptor (Lin et al. 2003; Fasoli et al. 2018). Each influence footprint is convolved with the monthly ODIAC emissions (Oda and Maksyutov 2011; Oda et al. 2018) to determine the spatially resolved upwind contributions (in ppm) to the column-receptor loca-tion. Identical to our WRF-Chem model setup, we use the ODIAC2019 emission inventory with refined point source information in and around LA.
2.6. TROPOMI NO2 data
The TROPOspheric Monitoring Instrument (TROPOMI) on board of the Copernicus Sentinel-5 Precursor (S5P) satellite was launched in 2017 and measures tropospheric column densities of several key atmo-spheric species. The spatial resolution is ≃ 3.5 × 5.5 km2 (from August Fig. 1. Location of the NCEP (black) and SCAQMD (red) wind stations within
the LA Basin. The positions of the Caltech and AFRC TCCON instruments are indicated in blue. (For interpretation of the references to colour in this figure legend, the reader is referred to the web version of this article.)
2019 onward) and provides almost daily global coverage before filtering soundings that are contaminated by clouds (Veefkind et al. 2012).
NO2 can serve as an independent tracer of atmospheric pollution. It is
simultaneously emitted with CO2 into the atmosphere as part of
anthropogenic activities like fossil fuel combustion and biomass burning. Due to the short lifetime of NO2 (≃ hours), the pollutant
typically remains close to the emission source and measured column densities can easily exceed NO2 background concentrations by several
orders of magnitude, making it a suitable proxy of co-emitted CO2 from
combustion sources.
A single TROPOMI overpass can be sufficient to identify strong NO2
point sources. Reuter et al. (2019) showed that TROPOMI NO2
mea-surements can help to identify urban CO2 plumes. To better characterize
the spatiotemporal variability of XCO2 over LA, we relate XCO2 from OCO-
3 to co-emitted NO2 concentration as observed by TROPOMI. We use the
S5P offline Level 2 version 1.03.02 NO2 data product (van Geffen et al.
2019). We filter for data with quality values below 0.5 which indicate soundings that are affected by clouds. We found co-located NO2 data
within ±3 h of the OCO-3 overpasses on three days that we include in our analysis.
3. XCO2 observations over the Los Angeles megacity
3.1. OCO-3 target and SAM measurements
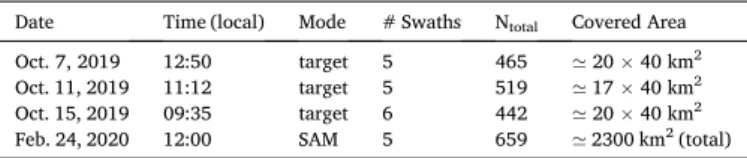
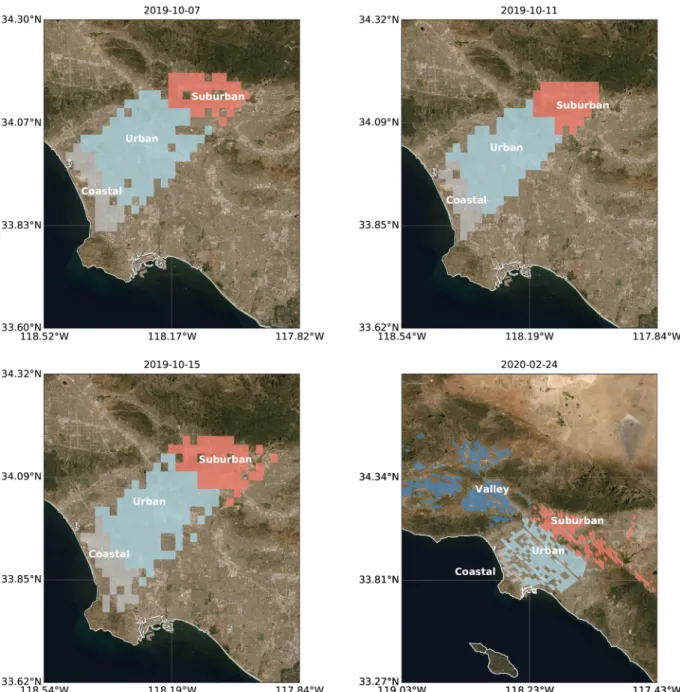
We focus on three OCO-3 target mode overpasses and one SAM observation over LA in 2019 and 2020. The three target mode mea-surements were taken on October 7, 2019 at 12:50 local time (UTC + 7), October 11, 2019 at 11:12 (UTC + 7), and October 15, 2019 at 9:35 (UTC + 7). The SAM observation took place on February 24, 2020 at 12:00 (UTC + 8). The scanning time of each observation took approxi-mately two minutes. A total of five to six overlapping swaths were recorded in target mode and six adjacent swaths in SAM mode. We only include measurements over land in our analysis. All four overpasses took place under clear-sky conditions leading to several hundred good soundings (Ntotal) per overpass after quality filtering (see Table 1). The
target mode observations cover an area of approximately 20 × 40 km2 which we divide into three regions: 1) suburban: mainly residential areas including the Caltech TCCON site in Pasadena; 2) urban: a dense network of manufacturing factories and roads for transportation; and 3) coastal: a major shipping and industrial hub including multiple petro-leum refineries supplying the Los Angeles International Airport and Port of Los Angeles. In addition, the SAM observation on February 24, 2020 extends to the San Fernando Valley, an urbanized valley north of the larger, more populous LA Basin. An illustration of the different regions covered by each overpass is given in Fig. A.11.
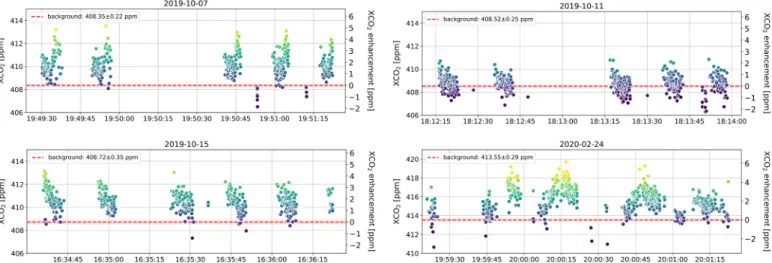
For all days, the XCO2 values as a function of time are shown in Fig. 2.
For the target observations, we observe similar XCO2 variations for each
overlapping swath. The median XCO2 averaged over all swaths is 410.57
±1.14 ppm on October 7, 2019, 408.68 ± 0.73 ppm on October 11, 2019, and 410.51 ± 0.86 ppm on October 15, 2019. For the SAM on February 24, 2020, the XCO2 distribution varies for the adjacent swaths
because each swath covered a different area over LA. The median XCO2
averaged over all swaths is 415.66 ± 1.28 ppm.
3.2. Urban XCO2 enhancements
To derive XCO2 enhancements for each overpass, we subtract the
background measurements taken by the AFRC TCCON instrument from the OCO-3 observations over LA. The difference provides the additional XCO2 within the LA Basin mainly due to local emissions. We average
AFRC TCCON XCO2 values within ±1 h of the OCO-3 mean overpass
times to estimate a clean XCO2 background. Then, we subtract the
background from the OCO-3 XCO2 to calculate enhancements over the
city for each day.
We expect that the calculated enhancements are mainly driven by anthropogenic emissions. Several studies show that the solar-induced chlorophyll fluorescence signal is low over the Greater LA Basin dur-ing the time period of the OCO-3 target and SAM observations ( Frank-enberg et al. 2011; Sun et al. 2018; Yu et al. 2019). Kort et al. (2012) showed that enhancements over LA are a robust feature of the region attributable to anthropogenic emissions and not affected by seasonally varying changes in biospheric fluxes. Here, we assume that the city and background are similarly impacted by biospheric fluxes such that the calculated differences mainly represent enhancements due to local city emissions.
The XCO2 background values and calculated city enhancements are
shown in Fig. 2. We estimate similar background XCO2 values of 408.35
±0.22 ppm, 408.52 ± 0.25 ppm, and 408.72 ± 0.35 ppm for October 7, October 11, and October 15, 2019, respectively. On February 24, 2020, we estimate a background value of 413.55 ± 0.29 ppm. The reported errors represent the variance of the TCCON XCO2 values within ± 1 h of
the OCO-2 mean overpass time.
On three days (October 7, 2019, October 15, 2019, and February 24, 2020), the OCO-3 instrument measured XCO2 abundances over LA
(mainly outside the urban core) that match the XCO2 background. On
October 11, 2019, for large parts of the city, the XCO2 background is
higher than the observed XCO2, however, in good agreement with the
background values on October 7 and 15, 2019.
XCO2 differences between the background and city can become
negative due to local meteorological conditions, e.g., Santa Ana winds. Santa Ana winds are strong katabatic winds arising in higher altitudes and blowing down towards sea level, traveling from the east into the city (Rolinski et al. 2019). The AFRC TCCON measurements are minimally impacted by these events due to its remote location. However, Santa Ana winds ventilate the LA Basin and push urban emissions over the Pacific Ocean, leading to small or negative differences between background and city observations.
3.3. Intra-urban variability of XCO2 enhancements
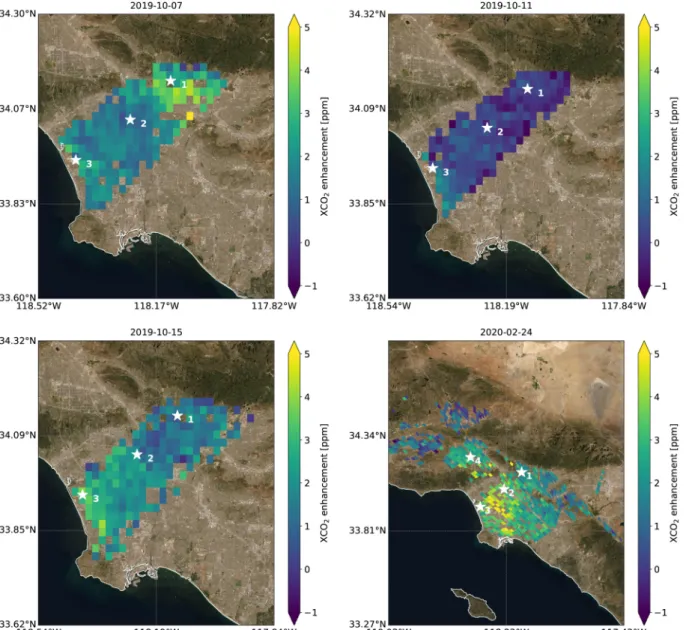
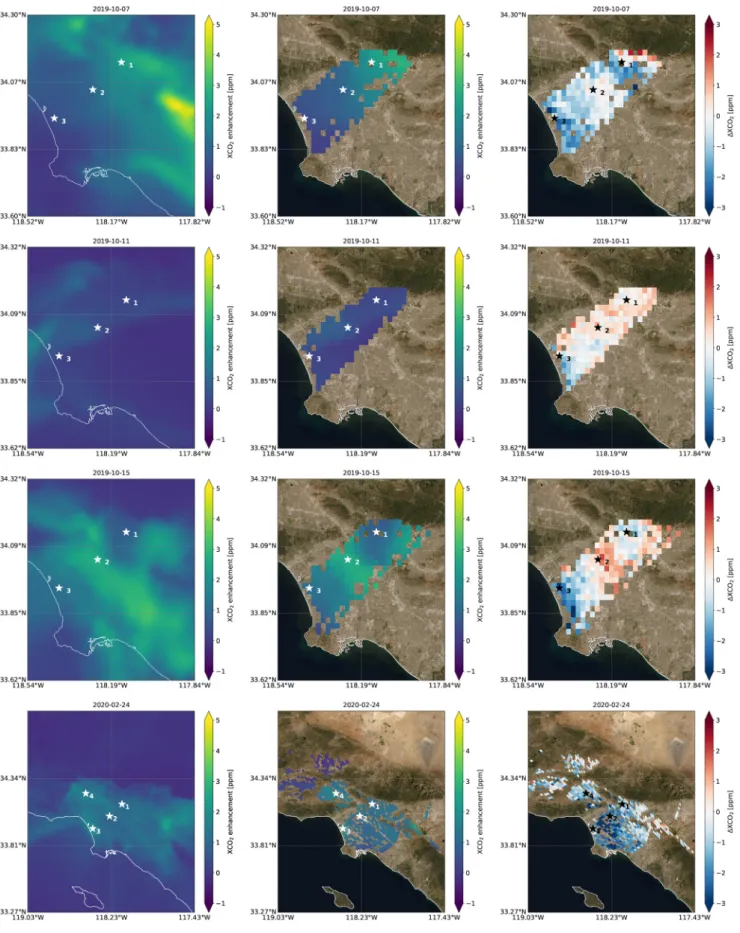
Fig. 3 shows XCO2 enhancements over LA for the four OCO-3
over-passes. We aggregate target mode data into 0.02∘ × 0.02∘ latitude-
longitude grid cells for better visualization of the overlapping swaths. The observed XCO2 enhancements over LA show different spatial
distri-butions on all four days. In the following, we describe the observed intra- urban variability of XCO2 enhancements over LA sorted by complexity
(simple to complex). Unless otherwise stated, we propagate the vari-ability of the OCO-3 XCO2 values within each sub region (defined in Fig.
A.11) and the TCCON XCO2 background uncertainty to calculate XCO2
enhancement uncertainties.
On October 15, 2019, XCO2 enhancements over LA are on average
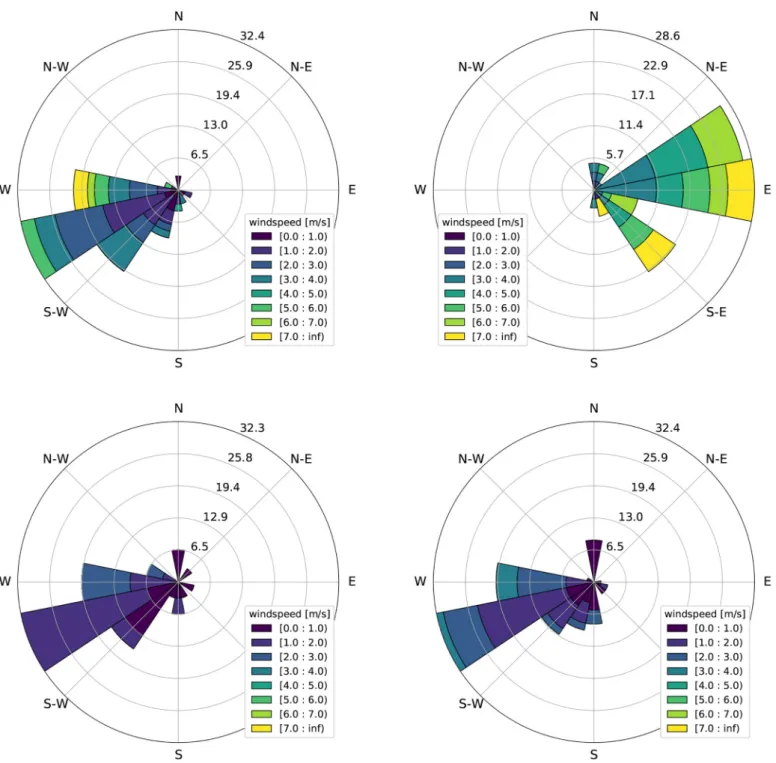
1.79 ± 0.80 ppm, with the largest enhancements over the industrial coastal area (2.71 ± 0.71 ppm). SCAQMD and NCEP stations measured onshore winds (coming from west-south-west direction) with moderate wind speeds of 2− 3 m/s within ±2 hours of the OCO-3 overpass (see Fig. 4).
On February 24, 2020, the wind stations measured slightly larger wind speeds (3− 4 m/s), pushing airmasses (volumes of air) from the coast towards the southern urban city core, where the average enhancement is 2.88 ± 1.11 ppm with single sounding XCO2
Table 1
Summary of the OCO-3 target and SAM observations over LA. Date Time (local) Mode # Swaths Ntotal Covered Area
Oct. 7, 2019 12:50 target 5 465 ≃20 × 40 km2 Oct. 11, 2019 11:12 target 5 519 ≃17 × 40 km2 Oct. 15, 2019 09:35 target 6 442 ≃20 × 40 km2 Feb. 24, 2020 12:00 SAM 5 659 ≃2300 km2 (total)
enhancements of up to 6 ppm. The average enhancement over the valley is 1.39 ± 1.23 ppm and 1.82 ± 0.77 ppm over the suburbs.
On October 7, 2019, XCO2 enhancements are on average 1.72 ± 0.88
ppm over the entire city. The largest enhancements occur over the suburban area with individual measurements reaching enhancements of up to 6.37 ± 0.59 ppm. Similar to the overpasses on October 15, 2019 and February 24, 2020, the surface wind stations measured onshore winds but with wind speeds partially exceeding 6 m/s. We assume that the strong onshore winds push airmasses from the coastal and urban areas towards the suburbs where the San Gabriel Mountains form a natural barrier and atmospheric CO2 accumulates.
On October 11, 2019, XCO2 enhancements are on average 0.21 ±
0.59 ppm over LA with the highest enhancements near the coast (1.09 ± 0.69 ppm) and negative enhancements over large parts of the city (e.g. as low as − 0.89 ± 0.41 ppm for individual measurements over the suburbs). As discussed in the previous section, wind data from the NCEP and SCAQMD ground based networks indicate Santa Ana like conditions with the wind traveling from east to west and wind speeds exceeding 10 m/s, pushing airmasses out of the LA Basin over the Pacific Ocean. HYSPLIT model runs indicate that the easterly winds push clean air from higher altitudes (up to 1500 m a.s.l.) into the LA Basin which causes negative XCO2 enhancements (not shown here).
3.4. Comparisons to co-located TROPOMI NO2 measurements
Multiple studies demonstrated the usefulness of regionally co- located satellite observations of NO2 and XCO2 (Reuter et al. 2014; Hakkarainen et al. 2019). For example, Reuter et al. (2019) used TRO-POMI’s NO2 data to identify OCO-2 XCO2 enhancements of localized (up
to city-scale) emissions. Here, we relate XCO2 from OCO-3 measurements
to co-emitted NO2 concentration as observed by TROPOMI to verify that
the observed XCO2 distributions represent a true signal that is driven by
local emissions.
The TROPOMI instrument collected data over LA within three hours of the OCO-3 overpass on three days analyzed here. On October 7, 2019 the TROPOMI overpass was ≃ 1 h after the OCO-3 overpass, and on October 11, 2019, ≃ 3 h after the OCO-3 overpass. On February 24, 2020, the TROPOMI overpass took place ≃ 25 min after the OCO-3 overpass. There is no co-located data within five hours of the OCO-3 overpass on October 15, 2019.
A direct comparison between data from both instruments is chal-lenging due to the short lifetime of NO2 and the temporal mismatch (in
addition to instrumental differences and sensitivities), however, the spatial distribution of TROPOMI’s NO2 over LA is similar to the spatial
distribution of XCO2 measured by OCO-3: higher NO2 concentrations
over the suburbs to the northeast on October 7, 2019; low NO2
con-centrations over large parts of the city on October 11, 2019; and enhanced NO2 concentration over the urban core on February 24, 2020
(see Fig. 5).
TROPOMI’s wide-swath NO2 measurements help to set the XCO2 city
enhancements into context. TROPOMI NO2 measurements are taken in
the UV–visible spectral region (425–465 nm) and are less sensitive to clouds and aerosols compared to OCO-3. The observed spatial correla-tion between both datasets suggests that the observed XCO2
enhance-ments over LA are dominated by local XCO2 emissions and are less likely
due to remaining artifacts in the OCO-3 vEarly XCO2 data product.
3.5. Summary
Our derived XCO2 enhancements of 0 − 6 ppm (with median
en-hancements under 2 ppm) over LA are in good agreement with previous studies (Wunch et al. 2009; Kort et al. 2012; Wong et al. 2015; Hedelius et al. 2018). On three days, the OCO-3 target and SAM observations capture XCO2 values that are comparable to background XCO2 values
measured at the AFRC TCCON site. This demonstrates that OCO-3’s multi-swath measurement approach reasonably captures city enhance-ments and background values at the same time on a single overpass. Moreover, OCO-3 measurements reveal fine-scale, intra-urban XCO2
variations over LA with unprecedented spatial coverage. Comparisons to data from NCEP and SCAQMD wind stations show that these fine-scale, intra-urban XCO2 variations are highly sensitive to the underlying
com-plex meteorological conditions in the LA Basin. Further, the observed intra-urban XCO2 variations are in good agreement with co-located
TROPOMI NO2 data. Data from both instruments show similar spatial
distributions over LA.
4. Validation against TCCON
TCCON is the primary validation source for the OCO-3 XCO2 data
product. Here, we compare OCO-3 XCO2 data collected during the target
and SAM measurements over LA with coincident TCCON XCO2 data from
the Caltech instrument located in Pasadena. The instrument is located in the suburbs north-east of the urban city center, an area that was sampled by OCO-3 during all four overpasses (see Fig. 3). For our analysis, we include OCO-3 soundings within ±0.1∘ in latitude and longitude (an area
of approximately 20 × 20 km2) around the Caltech TCCON instrument.
In the following, we compare absolute XCO2 values rather than XCO2
enhancements.
Fig. 2. XCO2 time series for the OCO-3 target and SAM observations. The individual swaths are up to ≃ 20 s long. The horizontal dashed line represents the AFRC
TCCON background XCO2 (the red shading indicates the background XCO2 uncertainty). XCO2 enhancements are indicated on the right-hand y-axis. The colors match
Fig. 3. OCO-3 XCO2 enhancements over LA for the three target mode measurements in October 2019 and the SAM observation on February 24, 2020. The target mode
measurements extend from the suburbs through the urban to the coastal area. In addition, the SAM observation collects data over the Valley. The markers indicate the Caltech TCCON instrument (⋆1), Downtown LA (⋆2), the Los Angeles International Airport (⋆3), and the San Fernando Valley (⋆4). Target mode data is aggregated
Fig. 4. Wind rose diagrams for October 7, 2019 (upper left), October 11, 2019 (upper right), October 15, 2019 (lower left), and February 24, 2020 (lower right) using
data from NCEP and SCAQMD surface wind stations within the LA Basin. Shown are wind directions and wind speeds within ±2 h of the OCO-3 overpass times. (For interpretation of the references to colour in this figure legend, the reader is referred to the web version of this article.)
We take TCCON data into account within ±30 min of the OCO-3 overpass time for all days except for October 11, 2019 when we expand the time window to ±2 h due to a limited number of TCCON measurements. To further improve our co-location criterion, we only take OCO-3 soundings into account along the line of sight (LOS) of the TCCON instrument. We apply an averaging kernel correction following O’Dell et al. (2018) and convolve the TCCON retrieved CO2 profile with
the OCO-3 column AK before comparing to OCO-3 data. The magnitude of the AK correction is on average 0.16 ppm. Finally, we calculate the median XCO2 value for each OCO-3 overpass and co-located TCCON data.
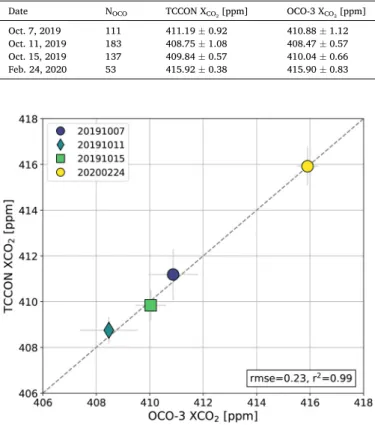
On all four days, the XCO2 values are in excellent agreement with the
TCCON data (see Table 2). The comparisons indicate a root mean square error (rmse) of 0.23 ppm and a nearly perfect correlation between both data sets (see Fig. 6). This comparison shows that OCO-3’s target and SAM observations capture the day to day variability of several ppm in XCO2 as seen by the TCCON instrument over Pasadena.
5. Model comparison
5.1. Sampling of model output
We choose the model output closest to the OCO-3 overpass time on each day and sample the modeled XCO2 enhancements at the location of
each OCO-3 footprint. For target overpasses we aggregate the sampled model data into 0.02∘ ×0.02∘ latitude-longitude grid cells. The median
XCO2 enhancements for each model and region are summarized in Fig. 7.
Maps of the modeled XCO2 enhancements, in native resolution and
sampled at the location of the OCO-3 footprints, as well as the differ-ences between modeled and OCO-3 XCO2 enhancements are depicted in Fig. 8 for WRF-Chem and Fig. 9 for X-STILT. Unless otherwise stated, we use the median of all soundings that fall into the valley, coastal, urban, and suburban region (see Fig. A.11) to describe enhancements and dif-ferences between model and observation. The reported uncertainties represent the variability of the modeled XCO2 values within each sub
region.
5.2. Comparison between modeled and observed intra-urban variability of XCO2
On October 7, 2019, modeled XCO2 enhancements agree within the
calculated errors over the suburbs. OCO-3 observed median XCO2
en-hancements of 3.07 ± 1.08 ppm. The WRF-Chem median enhancement is 2.30 ± 0.36 ppm over the suburbs and 1.84 ± 0.60 ppm for X-STILT over the same region (see Figs. 8 and 9). In contrast to the OCO-3 ob-servations, the median enhancement from X-STILT is larger over the urban area than over the suburbs or coastal region. Over the same region near the coast, WRF-Chem enhancements are significantly smaller (0.35 ±0.16 ppm) compared to OCO-3 (1.86 ± 0.65 ppm).
Nonetheless, the modeled enhancements capture most of the observed intra-urban variability. The full domain of the WRF-Chem model run (see Fig. 8, upper left) indicates a latitudinal and longitudi-nal shift (in south-east direction) between model and observation. This shift, which is likely driven by a combination of model transport errors and potential errors and biases in the emission inventory, demonstrates the model’s ability to capture intra-urban XCO2 gradients: larger XCO2
enhancements over the suburbs and decreasing through the urban core to the coast (see Fig. 7). The same holds for the X-STILT model run where a longitudinal shift (in north direction) is apparent between the modeled and observed XCO2 enhancement maps (see Fig. 9, upper left). On this
Fig. 5. TROPOMI NO2 tropospheric columns over LA on October 7 and 11, 2019 and on February 24, 2020. Markers represent the same locations as in Fig. 3.
Table 2
Measured XCO2 values by OCO-3 and Caltech TCCON over the suburban area
north-east of LA. NOCO indicates the number of individual OCO-3 soundings
contributing to the comparison on each day.
Date NOCO TCCON XCO2 [ppm] OCO-3 XCO2 [ppm]
Oct. 7, 2019 111 411.19 ± 0.92 410.88 ± 1.12 Oct. 11, 2019 183 408.75 ± 1.08 408.47 ± 0.57 Oct. 15, 2019 137 409.84 ± 0.57 410.04 ± 0.66 Feb. 24, 2020 53 415.92 ± 0.38 415.90 ± 0.83
Fig. 6. Relationship between the median XCO2 values for the four OCO-3 target,
SAM, and co-located TCCON observations. The dashed line represents the one- to-one line.
day, wind stations measured onshore winds within ±1 h of the OCO-3 overpass, whereas HYSPLIT back trajectory calculations up to 6 h prior to the OCO-3 overpass indicate complex circular winds, attesting the highly variable meteorological conditions in the LA Basin.
On October 11, 2019, both modeled XCO2 enhancements are in good
agreement with the space-based observations. The largest differences occur near the coast where OCO-3 enhancements (1.09 ± 0.69 ppm) appear higher than both models (WRF-Chem: 0.20 ± 0.12 ppm; X-STILT: 0.41 ± 0.08 ppm; see Fig. 7). The simulated full domains of both models indicate that the strong easterly winds carry urban emissions out over the Pacific Ocean.
On October 15, 2019, modeled XCO2 enhancements agree well over
the urban region (OCO-3: 1.91 ± 0.70 ppm; WRF-Chem: 1.84 ± 0.53 ppm; X-STILT: 1.95 ± 0.63 ppm). Over the coastal region, both modeled XCO2 enhancements are biased low against the observation. On this day,
the OCO-3 overpass took place in the morning (≃ 9:35 PDT). For LA, the marine boundary layer traps nighttime emissions in the basin for several hours until the Planetary Boundary Layer (PBL) collapses after the sun heats up the surface and speeds up the vertical mixing. This usually happens around local noon (Feng et al. 2016). Simulating the correct PBL height is challenging for many models. Moreover, the full domain of the X-STILT simulation (see Fig. 9, third row left) shows individual XCO2
plumes near the coast that are directed towards the Pacific Ocean. This is in contrast to the surface wind measurements that suggest onshore winds during the time of the overpass. This indicates a wind direction bias between the driving HRRR meteorological fields and the SCAQMD and NCEP surface measurements and is likely to cause lower than observed XCO2 enhancements over the suburbs and near the coast.
On February 24, 2020, both models underestimate the observed enhancements over the entire scene (OCO-3: 2.11 ± 1.28 ppm; WRF- Chem: 1.06 ± 0.53 ppm; X-STILT: 0.89 ± 0.77 ppm). The largest bias is over the urban and coastal areas with modeled XCO2 enhancements
lower than the observation. The same holds for the suburbs and valley but with smaller differences between model and observation. Even though both models underestimate the absolute observed XCO2
en-hancements, they capture the relative spatial variability over LA as observed by OCO-3: low XCO2 enhancements over the suburbs and
increasing through the urban core to the coastal area and, as expected, smaller enhancements in the less populated valley.
5.3. X-STILT-based emission source attribution
Here, we use the X-STILT model to allocate observed XCO2
en-hancements to surface-based sources. These sources, represented by ODIAC2019, have the potential to contribute to modeled XCO2
en-hancements. Using X-STILT’s unique backwards-in-time approach, contributing surface sources are identified for each modeled XCO2 value
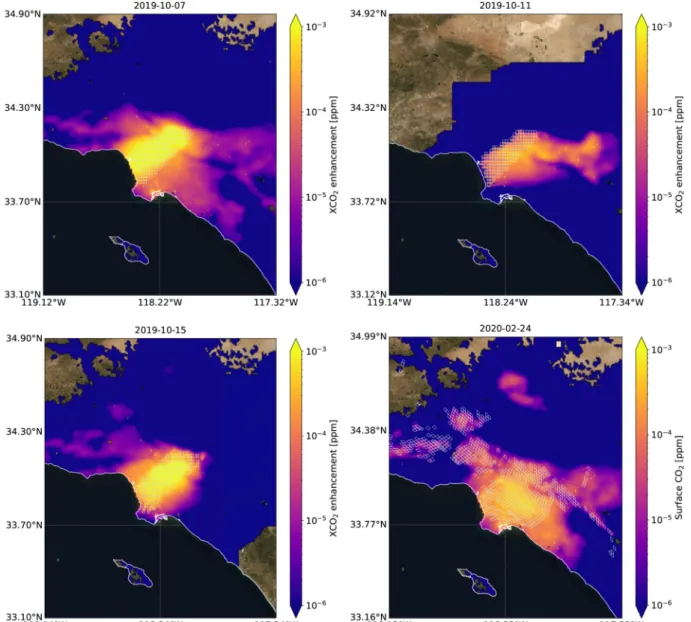
at each receptor in the domain (see Fig. 9, left column). After sampling this domain at individual OCO-3 sounding locations (i.e., receptors), associated surface contributions are summed for each receptor, and then divided by the number of receptors within the domain. Fig. 10 shows the spatially resolved XCO2 enhancements due to the various emission
sources across LA for the suite of OCO-3 measurement receptors, on average.
In the three target mode cases, the contributing surface sources lie directly below the OCO-3 track. CO2 emitted from these sources has
little time to undergo advective transport. Thus, anthropogenic sources in these regions will contribute the most to observations. Surface emissions from the 24 h period leading up to the overpass time are also included. The lower surface CO2 emissions to the northwest and
southeast demonstrate the complex meteorology associated with the LA Basin.
The effects of the Santa Ana winds are also evident in surface con-tributions. On two occasions (October 7, 2019 and October 15, 2019), surface contributions originate from the San Fernando Valley to the northwest and along the coast to the southeast. The wind fields on both days appear relatively calm, however, on October 11, 2019, the surface CO2 contribution arrives predominantly from the east of the target
overpass. This corresponds to strong easterly Santa Ana winds. These winds minimize CO2 from the San Fernando Valley and coastal region.
The three target observations demonstrate that even though space-based XCO2 measurements are collected in consistent geographic regions, the
sources of XCO2 enhancements are highly variable.
Expanding beyond target observations, the unique SAM mode that OCO-3 offers sees more surface CO2 emissions than alternative sampling
modes. The SAM mode case included in Fig. 10 collects higher magni-tudes of surface emissions over larger areas than target mode observa-tions. These larger areas are useful for measuring rural-to-urban and sub-city gradients in addition to XCO2 regional background values.
Further, we analyze how much more of the CO2 surface emissions are
captured by OCO-3’s SAM measurements compared to a single nadir Fig. 7. Observed and modeled XCO2 enhancements over LA and for the suburban, urban, and coastal regions. The boxes extend from the first quartile Q1 (25th
percentile) to the third quartile Q3 (75th percentile) of the data. The red horizontal line in each box indicates the median enhancement. The whiskers show the range of the data defined as 1.5 ⋅ (Q3 − Q1). Outliers are marked as’×’. (For interpretation of the references to colour in this figure legend, the reader is referred to the web version of this article.)
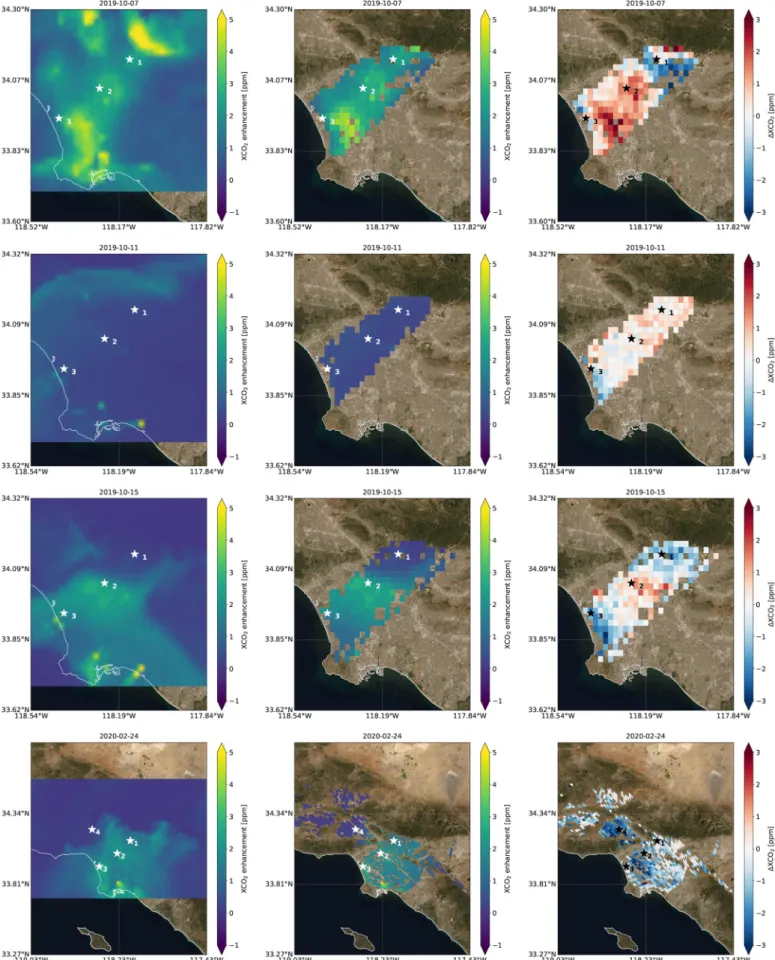
Fig. 8. WRF-Chem XCO2 enhancements over LA on October 7, 2019 (first row), October 11, 2019 (second row), October 15 (third row), and February 24, 2020
(fourth row). Shown are the simulated XCO2 enhancements over the Greater LA Metropolitan Area in native spatial resolution (left column), sampled at the OCO-3
footprint locations (center column), and the difference between WRF-Chem and observed OCO-3 XCO2 enhancements (Δ XCO2 defined as model minus observation,
Fig. 10. Surface-based sources of CO2 contributing to modeled XCO2 values, as informed by X-STILT and ODIAC. Shown are the averaged contributions (in ppm)
contributing to the overall mean of the modeled XCO2 in the domain. Values are gridded at the resolution of the ODIAC emission inventory (1 × 1 km2). The white
track over LA. For that, we calculate the individual, relative, surface emission contributions to the mean multi-swath XCO2 value that is
modeled by X-STILT (see Fig. A.12, left). Then, we calculate relative surface emission contributions for a single swath overpass. For that, we choose the center swath of the OCO-3 SAM observation on Feb. 24, 2020 to mimic a single nadir track over LA (see Fig. A.12, right). The com-parison shows that the adjacent swaths of OCO-3’s SAM observation capture about three times as much of the CO2 surface emissions
compared to a single nadir track over LA. OCO-3’s high-resolution sub- city observations provide insights into the variability of urban CO2
contributions and can pave the way towards localized emission reduc-tion strategies.
5.4. Discussion
The magnitude of the observed XCO2 enhancements over LA is in good
agreement with modeled enhancements from WRF-Chem and X-STILT. Median XCO2 differences between model and observation are typically
below 1 ppm over LA, with larger differences for some sub regions. The uncertainty spread is larger for OCO-3 than for both models and, in general, largest when XCO2 enhancements are large as well. Model
transport errors can result in latitudinal and longitudinal shifts between modeled and observed XCO2 maps. Nonetheless, both models are able to
capture intra-urban XCO2 gradients similar to the OCO-3 observations.
The spatial distribution of XCO2 over LA is caused by a combination of
different meteorological conditions (wind speed, wind direction, PBL height, vertical mixing, etc.) over a time span of hours. It is challenging to fully capture these complex conditions by models. For example, even small biases in the modeled wind speeds and wind directions can results in differences between model and observation of the order of several ppm (Feng et al. 2016).
As discussed in Sect. 3.2, the underlying biospheric fluxes are small for the area and time period analyzed here. However, this is not necessarily true during the height of the growing season (May–July). During this time, a potential biospheric uptake outside of the urban region might lower the background XCO2 and urban enhancements may
appear larger. Further, we assume that both city and background are affected similarly by biospheric activity. On the other hand, a study analyzing flask samples of isotopic 14CO2 in the LA Basin indicates that
biospheric fluxes can contribute to surface CO2 enhancements by up to
20%, especially during the northern hemisphere winter season (Miller et al. 2020). In the future, continuous measurements of urban biosphere fluxes are needed to further study the impact of lawns, parks, or golf courses in the city on anthropogenic emission signals.
On all four days, both models tend to underestimate the observed XCO2 enhancements near the coast where most of the point sources are
located. We cannot rule out that a small portion of the model- observation differences are driven by potential biases in emission esti-mates and spatial distributions in the ODIAC2019 emission inventory (Gurney et al. 2019; Oda et al. 2019). In this study, we use monthly ODIAC2019 fossil fuel emission estimates without hourly scaling ( Nas-sar et al. 2013). Emissions in megacities have typically two peaks during the morning and afternoon traffic and a daytime minimum around local noon. However, this effect is rather small and contributes minimally (≃ 0.2 ppm) to the model-observation differences. The lack of explicit traffic emissions in the ODIAC2019 inventory is also unlikely to cause the observed differences. We do not see significant intra-urban scale differences particularly due to traffic when we compare WRF-Chem simulation over LA using ODIAC2019 and Hestia (Oda et al., 2021, not shown here). In general, model-observation differences can be due to the errors in the transport, emissions, and observation itself, or all combined and will be investigated in future studies.
Analyzing X-STILT’s source-receptor sensitivities, the sensitivity of downwind CO2 variations to upwind fluxes, show that OCO-3’s SAM
observations capture about three times as much of the city emissions compared to single-swath overpasses. Future studies using OCO-3 target
and SAM observations will help to constrain city emissions on sub-city scales and offer insights to examine potential errors and biases in emission inventories.
6. Summary
OCO-3’s multi-swath measurement approach allows collection of dense maps of XCO2 over emission hot spots and is potentially able to
capture intra-urban XCO2 variations from space with unprecedented
spatial resolution. Here, we presented and analyzed XCO2 distributions
over LA derived from target and SAM mode observations taken by OCO- 3. The observed XCO2 distributions over LA are highly sensitive to the
underlying, complex meteorological conditions. XCO2 measurements
over the suburbs, located north east of LA, show excellent agreement with TCCON XCO2 measurements collected in Pasadena, CA. We
calcu-lated XCO2 city enhancements using AFRC TCCON XCO2 measurements as
clean background values. Our derived enhancements of 0− 6 ppm are in good agreement with previous studies. On three days, the OCO-3 target and SAM observations were not only able to reveal unique intra-urban XCO2 distributions over LA, but also captured XCO2 values that agree with
background concentration measured by the AFRC TCCON instrument. This demonstrates that OCO-3’s multi-swath measurement approach is able to capture city enhancements and background values at the same time on only one single overpass. Comparisons of the observed and modeled XCO2 enhancements from two independent models (WRF-Chem
and X-STILT) show an overall good agreement. Median XCO2 differences
between model and observation are typically below 1 ppm over LA with larger differences over some sub regions. Both models are able to cap-ture the observed intra-urban XCO2 gradients. Analyzing X-STILT’s
source-receptor sensitivities, we found that OCO-3’s SAM observations capture about three times as much of the city emissions compared to single-swath overpasses. The source-receptor sensitivity study also shows that even though space-based XCO2 measurements are collected
over the same region, the sources of XCO2 enhancements are highly
variable. OCO-3’s SAM and target mode measurements provide an innovative dataset for carbon studies on sub-city scale. The emission coverage by OCO-3 will help to constrain urban emissions at finer spatiotemporal scales, especially in regions with limited ground-based monitoring capabilities. This work shows that future wide-swath CO2
missions with OCO-3 type dense sampling and short revisit times, for example GeoCarb (Moore III et al. 2018), AimNorth (Nassar et al. 2019), or CO2M (Sierk et al. 2019), can play a major role in quantifying en-hancements over urban areas, potentially monitoring the effectiveness and progress of localized CO2 emission reduction policies.
Author contributions
M.K.: Conceptualization, Methodology, Formal analysis, Investiga-tion, Software, ValidaInvestiga-tion, VisualizaInvestiga-tion, Writing - original draft; Writing - review & editing; A.E.: Conceptualization, Methodology, Project administration, Supervision, Writing - review & editing; D.D.R.: Formal analysis, Investigation, Visualization, Writing - review & editing; J.C.L.: Conceptualization, Methodology, Supervision, Writing - review & editing; S.F.: Conceptualization, Methodology, Supervision, Writing - review & editing; R.L.: Formal analysis, Investigation, Visualization, Writing - review & editing; T.L.: Conceptualization, Methodology, Su-pervision, Writing - review & editing; T.O.: Conceptualization, Meth-odology, Writing - review & editing; C.M.R.: Resources, Data curation, Writing - review & editing; J.F.B.: Resources, Data curation, Writing - review & editing; L.T.I.: Resources, Data curation, Writing - review & editing.
Declaration of Competing Interest
Acknowledgements
We thank Paul O. Wennberg for contributions, guidance, and support of the Caltech TCCON measurements. We thank James Podolske for contributions and technical support of the AFRC TCCON instrument. Part of the research described in this paper was carried out at the Jet Propulsion Laboratory, California Institute of Technology, under a contract with the National Aeronautics and Space Administration (NASA) [prime contract number 80NM0018D0004]. D.D.R. and J.C.L. were supported by the NASA base grant no. 80NSSC19K0196. S.F. and R.L. have been funded jointly by the NASA grant no. 80NSSC18K1313 (subcontracted from the Universities Space Research Association #05783–01 to Penn State). T.L. was supported by the French research program Make Our Planet Great Again (Project CIUDAD). T.O. was
supported by the NASA Carbon Cycle Science Program (grant no. NNX14AM76G) and the Orbiting Carbon Observatory mission (grant no. 80NSSC18K1313). C.M.R. was supported by NASA’s Carbon Cycle and Ecosystems research program (grant no. NNX17AE15G). Sentinel-5 Precursor is a European Space Agency (ESA) mission on behalf of the European Commission (EC). The TROPOMI payload is a joint develop-ment by ESA and the Netherlands Space Office (NSO). The Sentinel-5 Precursor ground-segment development has been funded by ESA and with national contributions from the Netherlands, Germany and Belgium. Contains modified Copernicus Sentinel data 2019–2020.
Appendix A. Additional figures
References
Alexander, C.R., Weygandt, S., Smirnova, T., Benjamin, S., Hofmann, P., James, E., Koch, D., 2010. High Resolution Rapid Refresh (HRRR): Recent Enhancements and Evaluation during the 2010 Convective Season.
Borsdorff, T., aan de Brugh, J., Hu, H., Hasekamp, O., Sussmann, R., Rettinger, M., Hase, F., Gross, J., Schneider, M., Garcia, O., Stremme, W., Grutter, M., Feist, D.G., Arnold, S.G., De Mazi`ere, M., Kumar Sha, M., Pollard, D.F., Kiel, M., Roehl, C., Wennberg, P.O., Toon, G.C., Landgraf, J., 2018. Mapping carbon monoxide pollution from space down to city scales with daily global coverage. Atmos. Measure. Tech. 11, 5507–5518. https://doi.org/10.5194/amt-11-5507-2018.
Brioude, J., Angevine, W.M., Ahmadov, R., Kim, S.W., Evan, S., McKeen, S.A., Hsie, E.Y., Frost, G.J., Neuman, J.A., Pollack, I.B., Peischl, J., Ryerson, T.B., Holloway, J., Brown, S.S., Nowak, J.B., Roberts, J.M., Wofsy, S.C., Santoni, G.W., Oda, T., Trainer, M., 2013. Top-down estimate of surface flux in the Los Angeles Basin using a mesoscale inverse modeling technique: assessing anthropogenic emissions of CO, NOx and CO2 and their impacts. Atmos. Chem. Phys. 13, 3661–3677. https://doi.
org/10.5194/acp-13-3661-2013.
Chilingar, G.V., Endres, B., 2005. Environmental hazards posed by the los Angeles basin urban oilfields: an historical perspective of lessons learned. Environ. Geol. 47, 302–317. https://doi.org/10.1007/s00254-004-1159-0.
Crisp, D., Pollock, H.R., Rosenberg, R., Chapsky, L., Lee, R.A.M., Oyafuso, F.A., Frankenberg, C., O’Dell, C.W., Bruegge, C.J., Doran, G.B., Eldering, A., Fisher, B.M., Fu, D., Gunson, M.R., Mandrake, L., Osterman, G.B., Schwandner, F.M., Sun, K., Taylor, T.E., Wennberg, P.O., Wunch, D., 2017. The on-orbit performance of the orbiting carbon Observatory-2 (OCO-2) instrument and its radiometrically calibrated products. Atmos. Measure. Tech. 10, 59–81. https://doi.org/10.5194/amt-10-59- 2017.
Deng, A., Stauffer, D.R., 2006. On improving 4-km mesoscale model simulations. J. Appl. Meteorol. Climatol. 45, 361–381. https://doi.org/10.1175/JAM2341.1.
Eldering, A., Wennberg, P.O., Crisp, D., Schimel, D.S., Gunson, M.R., Chatterjee, A., Liu, J., Schwandner, F.M., Sun, Y., O’Dell, C.W., Frankenberg, C., Taylor, T., Fisher, B., Osterman, G.B., Wunch, D., Hakkarainen, J., Tamminen, J., Weir, B., 2017. The orbiting carbon observatory-2 early science investigations of regional carbon dioxide fluxes. Science 358. https://doi.org/10.1126/science.aam5745. Eldering, A., Taylor, T.E., O’Dell, C.W., Pavlick, R., 2019. The OCO-3 mission:
measurement objectives and expected performance based on 1 year of simulated data. Atmos. Measure. Tech. 12, 2341–2370. https://doi.org/10.5194/amt-12-2341- 2019.
Fasoli, B., Lin, J.C., Bowling, D.R., Mitchell, L., Mendoza, D., 2018. Simulating atmospheric tracer concentrations for spatially distributed receptors: updates to the stochastic time-inverted Lagrangian transport model’s R interface (STILT-R version 2). Geosci. Model Dev. 11, 2813–2824. https://doi.org/10.5194/gmd-11-2813- 2018.
Feng, S., Lauvaux, T., Newman, S., Rao, P., Ahmadov, R., Deng, A., Díaz-Isaac, L.I., Duren, R.M., Fischer, M.L., Gerbig, C., Gurney, K.R., Huang, J., Jeong, S., Li, Z., Miller, C.E., O’Keeffe, D., Patarasuk, R., Sander, S.P., Song, Y., Wong, K.W., Yung, Y. L., 2016. Los Angeles megacity: a high-resolution land–atmosphere modelling system for urban co2 emissions. Atmos. Chem. Phys. 16, 9019–9045. https://doi.
org/10.5194/acp-16-9019-2016.
Frankenberg, C., Fisher, J.B., Worden, J., Badgley, G., Saatchi, S.S., Lee, J.E., Toon, G.C., Butz, A., Jung, M., Kuze, A., Yokota, T., 2011. New global observations of the terrestrial carbon cycle from GOSAT: patterns of plant fluorescence with gross primary productivity. Geophys. Res. Lett. 38 https://doi.org/10.1029/ 2011GL048738.
van Geffen, J.H.G.M., Eskes, H.J., Boersma, K.F., Massakkers, J.D., Veefkind, J.P., 2019. TROPOMI ATBD of the total and tropospheric NO2 data products. In: Algorithm Theoretical Basis Document S5P-KNMI-L2–0005-RP. Royal Netherlands Meteorological Institute.
Gurney, K.R., Liang, J., O’Keeffe, D., Patarasuk, R., Hutchins, M., Huang, J., Rao, P., Song, Y., 2019. Comparison of global downscaled versus bottom-up fossil fuel co2 emissions at the urban scale in four u.s. urban areas. J. Geophys. Res. Atmos. 124, 2823–2840. https://doi.org/10.1029/2018JD028859.
Hakkarainen, J., Ialongo, I., Maksyutov, S., Crisp, D., 2019. Analysis of four years of global XCO2 anomalies as seen by orbiting carbon Observatory-2. Remote Sens. 11,
850. https://doi.org/10.3390/rs11070850.
Hedelius, J.K., Liu, J., Oda, T., Maksyutov, S., Roehl, C.M., Iraci, L.T., Podolske, J.R., Hillyard, P.W., Liang, J., Gurney, K.R., Wunch, D., Wennberg, P.O., 2018. Southern California megacity CO2, CH4, and CO flux estimates using ground- and space-based
remote sensing and a Lagrangian model. Atmos. Chem. Phys. 18, 16271–16291.
https://doi.org/10.5194/acp-18-16271-2018.
Hedelius, J.K., He, T.L., Jones, D.B.A., Baier, B.C., Buchholz, R.R., De Mazi`ere, M., Deutscher, N.M., Dubey, M.K., Feist, D.G., Griffith, D.W.T., Hase, F., Iraci, L.T., Jeseck, P., Kiel, M., Kivi, R., Liu, C., Morino, I., Notholt, J., Oh, Y.S., Ohyama, H., Pollard, D.F., Rettinger, M., Roche, S., Roehl, C.M., Schneider, M., Shiomi, K., Strong, K., Sussmann, R., Sweeney, C., T´e, Y., Uchino, O., Velazco, V.A., Wang, W., Warneke, T., Wennberg, P.O., Worden, H.M., Wunch, D., 2019. Evaluation of MOPITT version 7 joint TIR–NIR Xco retrievals with TCCON. Atmos. Measure. Tech.
12, 5547–5572. https://doi.org/10.5194/amt-12-5547-2019.
Hersbach, H., Bell, B., Berrisford, P., Hirahara, S., Hor´anyi, A., Mu˜noz-Sabater, J., Nicolas, J., Peubey, C., Radu, R., Schepers, D., Simmons, A., Soci, C., Abdalla, S., Abellan, X., Balsamo, G., Bechtold, P., Biavati, G., Bidlot, J., Bonavita, M., De Chiara, G., Dahlgren, P., Dee, D., Diamantakis, M., Dragani, R., Flemming, J., Forbes, R., Fuentes, M., Geer, A., Haimberger, L., Healy, S., Hogan, R.J., H´olm, E., Janiskov´a, M., Keeley, S., Laloyaux, P., Lopez, P., Lupu, C., Radnoti, G., de Fig. A.12: Relative surface contributions to the total averaged XCO2 value as determined by X-STILT for the February 24, 2020 SAM observation (left) and for the
center swath of the same SAM observation mimicking a single nadir track over the LA megacity. The relative surface influence values add up to 100% for the SAM and to ≃ 32% for the single nadir track. Values are gridded at the resolution of the ODIAC emission inventory (1 × 1 km2). The white polygons indicate the position of the
![[PDF] Cours pdf de PL/SQL exceptions et erreurs BD | Formation informatique](data:image/gif;base64,R0lGODlhAQABAIAAAP///wAAACH5BAEAAAAALAAAAAABAAEAAAICRAEAOw==)