Analyzing Patterns of Writing and Sketching in the Product Design Process by
Rebecca A. Smith
SUBMITTED TO THE DEPARTMENT OF MECHANICAL ENGINEERING IN PARTIAL FULFILLMENT OF THE REQUIREMENTS FOR THE DEGREE OF
BACHELOR OF SCIENCE IN MECHANICAL ENGINEERING AT THE
MASSACHUSETTS INSTITUTE OF TECHNOLOGY JUNE 2009
@ Rebecca A. Smith. All rights reserved.
The author hereby grants to MIT permission to reproduce and to distribute publicly paper and electronic copies of this thesis document in whole or in part in any medium
now known or hereafter created.
Signature of Author:
Department of Mechanical Engineering May 1, 2009 Certified by:
v • Maria Yang
__Assisant Professor of Mechanical Engineering Thesis Supervisor Accepted by:
Professor J. Lienhard V Collins Professor of Mechanical Engineering Chairman, Undergraduate Thesis Committee
MASSACHUSETTS INSTITE
OF TECHNOLOGY
SEP 1 6 2009
LIBRARIES
Acknowledgements
The author would like to thank Professor Maria Yang for all of her indispensable help, advice, mentorship and support throughout this research project.
The author would also like to thank Justin Lai for his help in facilitating access to all of the Design-a-palooza materials and information.
Finally, the author would like to thank the students of 2.97 for taking the class and using their design notebooks - with an especially large thanks to the students who dated their
Analyzing Patterns of Writing and Sketching in the Product Design Process by
Rebecca A. Smith
Submitted to the Department of Mechanical Engineering on May I I, 2009 in Partial Fulfillment of the Requirements for the Degree of Bachelor of Science in Mechanical
Engineering
ABSTRACT
Design notebooks, or logbooks, are typically used to record notes during the design process. These notes consist of text entries as well as sketches with varying levels of detail. Previous research on the design process has focused on sketches, including their effect on design outcome, differences based on prior sketching experience, and more. This paper looks at the interplay between text entries and sketches in design notebooks, and analyzes patterns that appear over the course of the design process. Data collected from eighteen logbooks from the class Design-a-palooza shows that trends exist between writings and drawings in the design process. The results of analysis of this data show that the number of sketches in a logbook increases following drawing instruction, and the design process typically starts with more text entries in logbooks, including customer needs research, followed by this increased number of sketches and then a decrease in all entries as prototyping occurs. The analysis was inconclusive in
determining if students who write more ideas with text will sketch fewer ideas, as well as the relationship between partners' logbook entries. Recommendations for future
research in these areas of design research are presented.
Thesis Supervisor: Maria Yang
Table of Contents
I. Introduction ... ... 5
2. Background/Literature Review ... 6
3. M ethods ... 8
4. Results and Discussion ... I 4. I. Overview ... II 4.2. Entries over time ... ... ... 12
4.3. Chindogu trends ... 16
4.4. W riting versus sketching product ideas ... 18
5. Conclusion ... 20
6. Future W ork ... .. 22
7. References ... 23
I. Introduction
Much research has been done on the product design process, by analyzing design notebooks, prototypes, and outcomes such as grades or awards. Past research has looked at relationships between drawings, prototypes and grades, but the purpose of this research is to analyze the relationship between drawings and writings in design notebooks. The research uses logbooks from the class 2.97, or Design-a-palooza'. Design-a-palooza, taught at the Massachusetts Institute of Technology for two weeks in January 2009 and sponsored by the Department of Mechanical Engineering, introduces creativity, product design, user needs, prototyping, concept generation and selection to students of all years and majors. The main project in the class had students work with a partner to design and prototype an item, made primarily from cardboard, that could be used in everyday student life. Later in the class, students designed Chindogu items with different partners. Chindogu is an 'artform' that combines function, humor and impracticality into a product. For all projects there were 9 teams made up of two students each, who were assigned to work together. Students ranged in class year from graduate students to freshmen, and came from a variety of backgrounds, such as Mechanical Engineering, Electrical Engineering and Architecture. Each student was given a design notebook to use for the class, which was collected at the end of the class. Students were aware that the logbooks would possibly be used for research purposes.
Following the class, the design notebooks were examined methodically.
For analysis, several sources of data were available. The logbooks were collected for all students, and digital photographs were taken of the prototypes each day. Additionally, each pair had to write a final paper about their product and their class experiences and give a final presentation, which was recorded.
Entries in design notebooks were coded into specific categories by date and analyzed for trends. The research examined whether patterns of drawings and writings in logbooks changed over time.
The research was designed to explore several questions:
* What is an effective way to code/analyze design notebooks?
* Is there a relation between drawings and text in the design process?
* When working with a partner, is there a relationship between partners' logbook entries?
* Do students who make text-only lists of ideas tend to have fewer drawings in their design notebooks?
2. Background/Literature Review
While research work has been done with sketching analysis during the design process, there has been considerably less dealing with text. In coding design notebooks entries from Design-a-palooza, it was helpful to look at previous researchers' characterization techniques. Researchers' results also helped to support findings and hypotheses.
The 1990 paper The Importance of Drawing in the Mechanical Design Process2, by David G. UlIman, Stephen Wood and David Craig, is a well-known paper in the field of design, focusing on drawing as a necessary part of the design process. The research looks at engineers' 'marks-on-paper,' which are support notations (textual notes, lists, dimensions, and calculations) or graphic representations (drawings of object and their functions; plots and charts). Ullman et al find that drawing is the preferred 'method of external representation': of 363 marks on paper that were observed and analyzed, 72% were sketching or drafting, 14% were dimensions for drawings, 9% were text, and 5% were calculations. Of the drawings, 67% were sketches, with each sketch taking an average length of eight seconds to create.
Song and Agogino's 2004 paper, Insights on Designers' Sketching Activities in Product Design
Teams3, examines sketches from logbooks. Their findings show that thinking sketches are the dominant type of sketch throughout the design life cycle. They saw a marked increase in level of detail of the sketches as the design moved from the initial preliminary stage through conceptual to detailed design.
An Analysis of Sketching Skill and Its Role in Early Stage Engineering Design4, written by Maria C. Yang and Jorge G. Cham in 2007, looks at the role of sketching skill in engineering design. Research findings suggest that there is an important interplay between the designer's ability to sketch and the ability to visualize in their heads or through prototypes. Designers who are given sketch instruction tend to draw more overall. Additionally, students working in teams that select an individual to complete drawing tasks tended to assign the strongest drawer of the group to the tasks.
In his book Engineering and the Mind's Eyes, Eugene S. Ferguson writes that the designer 'uses sketches to try out new ideas, to compare alternatives, and (this is important) to capture fleeting ideas on paper.' He breaks designers' sketches into three categories: thinking, prescriptive, and talking sketches. Thinking sketches are used to clarify visions in minds' eyes. Prescriptive sketches are sometimes scaled, and made by an engineer to direct a drafter in making a finished drawing. Talking sketches are produced constantly in exchanges between technical people. They are spontaneously drawn during discussion with colleagues, and make it easier to explain a technical point.
In Vinod Goel's book Sketches of Thought6, he defines two types of transformations for sketches in problem-solving phases. Lateral transformations involve movement from one idea to a slightly different idea, or a reorganization of the initial idea. Vertical transformations have movement from one idea to a more detailed version of the same idea. There is no modification of the previous idea, only clarification of lines and addition
of detail, such as dimensions. Lateral transformations are generally confined to preliminary design phases, while vertical transformations generally occur in the refinement and detailing phases. Goel writes that 'multiple problem-solving phases are required not only because of the size and complexity of design problems but because of the quantitative shift in the nature of the information necessary to transform the input to the output.'
The research presented in this paper differs from previous work in that it focuses on analysis of both text and sketches in design notebooks.
3. Methods
Each of the 18 students' lab notebooks were analyzed and coded after the conclusion of the class. For each notebook, entries were coded based on date and content. The notebook information was broken into several categories: thinking drawings; talking drawings; planning drawings; class notes; class drawings; observations/needs/bugs; idea lists; to-do lists; and 'other' text. The data from this analysis was collected in an Excel spreadsheet.
To determine whether drawings were thinking sketches, talking sketches, or planning sketches, criteria suggested by S. Ferguson was utilized. Ferguson defines a thinking sketch as one that is used to clarify the designer's vision in their mind's eye. For the 2.97 design notebooks, any drawings that were related to the design projects, rather than lectures and lessons, and seemed to have been used to quickly express an idea, were coded as thinking drawings. Examples of thinking sketches are shown in Figure I. Ferguson defines talking sketches as those that are produced in exchanges between technical people, and make it easier to explain a technical point. He imagines these sketches being used for colleagues to come to a common agreement on an idea, both contributing to the drawing as they talk. Unfortunately it was difficult to determine whether students in the class utilized this type of drawing, as this is not easily conveyed through the drawings in notebooks. For the purposes of this research, talking sketches refer to drawings that have been refined in order to express an idea to a person or group of people. This definition is similar to Goel's idea of vertical movements in sketches - ideas are not modified, but clarified and detailed in later versions of sketches.
For the context of this class, talking sketches were those that had been sketched larger, more cleanly, and in more detail than earlier iterations, and used to share ideas with peers. What I have referred to as planning sketches are similar to Ferguson's prescriptive sketches, or those that are made by an engineer to direct a drafter in making a finished drawing. Dimensioned drawings were coded as planning sketches, as they included information that was necessary for the prototyping and building of the
including problems and ideas for solving these.
Another category of entries dealt with observations and needs. Several class
another. These are lists of brainstormed product ideas, with text only - no sketches.
'other text.' This category encompassed any writings that did not fall into the other concepts, and plans for class presentations. Also included were notes on designs,
(
U
Figure 2. Page from a student's design notebook: example of class sketch.
To code each notebook, entries were grouped by date. A summary of the entries was written on a Post-It note on the first page of each day. Data noted was the date, page numbers of the entries, categories entries fell into, and number of entries per category. After coding an entire notebook, this information was inputted into an Excel spreadsheet. The eighteen notebooks were coded over a period of several weeks. Following this process, the data was sorted and analyzed.
~3
4. Results and Discussion
4. Overview
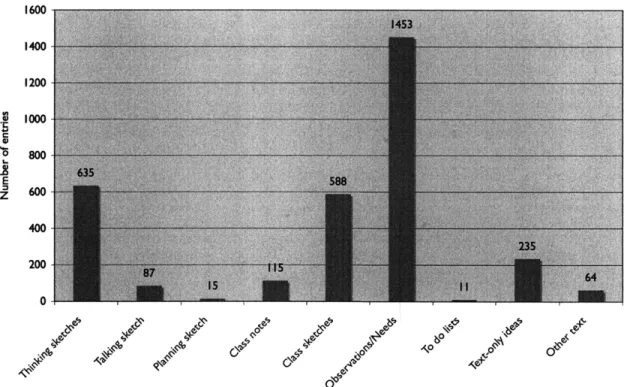
Having collected logbook data for all eighteen students, trends in the data have appeared and can be analyzed. Figure 3 shows the total logbook entries for the class, and Table I presents the sum of all total sketches and text entries for the eighteen students over the course of Design-a-palooza.
Total notebook entries
1600 1400 1200 1000 800 600 " C CO
sgdL
Jcr
4, O0 A, GC 4,b~ o(Figure 3. Total entries for all categories and all students during Design-a-palooza. Without class-related Without class-related and
All entries observation entries
Sketches 1325 737 737
Text 1878 1763 310
Table I. Sums of entries in various sketch and text categories.
The largest logbook category included text for observations, bugs and needs, with 1453 entries, or 45.4% of all entries. Class assignments involved writing a certain number of observations from an off-campus location, interviewing people for their 'bug lists,' and more. Because the theme of the cardboard design projects was decided upon by each student/pair, this information was useful in helping to determine areas of focus. A design project in an industry setting may be more defined from the beginning, so this much user interaction may not be necessary. Since the majority of the observations and needs are not related to the final project, if we remove these and the class notes from the total text entries, we see that the number of design-related drawings is greater than the
number of design-related text entries, which agrees with previous design research by Ullman et al.
Figure 4 shows the total number of entries for each student, color-coded by entry type. This allows us to see the variations between individuals in the class. While some students have less than 100 entries in their logbooks for the entirety of the class, others have greater than 100 entries for a single category, such as thinking sketches or observations. The data bars in Figure 4 are organized by partner - pairs are separated by marks on the x-axis. It is interesting that, while some pairs have very similar numbers of entries, others have great variance, such as students H and N. Section 4.4 includes further comparison of partners in the class.
Total notebook entries per student
400 300 200 . l0 cskethes 1 Plan tletch Tb*ingm *ethes to 0 ,
Figure 4. Total entries for each student, colored by category. 4.2 Entries over time
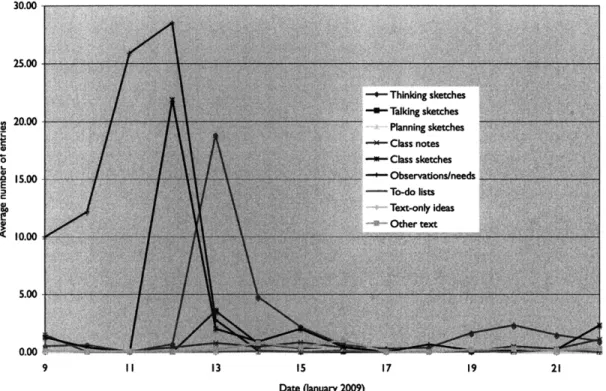
We can learn more about the design process by looking at how patterns between text and sketch entries are similar or different over time. Figure 5 shows a graph of the change in number of entries per day over time, for each category. The two-week-long class was split into two major segments: the first half focused on the cardboard project, and the second half featured three Chindogu projects. The cardboard projects were due on January 16, and final presentations for the class took place on January 22.
Average daily logbook entries (entire class), 2.97 30.00 25.00 -- Thinking sketches -- Talking sketches 2 0 .0 0 Planning sketches 2 2 Class notes "0 . -Class sketches I S.00 - ~ Observations/needs 2 --To-do ists S Text-only ideas Other text 10.00 5.00 - - - 10 - - -9 II 13 I5 17 19 21 Date (January 2009)
Figure 5. Average number of notebook entries per category for each day of the class. The trends in Figure 5 suggest that there is a common pattern of actions in design. For
Design-a-palooza, a spike in written observations and needs appeared at the beginning of the class. Soon after, on January 12, there was a class lesson on industrial design drawing techniques, and each student drew an average of almost 22 sketches on this day. The next spike was in thinking sketches. This suggests that giving students the skills to draw increases the likelihood that they will sketch ideas in the future. However, looking at
Figure 6, we see that there is not a clear correlation between the number of class sketches on the day of instruction by a student and the number of design sketches -thinking, talking or planning - by the same student in the following days. The students who had the most design sketches in the three days after the sketching lesson (the time period in which the bulk of the brainstorming assignments for the cardboard design project were completed) were primarily not the students who had the most sketches from the lesson in their notebooks. In fact, some of the students with high sketch counts compared to the class average drew very few design-related sketches in the following days. There are several possible reasons that the data does not support such a
relationship. The students in the class had greatly varying backgrounds in art, design and engineering, and some students had previous sketching experience and confidence coming into the class. Additionally, the number of class sketches was not necessarily indicative of the interest in or effect of the lesson: most students sketched the same things (parallel lines, circles, ellipses, cylinders and blocks, for example), but varying
amounts of each. Students appeared to fill up pages with many of the same items for each exercise, so those who drew larger or wanted more practice used more pages.
Class and project sketches 100 90' s80 Class sketches (112/09) 0 Design sketches (1/13/09-1/15/09) 70 " 60 z 30 20 10 4. 4. - - ' 4-10
Figure 6. Number of class sketches on January 12, 2009, along with number of design-related sketches in the three days following.
In Figure 5, we see that the number of entries in several categories appear to peak on specific days. Figure 7 combines the categories falling under the text and drawing labels and compares these for each day. Class sketches and notes were not included, as they were not directly related to the design projects.
From the data presented in Figure 7 we can see that at the beginning of the class, writing clearly dominates drawing. This makes sense, as the class lessons and assignments initially focused on gathering needs and bugs from which to determine what products would address these needs. Once students began brainstorming ideas for these products, the number of sketches surpassed the amount of writing produced. Then, when prototyping starts, students have far fewer entries in their design notebooks, as they move to building and testing physical models rather than planning. Figure 8, which shows how the design sketches are broken up into thinking, talking and planning sketches for each day, further supports this logic. Although students used thinking drawings primarily, the planning sketches that were written in the notebooks occurred on January 14, 15, 16 and 19, or around the time when building for the cardboard projects and Chindogu projects was starting. Planning sketches would be most useful before or concurrent with prototyping, as these drawings specify dimensions. It is interesting that during the Chindogu projects, the same drop-off in sketches did not occur during the time in which students were prototyping. This is likely due to the fact that, since students had a shorter amount of time to work on these
projects, they were concurrently brainstorming, sketching and prototyping. Figure 9 shows data for logbook entries from the time period during the Chindogu projects.
Sketches vs Text
600
500
400
N Sketches (not including class)
300 - Text (not including class)
300 z
1/9/09 1/10/09 1/11109 1/12/09 1113/09 1/14/09 1115/09 1/16/09 1/17/09 1/18/09 1/19/09 1/20/09 1/21/09 1/22/09 Date
Figure 7. Comparison of sketches or class notes. The trends, shown in consistent with previous
number of sketches and number of writings, not including class
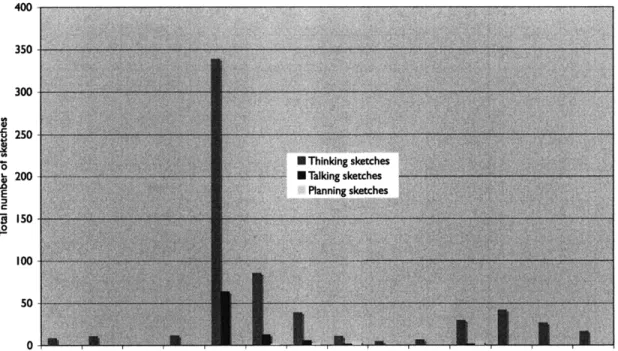
Figure 8, between the three types of design sketches are research into sketching. Thinking sketches are the primary type of sketch by a large degree. A huge spike in thinking sketches appears on January 13, the day after the class lesson on sketching, suggesting that providing this drawing instruction is a useful, if not necessary, strategy when teaching or practicing design. It is interesting that the number of talking sketches also reach their maximum on January 13. This implies that some students are refining their designs early on in the process. This may be attributed to working with partners: since thinking sketches are often quick sketches that may be unintelligible to people other than the designer, it may be necessary to clean these sketches up before presenting them to a partner for feedback.
Comparison of types of sketches, daily 400 350 300 -5 250 " N Thinking sketches . 200 - Talking sketches E Planning sketches 50 11/9/09 1/10109 1/11/09 1/12/09 1113/09 1/14/09 1/15/09 1116/09 1/17/09 1/18/09 1119/09 1/20/09 1/21/09 1/22/09 Date
Figure 8. Comparison of number of thinking, talking and planning sketches over time for all students.
4.3 Chindogu trends
Figures 7 and 8 show a second wave of sketches and writing during the latter half of the class, albeit smaller than the amount of those in the week before. This coincides with the beginning of the Chindogu projects. For this section of the class, students worked with three different partners to invent, design and build a Chindogu, or an 'unuseless' item: the products solve a problem, but are not especially useful. The design process for these projects was accelerated, with approximately a day spent on brainstorming and prototyping each Chindogu. At this point in the class, students produced similar numbers of sketches and writings each day. However, for the Chindogu projects, there were considerably less logbook entries than there had been for the cardboard project. The cardboard project was of a greater complexity, and required a greater quantity of brainstormed ideas. Because some students were able to use the observations and needs gathered at the beginning of the class for their Chindogu ideas, they did not need to redo this part of the design process. Prototyping of the Chindogu ideas was also easier than that of the cardboard projects. For the Chindogu projects, students were
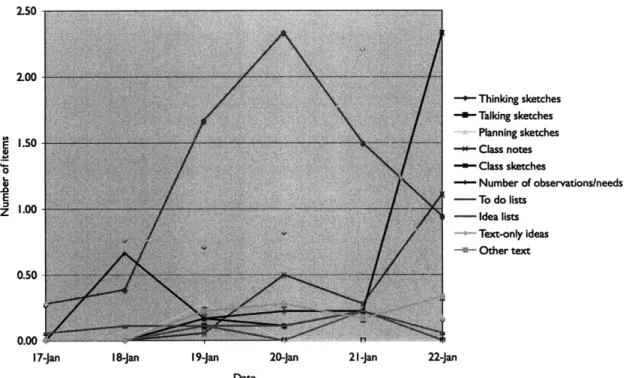
primarily combining already existing products, rather than creating things from scratch. Dimensioned drawings were not necessary for most Chindogus. These projects were also much more fast-paced, hence students built their prototypes after less planning and analysis. Figure 9 shows the average numbers of logbook entries per category in the final
six days of the class, when the Chindogu projects were being started and completed.
January 17t" and 18th fell on the weekend and, as expected, students did not do much
Average daily logbook entries - Chindogu period 2.50 2.00-1.50 -o -E z 1.00 0.50 0.00
17-Jan 18-Jan 19-Jan 20-Jan 21-Jan 22-Jan
Date
Figure 9. Average number class.
of notebook entries per category for the final six days of the
It is interesting that at the end of the class, text-only ideas and thinking sketches were the predominant type of entry. However, it should be noted that of the 18 total students, many did not have any entries in these categories. Table 2 shows the
breakdown:
Date Students with sketches Students with ideas (text only) 1/19 9- A, B, D, E, I, L, N, P, R 2-F, R
1/20 6-A, E, G, L, O, R 2-Q, R
1/21 6- A, B, C, G, N, P 4- C, K, N, R
1/22 6 - C, H, L, M, O, R 1-0
Table 2. Students with entries for the sketch 1/22.
and text-only idea categories from 1/19 to
The spike in class sketches on January 22 is unrelated to the Chindogu projects - it coincides with a take-home activity to draw three items: a bicycle from memory; a hand holding a key; and a box with a ball in it and shapes on the sides. This drawing task was created for research by M. Yang and
J.
Cham for their 2007 paper on sketching4. The different tasks were designed to test visual recall, rendering and novel visualization skills, and look for a potential link between sketching skill and measure of engineering design performance. - Thinking sketches - Talking sketches Planning sketches *- Class notes -- Class sketches - Number of observations/needs - To do lists SIdea lists Text-only ideas - Other text4.4 Writing versus sketching product ideas
The data from Design-a-palooza design notebooks revealed that while some people tend to exclusively sketch their ideas, others prefer to write out a list of ideas featuring only text. This could be because some students feel less comfortable sketching, and find that writing their ideas is a much faster and effective way to convey them. Another possible explanation is that some students have better mental visualization skills - they have a clear picture of what the product would look like in their head, and do not find it necessary to sketch this on paper as well. Figure 10 shows a graph comparing the number of design sketches to written ideas for each student.
Toal desgn sketdh and wrkmw produc ideas
Figure ideas.
o stc
10. Comparison of number of design sketches and number of text-only product
Although it was hypothesized that students who wrote more of their ideas down would have fewer overall sketches, there does not appear to be conclusive data to support this hypothesis. Of the six students with above-average numbers of design sketches, three also had lists of ideas in their logbooks, and two of these three had an above-average number of text-only ideas, as well. The other three students, however, did not have any text-only idea lists. Of the seven students with above-average numbers of written ideas, four had below-average numbers of sketches, which supports the hypothesis. Seven of the eighteen students had no written idea lists, and all students had sketches. Student N had the highest number of project-related sketches and written ideas out of the entire class, with 1I 12 and 71, respectively.
4.5 Effect of partner
Another potential area of research interest was the effect that partners have on each other for sketching and other design work. It was hypothesized that partners may make drawings that are vertical or lateral transformations of each other's work. Looking at partners' notebooks in hindsight made this relationship difficult to determine, as it was not clear whether students were working with their partner when brainstorming or refining ideas. Had partners been working together, it would be reasonable that they would draw off of each other's ideas. If they were working independently, one could infer that similar drawings would be a coincidence and not indicative of these transformations and relationships. In comparing partners' notebooks, it was not clear which of these scenarios was the actual case, but it is more likely that students worked outside of class independently on their brainstorming assignments. However, after partners presented their brainstormed ideas to each other, future ideas likely drew some inspiration from this collaboration and sharing of information. One student actually had their partner's sketches stapled into their notebook - which made it confusing to code initially, but also showed that there was a definite sharing of ideas. Unfortunately research in this area was inconclusive overall.
5. Conclusion
Analysis of the eighteen logbooks from Design-a-palooza served to answer the questions that were initially proposed:
* What is an effective way to code/analyze design notebooks?
Coding of the logbooks was done entirely by hand. Although this is a tedious process that also leaves room for human error, the ambiguous nature of the logbook entries requires that this be done by hand. The degree of difficulty and subjectivity in this process increases as the researcher breaks up the logbook entries into more specific categories. It is very important that the person analyzing the entries be clear on the measure for each category, so that each notebook is held up to the same criteria. Having several agreed-upon examples for each category would be helpful when there are uncertainties. As a measure of the accuracy of this coding process, several people could code the same notebooks using the same criteria, and compare their independent results.
* Is there a relation between drawings and text in the design process?
The number of drawings completed by the class appeared to be linked to several factors. After drawing lessons were introduced in the class, the number of sketches in the design notebooks increased drastically. For the second half of the class, during the Chindogu projects, drawing appeared to play a smaller role, likely due to the decreased complexity of these projects as well as having less time to complete the Chindogus. These projects were more conducive to quick and simple prototyping, often combining already existing items, so less planning was needed. The design process for the first project showed a clear trend for logbook entries: initially there were many text entries on customer observations and needs, followed by the sketching instruction and then thinking sketches using the needs as inspiration. During prototyping the writings and drawings decreased as students shifted to hands-on work, sometimes prefaced by dimensioned planning sketches.
* When working with a partner, is there a relationship between partners' logbook entries?
The data was inconclusive in determining a relationship between partners and drawing. Due to the research timing - after the completion of the class - it was difficult to determine, based only on logbook entries, whether partners' drawings showed vertical or lateral transformations of each other's sketches and ideas. Some partners had very similar number of total logbook entries, while others had a large variance.
* Do students who make text-only lists of ideas tend to have fewer drawings in their design notebooks?
The results were inconclusive as to whether there is a direct correlation between the number of sketches a student makes and the number of ideas they choose to list as text-only. Some students relied solely on sketches, therefore more data from people utilizing both sketches and text would be necessary to explore this relationship. Because of the varying artistic backgrounds of the students, it is likely that the level of comfort with drawing influenced these results. The amount of sketching is seemingly linked to students' personal preferences for text or drawing.
6. Future
Work
For researchers looking at design notebooks in the future, I would highly recommend being familiar with the class/project as early as possible. Ideally, the researcher could observe or even take part in the class. Additionally, it cannot be stressed enough that dating each page of one's logbook is extremely important. This is not only true for cases
of protecting one's ideas, but it would have also made data collection and analysis much easier.
Further analysis of the data presented in the paper could involve looking for correlations between design notebook text, drawing entries and design outcome. By gathering data on project grades and final presentations rankings, and comparing this with the number of logbook entries for various categories, a relationship may reveal itself.
It would be interesting to look more closely at how partners work together while building prototypes. How do they split the project? Do they sketch the entire system or just a sub-system that they are working on? Do both partners make dimensioned planning sketches? Does the more experienced drawer tend to sketch more than the other partner? As trying to determine relationships between partners after they have worked together is difficult, live observations would be recommended, in order to get real-time data and a first-hand look at these interactions.
The results of this research suggested that formal instruction on sketching encourages students to sketch their ideas. It is recommended that design courses include such instruction early on in the class. For future research, it would be interesting to collect data before the class on previous drawing or sketching experience, and explore whether this influences the number of thinking, planning or talking sketches in a design notebook.
7. References
I. 2.97 Design-a-palooza Homepage. http://web.mit.edu/ideation/2.97/index.html
2. Ullman, D. G., Wood, S., Craig, D., 1990, The Importance of Drawing in the Mechanical Design Process.
3. Song, S., Agogino, A., 2004, Insights on Designers' Sketching Activities in Product Design Teams.
4. Yang, M.C., Cham, J. G., 2007, An Analysis of Sketching Skill and Its Role in Early Stage Engineering Design.
5. Ferguson, E. S., 1992, Engineering and the Mind's Eye, MIT Press, Cambridge, MA. 6. Goel, V., 1995, Sketches of Thought, MIT Press, Cambridge, MA.
8. Appendix
Thinking Talking Planning Class Class Obs + To-do Text-only Other
Name sketch sketch sketch notes sketch needs lists ideas text
Student A 26 0 0 4 30 82 3 0 I Student Q 10 0 0 14 51 70 I 5 I Student B 31 0 3 2 23 104 I IS 5 Student E II 24 3 I 23 85 0 30 2 Student F 16 6 0 I 17 26 0 9 I Student C 24 12 2 4 46 96 I 21 4 Student D 92 I 0 5 50 180 0 15 I Student G 16 26 0 6 32 99 0 0 4 Student H 38 0 0 I 24 23 0 0 I Student N 106 6 0 18 43 90 0 71 II Student M 39 0 0 3 36 69 0 0 4 Student I 18 0 3 7 33 81 0 0 5 StudentJ 26 5 0 0 17 99 0 0 I Student K 15 2 0 2 35 16 0 4 I Student L 41 0 3 I 13 86 2 0 4 Student R 37 0 I 24 50 77 2 40 7 Student 0 45 5 0 9 24 85 I 25 9 Student P 44 0 0 13 41 85 0 0 2 Total 635 87 15 115 588 1453 11 235 64 Average 35.28 4.83 0.83 6.39 32.67 80.72 0.61 13.06 3.56 Standard dev 25.95 8.05 1.29 6.75 12.20 36.18 0.92 18.96 2.99
Appendix A. All students and total number of entries in each category, as well as sum, average and standard deviation for each category.