HAL Id: hal-03181091
https://hal.archives-ouvertes.fr/hal-03181091
Submitted on 3 May 2021
HAL is a multi-disciplinary open access
archive for the deposit and dissemination of
sci-entific research documents, whether they are
pub-lished or not. The documents may come from
teaching and research institutions in France or
abroad, or from public or private research centers.
L’archive ouverte pluridisciplinaire HAL, est
destinée au dépôt et à la diffusion de documents
scientifiques de niveau recherche, publiés ou non,
émanant des établissements d’enseignement et de
recherche français ou étrangers, des laboratoires
publics ou privés.
segmentation strategies based on 3D surface
reconstruction
Freddy Odille, Aurélien Bustin, Shufang Liu, Bailiang Chen, Pierre-André
Vuissoz, Jacques Felblinger, Laurent Bonnemains
To cite this version:
Freddy Odille, Aurélien Bustin, Shufang Liu, Bailiang Chen, Pierre-André Vuissoz, et al.. Isotropic 3D
cardiac cine MRI allows efficient sparse segmentation strategies based on 3D surface reconstruction.
Magnetic Resonance in Medicine, Wiley, 2018, 79 (5), pp.2665-2675. �10.1002/mrm.26923�.
�hal-03181091�
Isotropic 3D cardiac cine MRI allows efficient sparse
segmentation strategies based on 3D surface reconstruction.
Freddy Odille,
1,2*Aurélien Bustina,
3,4Shufang Liu,
1,3,4Bailiang Chen,
2Pierre-André
Vuissoz,
1Jacques Felblinger,
1,2Laurent Bonnemains
1,5INTRODUCTION
Quantitative assessment of cardiac ventricular volumes is routinely used in cardiac MRI protocols to provide relevant indices of cardiac function such as cardiac mass, stroke volume or ejection fraction. Current MRI techniques have been shown to be accurate and reproducible for the assessment of left and right ventricular functions (1). This is particularly important in clinical studies as statistically significant differences can be shown with a reduced patient cohort size. However there are still limitations to current MRI techniques. Most often 2D cardiac cine sequences are used to cover the ventricles in short-axis orientation during repeated breath-hold periods. The slice thickness is typically 5 to 10 mm which is much larger than the in-plane resolution (approximately 1.5 mm). Therefore the segmentation task is particularly difficult near the base of the ventricles where anatomical structures are changing rapidly in the through-plane direction. Therefore larger segmentation errors are observed in the basal slices, especially in the right ventricle due to its complex geometry (2). In the left ventricle, in order to reduce such errors, it has been proposed to calculate volumes from a set of long-axis slices, rotated about the longitudinal axis of the ventricle, instead of the conventional short-axis coverage (3).
With recent advances in scan acceleration and/or motion correction, 3D isotropic (or nearly isotropic) cine dataset are becoming available (4–7). Such datasets also come at the cost of larger volumes of data to be post-processed by the radiologist. However arbitrary planes can be reconstructed at the post-processing stage which means that the afore-mentioned manual segmentation strategies could be more easily compared and optimized. Manual segmentation of the ventricles from multiple arbitrarily oriented slices can be achieved by a surface reconstruction technique from a sparse point cloud arising from 2D contours, as shown in (8). Alternatively, a generic 3D finite element model of the heart can be optimized to fit the sparse contour set (9). The latter approach has been shown to allow accurate estimation of left ventricular mass and volumes with a reduced set of short-axis and long-axis slices in normal and infarcted mice ventricles (10). The advantage of such a surface reconstruction approach is that it only makes local regularity assumptions about the ventricular surface. It is expected to provide more accurate measurements than the fast volume estimation formulas from biplane echography (11) or MRI (e.g. from one horizontal + one vertical long-axis slice: 𝑉𝑜𝑙𝑢𝑚𝑒 = 0.85 × 𝐴𝑟𝑒𝑎𝐻𝐿𝐴𝑋× 𝐴𝑟𝑒𝑎𝑉𝐿𝐴𝑋 /
min (𝐿𝑒𝑛𝑔𝑡ℎ𝐻𝐿𝐴𝑋, 𝐿𝑒𝑛𝑔𝑡ℎ𝑉𝐿𝐴𝑋)) which assume the cavity has an
ellipsoidal geometry.
Acquiring 3D isotropic cardiac cine images remains nevertheless challenging. For accurate assessment of both diastolic and systolic volumes, cine images with a good temporal resolution are necessary (less than 45 ms) (12). Clinically, cine images are most commonly acquired with 2D balanced steady-state free precession (bSSFP) sequences covering the ventricles. Though 3D SSFP sequences have been proposed for 3D cine MRI (4,5,7), the 2D bSSFP sequence may still provide better contrast between blood and tissues with no need for contrast agent injection. This is because of the in-flow effect (13) causing a better contrast between steady-state spins from tissues and “fresh” spins from the blood entering the excitation slice in 2D. Banding artifacts are also less severe in 2D than in 3D SSFP. In practice a slice thickness of 5 to 10 mm gives optimal image quality/contrast. This is very coarse __________________________________________________
1IADI, INSERM U947 and Université de Lorraine, Nancy, France 2CIC-IT 1433, INSERM, CHRU de Nancy and Université de Lorraine,
Nancy, France
3Technische Universität München, Department of Computer Science,
Munich, Germany
4GE Global Research Center, General Electric, Munich, Germany 5Department of cardiothoracic surgery, CHU Strasbourg and University
of Strasbourg, Strasbourg, France
The authors would like to thank AFM (French association against myopathy) for funding the patient study (ID C13-04). The authors received support from INSERM, FEDER and Région Lorraine. A.B. and S.L. received support from the European Commission through Grant Number 605162.
*Correspondence to: Freddy Odille, IADI, Inserm U947 CIC-IT 1433, Bâtiment Recherche, CHRU de Nancy Brabois, Rue du Morvan, 54511, Vandoeuvre-lès-Nancy, France. E-mail: [email protected].
Purpose: Segmentation of cardiac cine MRI data is routinely
used for the volumetric analysis of cardiac function. Conventionally, 2D contours are drawn on short-axis image stacks with relatively thick slices (typically 8 mm). Here an acquisition/reconstruction strategy is used for obtaining isotropic 3D cine datasets; reformatted slices are then used to optimize the manual segmentation workflow.
Methods: Isotropic 3D cine datasets were obtained from multiple
2D cine stacks (acquired during free breathing in short-axis and long-axis orientations), using nonrigid motion correction (cine-GRICS) and super-resolution. Several manual segmentation strategies were then compared including conventional short-axis (SAX) segmentation, long-axis (LAX) segmentation in three views only, and combinations of SAX and LAX slices. An implicit B-spline surface reconstruction algorithm is proposed to reconstruct the left ventricular cavity surface from the sparse set of 2D contours.
Results: All tested sparse segmentation strategies were in good
agreement, with Dice scores above 0.9 despite using fewer slices (3-6 sparse slices instead of 8-10 contiguous short-axis slices). When compared to independent phase-contrast flow measurements, stroke volumes computed from 4 or 6 sparse slices had slightly higher precision than conventional SAX segmentation (error standard deviation of 5.4 mL against 6.1 mL) at the cost of slightly lower accuracy (bias of -1.2 mL against 0.2 mL). Functional parameters also showed a trend to improved precision, including end-diastolic, end-systolic volumes and ejection fraction.
Conclusion: The post-processing workflow of 3D isotropic
cardiac imaging strategies can be optimized using sparse segmentation and 3D surface reconstruction.
Keywords: Magnetic resonance imaging; heart;
motion-compensated reconstruction; super-resolution reconstruction, Beltrami regularization.
compared to the in-plane resolution which is typically on the order of 1.5 mm. To overcome this limitation, super-resolution approaches have been proposed for combining scans from different orientations (e.g. short-axis, horizontal and vertical long-axis) into an isotropic dataset (13–17). In case of lengthy cardiac MRI acquisitions, it has been proposed to use motion correction techniques such as GRICS (generalized reconstruction by inversion of coupled system) (18,19) in order to generate motion-consistent input data for the super-resolution algorithm (6). Motion-consistency here means that images should be free of intra-image motion (i.e. blurring and ghosting artifacts) and inter-image motion (i.e. slice-to-slice and stack-to-stack misalignment).
The aim of this study is to propose and evaluate novel segmentation strategies from 3D isotropic cine imaging based on sparse reformatted planes, in the context of quantitative volumetric parameter estimation in cardiac cine MRI. To obtain the 3D isotropic cine data, the acquisition/reconstruction strategy previously described in (6) is used (including motion-correction and super-resolution). The results presented here differ from (6) in that more patients are processed and a thorough validation of each step of the isotropic reconstruction technique is presented, using quantitative image quality metrics. Then the main contribution of the paper is presented, which is the proposed segmentation method: it consists of a 3D surface reconstruction from arbitrary sets of sparse 2D contours. Several segmentation strategies are then introduced and compared, including SAX, LAX, and combinations of SAX and LAX reformatted slices.
METHODS
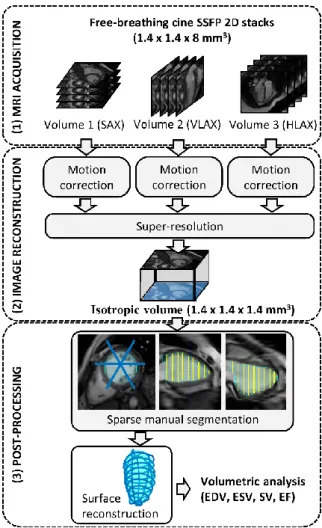
The image acquisition, reconstruction and post-processing workflow is summarized in Fig. 1.
Cardiac MR imaging
Twenty patients with Duchenne muscular dystrophy were included in this study. The patient population included children and young adults (age = 12.9 ± 4.3 year old, ranging from 6 to 20 years old). Their heart rate was 102 ± 18 bpm. The protocol was approved by our local ethics committee, was sponsored by INSERM under the label ID13-04 (clinical trials ID: NCT02078076). Written consent was obtained from all patients (and/or their parents when applicable).
Cardiac MRI was performed on a 1.5 T Signa HDxt MR scanner (General Electric, Milwaukee, USA). A conventional imaging protocol, comprising cardiac function and tissue characterization sequences, was adapted to these patients to allow the entire examination to be performed under free-breathing conditions. This was necessary because these patients are poor breath-holders: the older ones have severe muscular impairment affecting their breathing function in particular, while the younger ones are poorly compliant. Sequences used for this study included 2D cine stacks covering the left ventricle in three different orientations: short-axis (SAX), horizontal long-axis (HLAX) and vertical long-axis (VLAX).
The 2D cine sequence was a balanced steady-state free precession (bSSFP) sequence, as described in (20), with the following typical parameters: 224x224 matrix, 20 frames (i.e. 20 k-spaces were acquired successively for each slice), no prospective cardiac gating (retrospective gating was handled at the reconstruction stage), modified k-space sampling to optimize cardiac phase coverage (so-called lattice k-t sampling), TE/TR = 1.8/4.1 ms, native in-plane resolution 1.4 x 1.4 mm², 8 mm slice thickness, 10 to 14 slices acquired sequentially during free breathing. The acquisition time was approximately 10 min (SAX stack: 4 min; HLAX stack: 3 min; VLAX stack: 3 min). The image reconstruction comprised cine-GRICS motion correction for each stack of 2D cine images and a super-resolution technique which are described further in the next sections. Physiological signals
necessary for the reconstruction (ECG and 2 pneumatic breathing belts) were collected with the Maglife patient monitoring system (Schiller Medical, Wissembourg, France) and recorded by an in-house real-time system described in (21).
Furthermore, a conventional phase-contrast gradient-echo sequence was used to obtain reference blood flow measurements in the ascending aorta with the following parameters: 256x128 matrix, TE/TR=3.7/8.2 ms, velocity encoding = 150 cm/s, free-breathing acquisition, 3 number of excitations.
Our patient population was composed of children and young adults with a wide range of heart sizes and heart rates. We therefore investigated whether the proposed methods perform equally well in patients with different characteristics. This was done by dividing the database into two groups: group 1 was composed of the 10 youngest patients and group 2 was composed of the 10 oldest ones.
Motion-compensated reconstruction of each 2D cine stack
Motion-compensated reconstruction of each 2D cine stack was achieved by a motion-compensated sliding-window technique named cine-GRICS (20). For each stack of slices, a cine movie of 32 cardiac phases was reconstructed. The width of the sliding window was set to 150 ms (overlapping windows are allowed), hence for each cardiac phase to be reconstructed, k-space data within the window were selected and underwent a conventional GRICS motion correction (18,19). GRICS aims at solving a joint optimization problem where both the image 𝜌 and the motion fields 𝑢 are unknown. To make the optimization tractable, the displacement fields 𝑢(𝒙, 𝑡) are parameterized: a nonrigid motion model is used for constraining the motion fields to be temporally
Figure 1 Acquisition, reconstruction and post-processing workflow
correlated with the available motion signals 𝑠𝑘(𝑡). This motion
model is a separable model of the form: u(𝐱, t) = ∑𝐾𝑘=1𝛼𝑘(𝒙)𝑠𝑘(𝑡), where 𝛼𝑘(𝒙) is a spatial map of coefficients that
relate the motion signal 𝑠𝑘(𝑡) to the local motion at spatial
coordinate 𝒙. The 𝛼𝑘(𝒙) maps have three components 𝑥, 𝑦 and 𝑧
(like the motion fields 𝑢), which allows spatially free local displacements to be represented (only the time component of 𝑢 is constrained by the motion signals). The 𝛼𝑘(𝒙) maps are initally
unknown and are the free variables to be optimized jointly with the image in the GRICS reconstruction. Here the motion signal priors we used were: 𝑠1(𝑡) = chest breathing belt, 𝑠2(𝑡) = abdominal
breathing belt, 𝑠3(𝑡) = time distance to the center of the cardiac
window, 𝑠4(𝑡) = 𝑠3(𝑡)2. This choice allows respiratory motion
correction and cardiac motion correction within the cardiac window of interest. The optimization problem is therefore written as: arg min (𝜌,𝑢) {‖E(u)𝜌 − 𝑚‖ 2+ 𝜆𝑅(𝜌) + 𝜇𝑆(𝑢)}, 𝑠. 𝑡. u(𝐱, t) = ∑ 𝛼𝑘(𝒙)𝑠𝑘(𝑡) 𝐾 𝑘=1 . (1) Here the unknown 𝜌 is a 3D image (with the native anisotropic spatial resolution); 𝐸(𝑢) is the 2D multi-slice MRI forward acquisition model and comprises 3D spatial deformation operators for each acquired k-space line, receiver coil sensitivity weightings, 2D Fourier transformation and k-space sampling operators; 𝑚 is the vector of k-space data. Regularization terms are used for the image reconstruction, i.e. 𝑅(𝜌) = ‖𝜌‖2 (Tikhonov regularization)
and for imposing smoothness on the displacement fields, i.e. 𝑆(𝑢) = ‖∇𝑢‖2. All implementation details can be found in (18,19).
The respiratory signals 𝑠𝑘(𝑡) are centered on their most frequent
value, corresponding to the end-expiratory plateau. According to our motion model definition, images produced by the GRICS reconstruction correspond to this reference motion state. This choice of the end-expiratory plateau as a reference is assumed to be the most reproducible and to minimize stack-to-stack motion inconsistencies. Therefore no further image registration was applied in this study.
The motion correction step was implemented in C++ and was run on a cluster of workstations comprised of 16 nodes, each node being equipped with Intel Xeon Quad Core X550 CPU, 2.67 GHz, 24 GB RAM. This allowed independent reconstruction jobs for each cardiac phase (no inter-node communication needed) and multicore parallelization of each job (using the OpenMP standard).
Super-Resolution Reconstruction
In this work we only considered a geometric super-resolution technique combining several datasets acquired with different orientations, rather than a statistical one using machine learning approaches that would learn about the high-resolution structure of images, e.g. from a database (22–25).
The super-resolution step here consisted of reconstructing an isotropic image 𝜌𝑖𝑠𝑜 from the set of images with native resolution
𝜌1, … , 𝜌𝑁 (here 𝑁 = 3 orientations, namely SAX, HLAX, VLAX).
As described previously, e.g. in (6), the super-resolution image is obtained by solving: arg min 𝜌𝑖𝑠𝑜 ∑‖𝐷𝑖𝐵𝑖𝑇𝑖𝜌𝑖𝑠𝑜− 𝜌𝑖‖2 𝑁 𝑖=1 + 𝜆𝑄(𝜌𝑖𝑠𝑜). (2)
Here each 𝑇𝑖 represents the rotation operator from the desired
orientation to the ith orientation; 𝐷
𝑖𝐵𝑖 is the slice selection operator
which is comprised of a blurring operator 𝐵𝑖 (summation over the
slice thickness) and a downsampling operator 𝐷𝑖 (sampling in the
slice direction); 𝑄 is chosen to be either a Tikhonov regularizer, i.e. 𝑄𝑇𝑖𝑘(𝜌𝑖𝑠𝑜) = ‖𝜌𝑖𝑠𝑜‖2, or the Beltrami energy, i.e. 𝑄𝐵𝑒𝑙(𝜌𝑖𝑠𝑜) =
(1 + 𝛽2|∇𝜌
𝑖𝑠𝑜|2)1/2, which is an edge-preserving regularizer. The
Beltrami regularizer has similarities with the well-known total variation energy but results in reduced stair-casing effects. It has been used in other MRI applications (26) and can be implemented efficiently using a primal-dual projected gradient technique, which was used here, as described in (27).
The super-resolution algorithm was implemented in Matlab (The Mathworks, Natick, USA) and was applied sequentially to each cardiac phase in order to reconstruct the full 3D isotropic cine dataset.
Manual Segmentation from Reformatted Planes and Cavity Surface Reconstruction
The super-resolution reconstruction results in a much larger number of slices. Therefore the processing time for manual segmentation becomes a major issue. Here it is proposed to reconstruct the left ventricular cavity surface from sparse 2D contours in order to and to calculate all volumetric parameters of cardiac function. A graphical user interface was developed in Matlab for that purpose. It was designed to allow manual contours to be drawn on any reformatted plane of the 3D volume.
Given a set of manually drawn contours from sparse arbitrarily oriented planes, the left ventricular cavity was reconstructed using an implicit B-spline surface reconstruction algorithm described in (28). This surface reconstruction technique was chosen because it imposes local smoothness constraints in order to preserve the local geometry of the available data. This method was shown to be robust in noisy point clouds with large missing data. In order to account for the different level of confidence of the contours depending on their orientation, the algorithm was extended to allow weights to be attributed to each point in the sparse point cloud. This was done by adding a weighting matrix in the sparse linear system that is inverted when computing the B-spline fitting coefficients. When only SAX contours or only LAX contours were used, all weights were set to 1. When a combination of SAX and LAX contours were used, the SAX contour points were weighted by a Gaussian function 𝑤𝑆𝐴𝑋(𝑧) (z being the coordinate along the longitudinal
direction of the ventricle) so that 𝑤𝑆𝐴𝑋(𝑧𝑎𝑝𝑒𝑥) = 𝑤(𝑧𝑏𝑎𝑠𝑒) = 0
and 𝑤𝑆𝐴𝑋(𝑧𝑚𝑖𝑑−𝑐𝑎𝑣𝑖𝑡𝑦) = 1 while the long-axis contour points
were weighted by a function 𝑤𝐿𝐴𝑋(𝑧) = 1 − 𝑤𝑆𝐴𝑋(𝑧). This was to
translate the assumption that SAX contours are more trustable in the mid-cavity while LAX contours are more trustable near the base and apex.
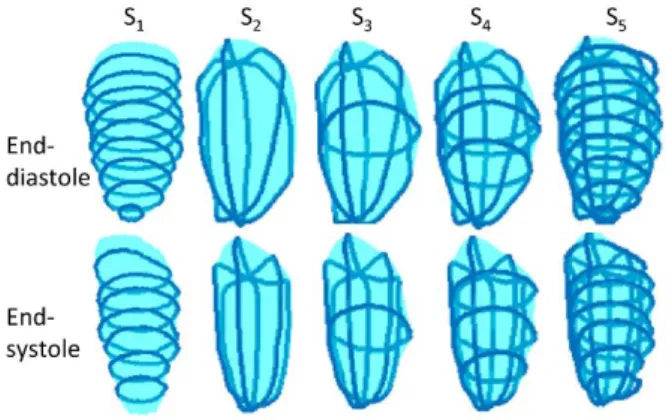
Several segmentation strategies were tested for the surface reconstruction as illustrated in Fig. 2: (S1) reconstruction from the
native short-axis contours only, named SAX1 to SAXn (n being the
number of native slices); (S2) reconstruction from the 3 LAX
Figure 2 Illustration of the five sparse segmentation strategies for left
contours, the location of which were defined from a basal short-axis slice, according to the guidelines of the American Heart Association (29): LAX1 = LAX plane going through the aortic
valve, LAX2 and LAX3 automatically determined by ± 60° rotation
of LAX1 about the long axis of the heart; (S3) reconstruction from
a combination of a mid-cavity slice SAXn/2 and three long-axis
slices LAX1, LAX2, LAX3 ; (S4) reconstruction from a combination
of three short-axis slices SAXn/4, SAXn/2, SAX3n/4, and three
long-axis slices LAX1, LAX2, LAX3; (S5) reconstruction from all
available contours (SAX1 … SAXn, LAX1, LAX2, LAX3).
Validation of 3D Isotropic Image Reconstruction
Validation of the motion-corrected super-resolution reconstruction framework was achieved by computing the image sharpness index, as proposed in (30), which is defined by:
SI (𝜌) = − log10Φ (
𝑚 − 𝑇𝑉(𝜌)
𝑣 ), (3) where 𝑚 = 𝔼[𝑇𝑉(𝜌)] is the expectation of the total variation of the image 𝜌, and 𝑣 = 𝕍𝑎𝑟[𝑇𝑉(𝜌)] is the corresponding variance and Φ is the cumulative distribution function of the standard normal distribution. This sharpness index is built on the global phase coherence property (31) exhibited by the Fourier transform of high quality images, which may be summarized as follows: the Fourier coefficients need to have a certain phase coherence so that their corresponding sine waves can build up to form sharp edges between flat areas in the image space. The index defined in Eq. [3] is based on an approximation of the global phase coherence that can be computed practically and has been shown to decrease with noise, blur or ringing. We used the authors’ Matlab implementation code available online for 2D images ( http://www.math-info.univ-paris5.fr/~moisan/sharpness/). In order to assess whether sharpness was improved in specific directions for a given reconstructed 3D image, the sharpness index was computed in three orthogonal slices placed in the center of the reconstructed 3D volume, yielding the following in-plane sharpness indices: 𝑆𝐼𝑥𝑦(𝜌), 𝑆𝐼𝑦𝑧(𝜌), 𝑆𝐼𝑥𝑧(𝜌).
Those sharpness metrics were used to compare all steps of the proposed reconstructions (and all possible combinations of motion correction method and super-resolution method): averaging (simple cardiac gating, no respiratory motion correction) versus cine-GRICS motion correction; native resolution images (SAX, HLAX or VLAX) versus super-resolution images using either Tikhonov or Beltrami regularization. In order to compare the sharpness metrics, all images need to be at the same spatial resolution, therefore the native resolution images were upsampled using a windowed 𝑠𝑖𝑛𝑐 interpolation (with Lanczos window). Differences in sharpness indices were tested for statistical significance using a Wilcoxon signed rank test with a significance level set to 5%. Sharpness indices were further analyzed for the two groups (youngest and oldest patients).Furthermore, in one dataset, we evaluated the behavior of the sharpness index for different values of the regularization level 𝜆 of the Beltrami reconstruction. This was to check whether the sharpness index would favor artificially sharp images rather than the recovery of real anatomical structures.
Comparison of Segmentation Strategies for Functional Analysis
Super-resolution datasets obtained with cine-GRICS motion correction and with Beltrami regularized super-resolution were used for the remainder of the study (i.e. segmentation, surface reconstruction and volumetric analysis). Validation of the surface reconstruction was done by comparing the usual volumetric parameters of cardiac function, including end-diastolic volumes (EDV), end-systolic volumes (ESV), stroke volumes (SV=EDV-ESV) and ejection fractions (EF=SV/EDV).
We compared the SV obtained from the super-resolution cine datasets against the independent measurements given by the phase-contrast aortic flow measurements. The flow sequence was
considered to give the reference standard values for stroke volumes SVref which were obtained with commercial software (CV Flow,
General Electric, Milwaukee, USA). The semi-automatic processing of the phase-contrast flow data was performed by one observer (F.O., 13 years of experience in cardiac MRI methodology) while the manual segmentation of the super-resolution cine datasets was performed by another observer who was blind to the flow results (L.B., pediatric cardiologist with 11 years of experience in cardiac MRI). Mean and standard deviation of the difference to SVref was computed for each surface
reconstruction strategy S1 to S5. Differences were tested for
statistical significance using a Wilcoxon signed rank test (significance level = 5%).
The segmentation strategy that used the highest number of manual contours (S5) was then used as the reference for comparing
other volumetric parameters (EDV, ESV and EF). Means and standard deviations of EDV, ESV and EF against the reference were compared for all tested strategies. Dice scores were also computed, as defined by 𝐷𝑖𝑐𝑒(𝐴, 𝐵) = 2|𝐴 ∩ 𝐵| (|𝐴| + |𝐵|)⁄ , to assess the overlapping ratio between the EDV end ESV segmentation masks obtained from all strategies S1 to S5. These
Dice scores were computed using the segmentation masks derived from the surface reconstructions. These masks had the same voxel resolution as the super-resolution images, with S5 as the reference
segmentation.
We also analyzed all functional parameters and Dice scores in a group-wise manner (separate analysis of the youngest and oldest patient groups).
RESULTS
Our patient population had the following characteristics, as measured by the conventional processing, i.e. from the native resolution SA stacks using the MASS software (mean ± standard deviation): the left ventricular ejection fraction was 54.2 % (± 7.6 %) and the end-diastolic volume was 88.6 mL (± 32.2 mL). Groups 1 and 2 (youngest and oldest patients) had the following characteristics respectively: 9.3 years old (± 1.8 years) and 16.5 years old (± 2.7 years); heart rate of 112 bpm (± 16 bpm) and 93 bpm (± 17 bpm); left ventricular EF of 59.9 % (± 4.7 %) and 48.5 % (± 5.1 %); EDV of 65.5 mL (± 12.0 mL) and 111.7 mL (± 29.4 mL). The two groups were significantly different in terms of heart rate (p=0.03), heart size (i.e. EDV, p=0.003) and global cardiac function (i.e. EF, p=0.001).
The total time needed to reconstruct one patient dataset (32 cardiac phases) was: 120 min for the cine-GRICS motion correction step (SAX + HLAX + VLAX) + 16 min for the super-resolution reconstruction step (with Beltrami regularization). The surface reconstruction algorithm took less than 2 seconds in Matlab to reconstruct one ventricular surface from a given set of contours.
Image Sharpness
Examples of reconstructed images with/without motion correction and with/without super-resolution are shown in Fig. 3-4. Videos showing the complete cardiac cycle for this patient and for another 3 patients are provided as supplementary material. Images reconstructed with cine-GRICS motion correction looked visually sharper than those reconstructed by averaging (simple cardiac gating, no respiratory correction). Reconstruction of each image stack (SAX, HLAX and VLAX) shows large differences between in-plane and through-plane sharpness, whereas super-resolution reconstructions appeared to have similar sharpness in all three directions (this was the case with and without motion correction). Super-resolution images reconstructed with Beltrami regularization seemed to be less noisy than Tikhonov-regularized ones, while edges and anatomical details seemed to be well preserved, e.g. the myocardial wall and the papillary muscles.
Quantitative assessment using the image sharpness metrics are summarized in Table 1. Sharpness indices confirmed the visual inspection. Considering only native resolution images, cine-GRICS consistently improved sharpness indices compared to uncorrected images and this was statistically significant for SIxy
(p=3.10-11), SI
xy (p=8.10-11) and SIxy (p=1.10-10). In the native
images, the sharpness indices SIxy,SIyz,SIxz showed larger values
when they corresponded to the native in-plane directions (xy being the SAX plane, yz being closest to the VLAX plane and xz being closest to the HLAX plane).
Tikhonov-regularized super-resolution images provided intermediate sharpness indices. When compared to the native images, they provided better sharpness in the through-plane directions, but native SAX planes remained of equal or better
quality in the native SAX data (same for VLAX and HLAX). Finally, the Beltrami-regularized super-resolution images outperformed native images and Tikhonov regularization in all planes. The improvement over native images was statistically significant for all indices (p<10-3) except for SI
yz in VLAX images
(p=0.07). The improvement over Tikhonov regularization was significant for all indices (p<10-4).
Detailed results of the group-wise analysis are presented in a supplementary file (Table S1 and Table S2). Tends were the same as in the whole population: cine-GRICS improved the sharpness of native resolution images significantly in group 1 (p<10-5) and
group 2 (p<10-4); super-resolution with Beltrami regularization
gave the best results in both cases with similar statistical
Table 1 Image sharpness indices obtained with/without motion correction and with/without super-resolution (mean ± standard deviation of N=20 patients).
No motion correction Cine-GRICS motion correction
SIxy SIyz SIxz SIxy SIyz SIxz
Native SAX(1) 3.5 (± 2.6) 1.3 (± 0.6) 2.0 (± 0.8) 5.4 (± 3.8) 2.2 (± 1.6) 2.3 (± 1.0)
Native VLAX(2) 3.1 (± 2.0) 4.6 (± 3.7) 3.5 (± 2.4) 4.3 (± 2.6) 7.4 (± 6.9) 4.3 (± 2.5)
Native HLAX(3) 2.8 (± 2.0) 2.3 (± 1.4) 3.7 (± 2.2) 4.0 (± 2.2) 3.1 (± 1.8) 4.5 (± 2.5)
Super-resolution (Tikhonov) 3.7 (± 2.7) 3.4 (± 2.6) 3.2 (± 1.6) 5.4 (± 3.5) 5.2 (± 3.8) 4.2 (± 1.8)
Super-resolution (Beltrami) 4.7 (± 3.5) 5.3 (± 3.9) 5.4 (± 2.6) 7.3 (± 4.7) 8.9 (± 6.7) 7.4 (± 3.7) (1)SAX = short-axis ; (2)VLAX = vertical long-axis ; (3)HLAX = horizontal long-axis
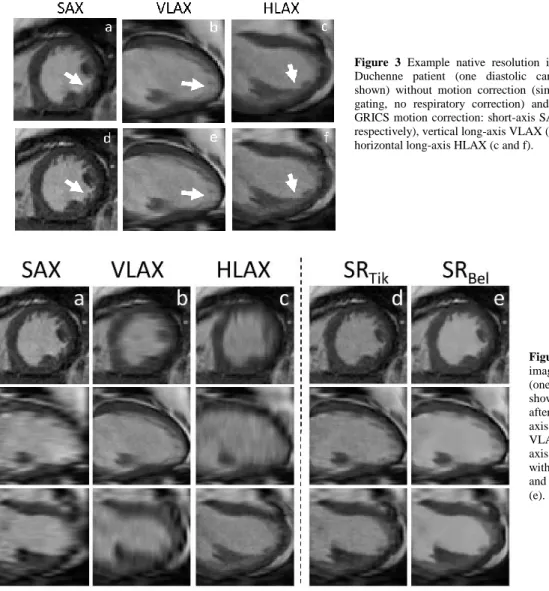
Figure 3 Example native resolution images of a
Duchenne patient (one diastolic cardiac phase shown) without motion correction (simple cardiac gating, no respiratory correction) and with cine-GRICS motion correction: short-axis SAX (a and d respectively), vertical long-axis VLAX (b and e) and horizontal long-axis HLAX (c and f).
Figure 4 Example reconstructed
images of a Duchenne patient (one diastolic cardiac phase shown): native resolution stacks, after motion correction, in short-axis SAX (a), vertical long-short-axis VLAX (b) and horizontal long-axis HLAX (c), super-resolution with Tikhonov regularization (d) and with Beltrami regularization (e).
significances. Image sharpness was generally higher in group 2 than in group 1 (p<0.01).
When varying the regularization level 𝜆 in Beltrami reconstructions, the sharpness index showed good properties (see Fig. S1 in the supplementary file): lower sharpness values were found when the regularization level was either too low (resulting in noisy images) or too high (over-regularization resulting in piecewise smooth images) and a maximum value was found when the images showed efficient edge-preserving denoising.
Given the better performance of cine-GRICS with Beltrami regularization, this reconstruction method was used for the subsequent functional analysis.
Functional Parameter Assessment from Surface Reconstructions
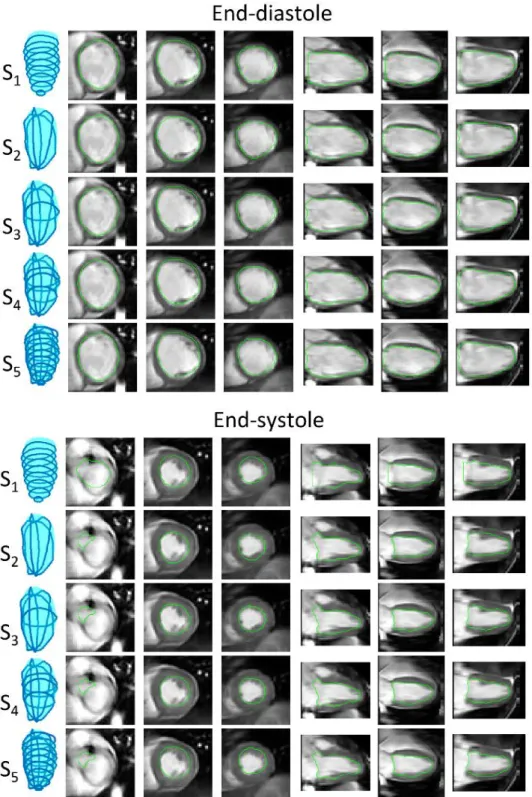
Example segmentations obtained from the different surface reconstruction strategies are shown in Fig. 5-6. Visually all segmentation strategies seemed to provide good delineations of the cavity. In this example subtle differences can be observed in the most basal slices in the systolic segmentation, with the SAX segmentation S1 being slightly inaccurate in the definition of the
valve planes. When considering the surface built with all available contours as the reference (strategy S5), all segmentation strategies
showed good agreement with Dice overlap scores above 0.90 (detailed results are given in Table 2). Interestingly sparse segmentation with strategy S4 outperformed the conventional
strategy S1 though it was using fewer contours.
Figure 5 Example segmentations
obtained from the five surface reconstruction strategies in one patient (end-diastole, three short-axis and three reformatted long-axis slices are shown).
Figure 6 Example segmentations
obtained from the five surface reconstruction strategies in one patient (end-systole, three short-axis and three reformatted long-axis slices are shown). Same dataset as in Figure 5.
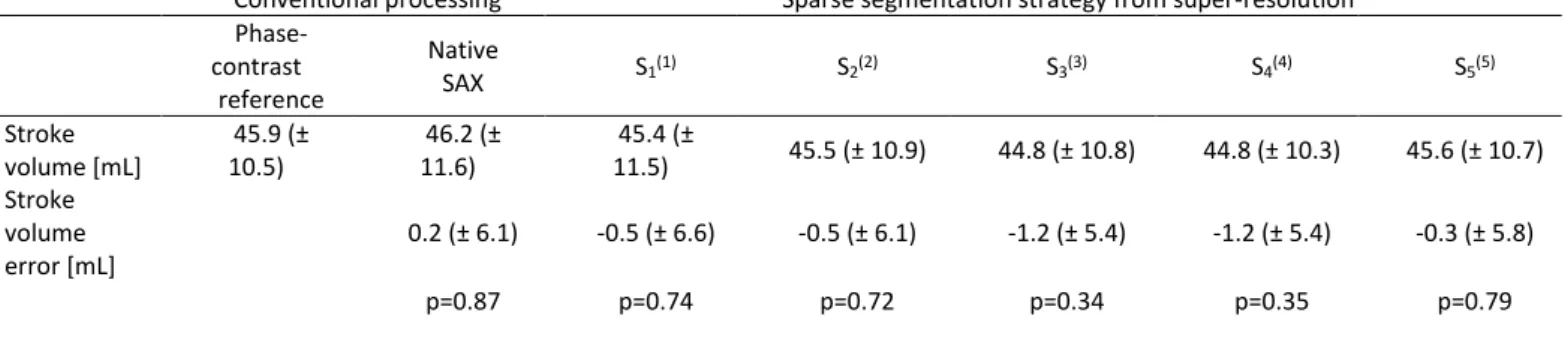
Stroke volume measurements obtained from conventional methods (phase-contrast and SAX slices with native resolution) and from super-resolution cine datasets are summarized in Table 2. The conventional segmentation from native SAX slices were in good agreement with the phase-contrast reference measurements. All sparse segmentation strategies lead to acceptable estimation of stroke volumes and no statistically significant difference was observed in any of the tested methods. It was still the case in the group-wise analysis (p>0.90 in group 1, p>0.60 in group 2). The comparison between the conventional native SAX segmentation and strategy S1 gives the difference in SV only due to the different
volume computation as these two methods were based on the exact same contours (numerical integration for native SAX and implicit B-spline surface reconstruction for strategy S1). Interestingly,
strategy S2, using only three LAX slices, resulted in similar bias as
S1 but slightly lower variability (i.e. lower standard deviation for
the error). The comparison of the five strategies seems to indicate
that there is a compromise between accuracy (i.e. mean error in SV estimate) and precision (i.e. standard deviation of the error): the more contours were used, the more accurate the SV estimate. However the most accurate method S5 (i.e. lowest bias) was not the
most precise (i.e. lowest standard deviation). Methods S3 and S4
using 3 LAX slices and only 1 or 3 SAX slices, were the most precise at the expense of a slight loss in accuracy.
The remaining cardiac volumetric parameters (EDV, ESV and EF) are shown in Table 3 for the different segmentation strategies. Strategy (S5) was used as the reference here because it used all
available contours. All volumetric parameters obtained with S4
(three SAX and three LAX slices) consistently resulted in lower bias (i.e. better accuracy) and lower variability (i.e. better precision) compared to other strategies. The performance of strategy S3 was comparable to strategy S1 in terms of accuracy and
precision of EDV, ESV and EF.
Table 2 Stroke volume measurements using conventional methods and using sparse segmentation strategies from super-resolution reconstructions (mean ± standard
deviation of N=20 patients).
Conventional processing Sparse segmentation strategy from super-resolution Phase-contrast reference Native SAX S1(1) S2(2) S3(3) S4(4) S5(5) Stroke volume [mL] 45.9 (± 10.5) 46.2 (± 11.6) 45.4 (± 11.5) 45.5 (± 10.9) 44.8 (± 10.8) 44.8 (± 10.3) 45.6 (± 10.7) Stroke volume error [mL] 0.2 (± 6.1) -0.5 (± 6.6) -0.5 (± 6.1) -1.2 (± 5.4) -1.2 (± 5.4) -0.3 (± 5.8) p=0.87 p=0.74 p=0.72 p=0.34 p=0.35 p=0.79
(1-5)Same definitions as in Table 2.
Table 3 Ventricular volumes and ejection fraction using the conventional method and using sparse segmentation strategies from super-resolution reconstructions
(mean ± standard deviation of N=20 patients).
Conventional processing Sparse segmentation strategy from super-resolution
Native SAX S1(1) S2(2) S3(3) S4(4) S5(5) (reference)
EDV [mL] 88.6 (+/- 32.2) 90.0 (± 32.2) 90.1 (± 30.2) 89.2 (± 30.8) 88.0 (± 30.8) 88.6 (± 31.0) EDV error [mL] 0.0 (± 3.8) -1.4 (± 2.7) -1.5 (± 6.4) -0.5 (± 3.6) 0.6 (± 1.4) ESV [mL] 42.4 (± 21.8) 44.5 (± 22.5) 44.6 (± 22.4) 44.4 (± 22.3) 43.3 (± 22.2) 43.0 (± 21.8) ESV error [mL] 0.6 (± 3.5) -1.5 (± 3.9) -1.6 (± 3.3) -1.4 (± 2.2) -0.2 (± 0.8) EF [%] 54.2 (± 7.6) 52.5 (± 8.2) 52.4 (± 8.6) 52.1 (± 8.2) 53.0 (± 8.3) 53.4 (± 7.8) EF error [%] -0.8 (± 3.6) 0.9 (± 3.8) 1.1 (± 2.2) 1.3 (± 1.8) 0.5 (± 0.9)
(1-5)Same definitions as in Table 2.
Table 4 Comparison between each left ventricular cavity segmentation strategy and the reference S5 strategy (mean ± standard deviation of N=20 patients)
S1(1) S2(2) S3(3) S4(4) S5(5)
Diastole Number of contours 9.5 (± 1.2) 3 4 6 12.5 (± 1.2) Dice score 0.907 (± 0.027) 0.913 (± 0.011) 0.936 (± 0.014) 0.965 (± 0.012) - Systole Number of contours 7.8 (± 1.2) 3 4 6 10.8 (± 1.2)
Dice score 0.954 (± 0.011) 0.932 (± 0.021) 0.949 (± 0.013) 0.968 (± 0.009) -
(1)Surface reconstruction from N short-axis slices (SAX1 … SAXn), i.e. same slices as the conventional “Native SAX” method (2)Surface reconstruction from 3 long axis slices (LAX1, LAX2, LAX3)
(3)Surface reconstruction from 1 short axis and 3 long axis slices (SAXn/2, LAX1, LAX2, LAX3)
(4)Surface reconstruction from 3 short axis and 3 long axis slices (SAXn/4, SAXn/2, SAX3n/4, LAX1, LAX2, LAX3) (5)Surface reconstruction from N short axis and 3 long axis slices (SAX1 … SAXn, LAX1, LAX2, LAX3)
DISCUSSION
We have proposed an acquisition and reconstruction method for obtaining isotropic cardiac cine MR images. The method relies on non-rigid motion correction of free-breathing data. Motion corrected images had better sharpness than uncorrected images and allowed MR scanning of this Duchenne patient population (children and young adults) who are usually not referred to cardiac MRI, partly because of their inability to perform repeated sustained breath holds. The super-resolution step, when using Beltrami regularization, further improved image sharpness in any reformatted planes compared to all native images. Interestingly, this was not the case with the Tikhonov-regularized super-resolution images, which provided a good combination of the three native resolution datasets but still had similar sharpness (or even slightly lower) in reformatted planes compared to the best native images. This shows the added benefit of the edge-preserving Beltrami regularization.
Alternatively, for patients who can hold their breath, post-processing image registration might also be used, but the non-rigid nature of thoracic motion makes it difficult to achieve slice-to-slice and stack-to-stack consistency. Here this consistency is obtained by letting the patient breathe normally; due to the use of a motion model, images were all reconstructed in a reference motion state which was chosen to be the most frequent respiratory state (i.e. the expiratory plateau), which is generally more reproducible than repeated breath holding. Insufficient motion consistency translates into suboptimal image sharpness in the final super-resolution images, as can be seen in our results with uncorrected images.
This study also shows that when such isotropic cardiac cine datasets can be obtained, novel manual segmentation strategies can be employed to optimize the post-processing workflow. A combination of three LAX slices and one/three SAX slices provided similar or even better accuracy and precision for volumetric parameters (EDV, ESV, SV, EF) compared to the conventional SAX stack approach. The use of reformatted planes in certain orientations can indeed ease the delineation of complex three-dimensional structures such as the valve planes. Such a strategy allows a gain in post-processing time: here 4 to 6 contours only (x2 for diastole and systole) needed to be drawn in well-chosen slices, which is less than the conventional short-axis stack method (here approximately 9 slices x2). The optimal placement of the sparse reformatted slices depends on the geometry of the structure to be segmented. For the left ventricle, we proposed to use three LAX slices rotated by 60°, one of which went through the aortic valve. This choice was believed to be sufficient as the left ventricular cavity is a locally regular surface and these slices cover all 17 segments as defined by the American Heart Association (29). Although the tested patients may not be representative of all cardiopathies, they did exhibit variability in heart shape, size and volumetric parameters, as it comprised children and young adults with normal to impaired asymmetric cardiac fraction (meaning that the left ventricular segments were not all affected in the same way). We also checked that the image sharpness improvements and the segmentation results did not depend on the size of the imaged structures, and similar conclusions were found in the groups of youngest and oldest patients who had very different heart sizes.
This study also emphasizes the impact of the segmentation methodology on the accuracy and precision of the volumetric parameters. Segmentation in LAX planes was proposed previously by Bloomer et al. and was compared to SAX (3). In their study on 21 adults (including normal and diseased hearts), the authors concluded that 9 LAX slices were sufficient to achieve robust volumetric measurements. The results from the present study are in line with these numbers and suggest that further improvement may be obtained with: (i) motion correction; (ii) a combination of LAX and SAX contours; (iii) a surface reconstruction approach (Bloomer et al. used a formula to compute volumes that assumes a locally ellipsoidal model). Similar conclusions were found in Ref.
(9,10), where accurate estimates of LV mass and volumes were shown to be feasible with as little as 6 slices (4 SAX and 2 LAX slices) in infarcted mice and with only 4 slices (2 SAX and 2 LAX) in normal (i.e. symmetrical) mice ventricles. However such sparse segmentation strategies may not be able to provide accurate quantification in case of more regional diseases.
In this study we used phase-contrast flow measurements as a reference standard for SV estimates. Although it has the advantage of being independent from the cine volumetric estimation (i.e. SV from EDV and ESV), it has several limitations. Strike volumes can be affected by changes of the patient‘s hemodynamic state during acquisition (e.g. changes in heart rate) which are common during an MRI scan.
In future work we would like to apply the proposed technique to the right-ventricle which has a more complex geometry than the left ventricle. This might help improve the variability of volumetric parameters which remains poor in that region. It might also help identify the key slices which are necessary for accurate and precise volume calculations.
The motion corrected super-resolution framework may be useful in other cardiac applications. In particular the pre-operative visualization of complex anatomies in congenital heart diseases would be of interest for cardiac surgeons. High-resolution myocardial scar imaging is also of great interest in post-infarct patients as it may help identify arrhythmogenic substrates leading to ventricular tachycardias (32,33).
CONCLUSION
We have shown the feasibility of motion-corrected super-resolution for reconstructing 3D isotropic cardiac cine MRI datasets in patients with breathing difficulties. Such 3D isotropic datasets allow novel manual segmentation strategies from sparse arbitrarily oriented slices. A surface reconstruction algorithm can be used to approximate the heart geometry from the sparse point clouds. Combining a reduced number of short-axis and long-axis slices was shown to improve over conventional segmentation of the short-axis stack of images, as it led to better precision despite using fewer contours.
REFERENCES
1. Pujadas S, Reddy GP, Weber O, Lee JJ, Higgins CB. MR imaging assessment of cardiac function. J. Magn. Reson. Imaging 2004;19:789– 799. doi: 10.1002/jmri.20079.
2. Bonnemains L, Mandry D, Marie P-Y, Micard E, Chen B, Vuissoz P-A. Assessment of right ventricle volumes and function by cardiac MRI: Quantification of the regional and global interobserver variability. Magn. Reson. Med. 2012;67:1740–1746. doi: 10.1002/mrm.23143. 3. Bloomer TN, Plein S, Radjenovic A, Higgins DM, Jones TR, Ridgway JP,
Sivananthan MU. Cine MRI using steady state free precession in the radial long axis orientation is a fast accurate method for obtaining volumetric data of the left ventricle. J. Magn. Reson. Imaging 2001;14:685–692. doi: 10.1002/jmri.10019.
4. Uribe S, Muthurangu V, Boubertakh R, Schaeffter T, Razavi R, Hill DLG, Hansen MS. Whole-heart cine MRI using real-time respiratory self-gating. Magn. Reson. Med. 2007;57:606–613. doi: 10.1002/mrm.21156.
5. Makowski MR, Wiethoff AJ, Jansen CH, et al. Single breath-hold assessment of cardiac function using an accelerated 3D single breath-hold acquisition technique - comparison of an intravascular and extravascular contrast agent. J. Cardiovasc. Magn. Reson. 2012;14:53. doi: 10.1186/1532-429X-14-53.
6. Odille F, Bustin A, Chen B, Vuissoz P-A, Felblinger J. Motion-corrected, super-resolution reconstruction for high-resolution 3D cardiac cine MRI. In: Medical Image Computing and Computer-Assisted Intervention – MICCAI 2015. Vol. in press. Lecture Notes in Computer Science. Springer Berlin Heidelberg; 2015.
7. Wetzl J, Schmidt M, Pontana F, Longère B, Lugauer F, Maier A, Hornegger J, Forman C. Single-breath-hold 3-D CINE imaging of the left ventricle using Cartesian sampling. Magn. Reson. Mater. Phys. Biol. Med. 2017:1–13. doi: 10.1007/s10334-017-0624-1.
8. Wan M, Huang W, Zhang J-M, Zhao X, Tan RS, Wan X, Zhong L. Variational Reconstruction of Left Cardiac Structure from CMR Images. PLOS ONE 2015;10:e0145570. doi: 10.1371/journal.pone.0145570.
9. Young AA, Cowan BR, Schoenberg SO, Wintersperger BJ. Feasibility of single breath-hold left ventricular function with 3 Tesla TSENSE acquisition and 3D modeling analysis. J. Cardiovasc. Magn. Reson. 2008;10:24. doi: 10.1186/1532-429X-10-24.
10. Young AA, Medway DJ, Lygate CA, Neubauer S, Schneider JE. Accelerating global left-ventricular function assessment in mice using reduced slice acquisition and three-dimensional guide-point modelling. J. Cardiovasc. Magn. Reson. 2011;13:49. doi: 10.1186/1532-429X-13-49.
11. Schiller NB, Shah PM, Crawford M, DeMaria A, Devereux R, Feigenbaum H, Gutgesell H, Reichek N, Sahn D, Schnittger I. Recommendations for quantitation of the left ventricle by two-dimensional echocardiography. American Society of Echocardiography Committee on Standards, Subcommittee on Quantitation of Two-Dimensional Echocardiograms. J. Am. Soc. Echocardiogr. Off. Publ. Am. Soc. Echocardiogr. 1989;2:358–367. 12. Miller S, Simonetti OP, Carr J, Kramer U, Finn JP. MR Imaging of the
Heart with Cine True Fast Imaging with Steady-State Precession: Influence of Spatial and Temporal Resolutions on Left Ventricular Functional Parameters. Radiology 2002;223:263–269. doi: 10.1148/radiol.2231010235.
13. Scheffler K, Lehnhardt S. Principles and applications of balanced SSFP techniques. Eur. Radiol. 2003;13:2409–2418. doi: 10.1007/s00330-003-1957-x.
14. Gholipour A, Estroff JA, Warfield SK. Robust Super-Resolution Volume Reconstruction From Slice Acquisitions: Application to Fetal Brain MRI. IEEE Trans. Med. Imaging 2010;29:1739–1758. doi: 10.1109/TMI.2010.2051680.
15. Plenge E, Poot DHJ, Bernsen M, Kotek G, Houston G, Wielopolski P, van der Weerd L, Niessen WJ, Meijering E. Super-resolution methods in MRI: Can they improve the trade-off between resolution, signal-to-noise ratio, and acquisition time? Magn. Reson. Med. 2012;68:1983– 1993. doi: 10.1002/mrm.24187.
16. Rousseau F, Glenn OA, Iordanova B, Rodriguez-Carranza C, Vigneron DB, Barkovich JA, Studholme C. Registration-Based Approach for Reconstruction of High-Resolution In Utero Fetal MR Brain Images. Acad. Radiol. 2006;13:1072–1081. doi: 10.1016/j.acra.2006.05.003. 17. Shilling RZ, Robbie TQ, Bailloeul T, Mewes K, Mersereau RM, Brummer
ME. A Super-Resolution Framework for 3-D Resolution and High-Contrast Imaging Using 2-D Multislice MRI. IEEE Trans. Med. Imaging 2009;28:633–644. doi: 10.1109/TMI.2008.2007348.
18. Odille F, Vuissoz P-A, Marie P-Y, Felblinger J. Generalized reconstruction by inversion of coupled systems (GRICS) applied to free-breathing MRI. Magn Reson Med 2008;60:146–157. doi: 10.1002/mrm.21623.
19. Odille F, Menini A, Escanye J-M, Vuissoz P-A, Marie P-Y, Beaumont M, Felblinger J. Joint Reconstruction of Multiple Images and Motion in MRI: Application to Free-Breathing Myocardial Quantification. IEEE Trans. Med. Imaging 2016;35:197–207. doi: 10.1109/TMI.2015.2463088.
20. Vuissoz P-A, Odille F, Fernandez B, Lohezic M, Benhadid A, Mandry D, Felblinger J. Free-breathing imaging of the heart using 2D cine-GRICS (generalized reconstruction by inversion of coupled systems) with assessment of ventricular volumes and function. J. Magn. Reson. Imaging 2012;35:340–351. doi: 10.1002/jmri.22818.
21. Odille F, Pasquier C, Abaecherli R, Vuissoz P-A, Zientara GP, Felblinger J. Noise Cancellation Signal Processing Method and Computer System for Improved Real-Time Electrocardiogram Artifact Correction during MRI Data Acquisition. IEEE Trans Biomed Eng. 2007;54:630–640. 22. Bhatia KK, Price AN, Shi W, Hajnal JV, Rueckert D. Super-resolution
reconstruction of cardiac MRI using coupled dictionary learning. In: 2014 IEEE 11th International Symposium on Biomedical Imaging (ISBI). ; 2014. pp. 947–950. doi: 10.1109/ISBI.2014.6868028.
23. Oktay O, Bai W, Lee M, Guerrero R, Kamnitsas K, Caballero J, Marvao A de, Cook S, O’Regan D, Rueckert D. Multi-input Cardiac Image
Super-Resolution Using Convolutional Neural Networks. In: Ourselin S, Joskowicz L, Sabuncu MR, Unal G, Wells W, editors. Medical Image Computing and Computer-Assisted Intervention -- MICCAI 2016. Lecture Notes in Computer Science. Springer International Publishing; 2016. pp. 246–254. doi: 10.1007/978-3-319-46726-9_29.
24. Rueda A, Malpica N, Romero E. Single-image super-resolution of brain MR images using overcomplete dictionaries. Med. Image Anal. 2013;17:113–132. doi: 10.1016/j.media.2012.09.003.
25. Shi W, Caballero J, Ledig C, Zhuang X, Bai W, Bhatia K, de Marvao AMSM, Dawes T, O’Regan D, Rueckert D. Cardiac Image Super-Resolution with Global Correspondence Using Multi-Atlas PatchMatch. In: Mori K, Sakuma I, Sato Y, Barillot C, Navab N, editors. Medical Image Computing and Computer-Assisted Intervention – MICCAI 2013. Vol. 8151. Berlin, Heidelberg: Springer Berlin Heidelberg; 2013. pp. 9–16.
26. Bustin A, Ferry P, Codreanu A, Beaumont M, Liu S, Burschka D, Felblinger J, Brau ACS, Menini A, Odille F. Impact of a Denoising Technique on Saturation-Recovery-Based Myocardial T1 Mapping. J. Magn. Reson. Imaging 2017:In press.
27. Zosso D, Bustin A. A Primal-Dual Projected Gradient Algorithm for Efficient Beltrami Regularization. UCLA CAM Rep. 14-52 [Internet] 2014.
28. Rouhani M, Sappa AD. Implicit B-spline fitting using the 3L algorithm. In: 2011 18th IEEE International Conference on Image Processing. ; 2011. pp. 893–896. doi: 10.1109/ICIP.2011.6116702.
29. Cerqueira MD, Weissman NJ, Dilsizian V, et al. Standardized myocardial segmentation and nomenclature for tomographic imaging of the heart. A statement for healthcare professionals from the Cardiac Imaging Committee of the Council on Clinical Cardiology of the American Heart Association. Circulation 2002;105:539–542. 30. Blanchet G, Moisan L. An explicit sharpness index related to global
phase coherence. In: 2012 IEEE International Conference on Acoustics, Speech and Signal Processing (ICASSP). ; 2012. pp. 1065– 1068. doi: 10.1109/ICASSP.2012.6288070.
31. Blanchet G, Moisan L, Rouge B. Measuring the Global Phase Coherence of an image. In: 2008 15th IEEE International Conference on Image Processing. ; 2008. pp. 1176–1179. doi: 10.1109/ICIP.2008.4711970. 32. Dzyubachyk O, Tao Q, Poot DHJ, Lamb HJ, Zeppenfeld K, Lelieveldt BPF,
van der Geest RJ. Super-resolution reconstruction of late gadolinium-enhanced MRI for improved myocardial scar assessment. J. Magn. Reson. Imaging 2015;42:160–167. doi: 10.1002/jmri.24759. 33. Voilliot D, Odille F, Mandry D, et al. Relationship between spatial scar
characteristics assessed by cardiac magnetic resonance imaging and cycle length of monomorphic ventricular tachycardia in post-infarct patients. In: ESC Congress. Barcelona; 2014.
SUPPORTING INFORMATION
Supporting Video S1 Comparison of several 3D isotropic cine
reconstructions for patient 1 (16 years old)
Supporting Video S2 Comparison of several 3D isotropic cine
reconstructions for patient 2 (8 years old)
Supporting Video S3 Comparison of several 3D isotropic cine
reconstructions for patient 3 (20 years old)
Supporting Video S4 Comparison of several 3D isotropic cine
reconstructions for patient 4 (18 years old)
Supporting Information Table S5 Image sharpness indices
obtained on group 1 (10 youngest patients) with/without motion correction and with/without super-resolution (mean ± standard deviation).
Supporting Information Table S2 Image sharpness indices
obtained on group 2 (10 oldest patients) with/without motion correction and with/without super-resolution (mean ± standard deviation).
Supporting Information Figure S1 Beltrami-regularized
super-resolution images obtained in one patient for different values of the regularization parameter 𝜆 (a, b, c, d) and sharpness curves as a function of 𝜆 (e). In the study 𝜆 = 10−5 was fixed (close to image b) which gives a good compromise between noise reduction and feature preservation.
Supporting Information
Supporting Information Table S6 Image sharpness indices obtained on group 1 (10 youngest patients) with/without motion correction and with/without super-resolution (mean ± standard deviation).
No motion correction Cine-GRICS motion correction
SIxy SIyz SIxz SIxy SIyz SIxz
Native SAX(1) 2.4 (± 1.6) 1.1 (± 0.3) 1.7 (± 0.7) 3.8 (± 2.7) 2.1 (± 2.1) 2.2 (± 0.9) Native VLAX(2) 2.3 (± 1.5) 3.3 (± 3.3) 2.6 (± 2.4) 3.0 (± 1.9) 6.4 (± 9.4) 3.3 (± 2.7) Native HLAX(3) 2.2 (± 1.6) 1.5 (± 0.5) 2.1 (± 0.7) 3.0 (± 1.5) 1.9 (± 0.6) 2.8 (± 1.2) Super-resolution (Tikhonov) 2.7 (± 1.7) 1.8 (± 0.7) 2.1 (± 0.9) 4.3 (± 3.2) 3.7 (± 4.4) 3.3 (± 1.8) Super-resolution (Beltrami) 3.3 (± 2.2) 3.2 (± 1.7) 3.5 (± 1.3) 5.4 (± 3.7) 6.4 (± 6.3) 5.3 (± 2.3) (1)SAX = short-axis
(2)VLAX = vertical long-axis (3)HLAX = horizontal long-axis
Supporting Information Table S2 Image sharpness indices obtained on group 2 (10 oldest patients) with/without motion correction and
with/without super-resolution (mean ± standard deviation).
No motion correction Cine-GRICS motion correction
SIxy SIyz SIxz SIxy SIyz SIxz
Native SAX(1) 4.5 (± 3.1) 1.6 (± 0.7) 2.2 (± 0.9) 7.0 (± 4.1) 2.3 (± 0.9) 2.5 (± 1.1) Native VLAX(2) 3.9 (± 2.2) 5.9 (± 3.3) 4.5 (± 2.0) 5.6 (± 2.5) 8.3 (± 3.2) 5.2 (± 2.0) Native HLAX(3) 3.3 (± 2.2) 3.1 (± 1.5) 5.3 (± 2.0) 5.0 (± 2.4) 4.4 (± 1.7) 6.1 (± 2.3) Super-resolution (Tikhonov) 4.7 (± 3.1) 5.0 (± 2.8) 4.4 (± 1.3) 6.5 (± 3.7) 6.7 (± 2.4) 5.1 (± 1.5) Super-resolution (Beltrami) 6.1 (± 4.2) 7.3 (± 4.5) 7.3 (± 2.3) 9.1 (± 5.0) 11.3 (± 6.4) 9.5 (± 3.6) (1)SAX = short-axis
(2)VLAX = vertical long-axis (3)HLAX = horizontal long-axis
Supporting Information Figure S1 Beltrami-regularized super-resolution images obtained in one patient for different values of the
regularization parameter 𝝀 (a, b, c, d) and sharpness curves as a function of 𝝀 (e). In the study 𝝀 = 𝟏𝟎−𝟓 was fixed (close to image b) which gives a good compromise between noise reduction and feature preservation.