HAL Id: hal-00301461
https://hal.archives-ouvertes.fr/hal-00301461
Submitted on 13 Oct 2004HAL is a multi-disciplinary open access
archive for the deposit and dissemination of sci-entific research documents, whether they are pub-lished or not. The documents may come from teaching and research institutions in France or abroad, or from public or private research centers.
L’archive ouverte pluridisciplinaire HAL, est destinée au dépôt et à la diffusion de documents scientifiques de niveau recherche, publiés ou non, émanant des établissements d’enseignement et de recherche français ou étrangers, des laboratoires publics ou privés.
Is there a trend in cirrus cloud cover due to aircraft
traffic?
F. Stordal, G. Myhre, W. Arlander, T. Svendby, E. J. G. Stordal, W. B.
Rossow, D. S. Lee
To cite this version:
F. Stordal, G. Myhre, W. Arlander, T. Svendby, E. J. G. Stordal, et al.. Is there a trend in cirrus cloud cover due to aircraft traffic?. Atmospheric Chemistry and Physics Discussions, European Geosciences Union, 2004, 4 (5), pp.6473-6501. �hal-00301461�
ACPD
4, 6473–6501, 2004
Is there a trend in cirrus cloud cover due to aircraft traffic?
F. Stordal et al. Title Page Abstract Introduction Conclusions References Tables Figures J I J I Back Close Full Screen / Esc
Print Version Interactive Discussion
© EGU 2004
Atmos. Chem. Phys. Discuss., 4, 6473–6501, 2004 www.atmos-chem-phys.org/acpd/4/6473/
SRef-ID: 1680-7375/acpd/2004-4-6473 © European Geosciences Union 2004
Atmospheric Chemistry and Physics Discussions
Is there a trend in cirrus cloud cover due
to aircraft tra
ffic?
F. Stordal1, 2, G. Myhre1, 2, W. Arlander1, *, T. Svendby1, E. J. G. Stordal1, W. B. Rossow3, and D. S. Lee4
1
Norwegian Institute for Air Research, Kjeller, Norway 2
Department of Geosciences, University of Oslo, Norway 3
NASA/Goddard Institute for Space Studies, New York, New York, USA 4
Department of Environment and Geographical Sciences, Manchester Metropolitan University, United Kingdom
*
now at: Bureau of Patents, Oslo, Norway
Received: 20 September 2004 – Accepted: 24 September 2004 – Published: 13 October 2004 Correspondence to: F. Stordal (frode.stordal@geo.uio.no)
ACPD
4, 6473–6501, 2004
Is there a trend in cirrus cloud cover due to aircraft traffic?
F. Stordal et al. Title Page Abstract Introduction Conclusions References Tables Figures J I J I Back Close Full Screen / Esc
Print Version Interactive Discussion
© EGU 2004
Abstract
Trends in cirrus cloud cover have been estimated based on 16 years of data from ISCCP (International Satellite Cloud Climatology Project). The results have been spa-tially correlated with aircraft density data to determine the changes in cirrus could cover due to aircraft traffic. Main emphasis has been on the area covered by the METEOSAT
5
satellite, to avoid trends in the ISCCP data resulting from changing satellite positions. An alternative retrieval of high clouds in this region has been used to complement the analysis based on ISCCP data. In Europe, which is within the METEOSAT region, we find indications of a trend of about 2%/decade due to aircraft, in reasonable agreement with previous studies. The positive trend in cirrus in areas of high aircraft traffic seems
10
to have contrasted a general negative trend in cirrus. Extrapolation in time to cover the entire period of aircraft operations and in space to cover the global scale yields a best estimate of 0.05 Wm−2for the radiative forcing due to aircraft. This is close to the value given by IPCC (1999) as an upper limit.
1. Introduction
15
Condensation trails (contrails) from jet aircraft are visible in many industrialized regions and constitute one of several mechanisms that could influence the Earth’s radiative bal-ance. Contrails can often disappear quickly, but sometimes they persist for longer time periods and even evolve into cirrus clouds. Minnis et al. (1998) used information from a geostationary satellite to follow three events where contrails were converted into cirrus
20
clouds. These contrail systems lasted up to 17 hours. Data from a geostationary satel-lite was an ideal basis for studying this evolution. Duda et al. (2004) used a combination of flight data, meteorological data and satellite remote sensing to study development of contrails over the Great Lakes, demonstrating the formation of aircraft contrails with further spreading. From surface observations it would be difficult to distinguish cirrus
25
ACPD
4, 6473–6501, 2004
Is there a trend in cirrus cloud cover due to aircraft traffic?
F. Stordal et al. Title Page Abstract Introduction Conclusions References Tables Figures J I J I Back Close Full Screen / Esc
Print Version Interactive Discussion
© EGU 2004
into cirrus clouds was pointed out several years ago (Machta and Carpenter, 1971; Changnon, 1981), but the extent of such cirrus clouds and their climate effect remain highly uncertain.
Boucher (1999) analyzed surface observation of trends of cirrus clouds and related these trends to fossil fuel consumption by aircraft traffic. He found an increase in
5
cirrus clouds that could be related to aircraft traffic. Over the continental regions with the most aircraft traffic he determined this trend to be as large as almost 3% over a 10-year period. Zerefos et al. (2003) analyzed trends in cirrus cloud cover based on data from ISCCP (International Satellite Cloud Climatology Project). After removing trends associated with ENSO, QBO and NAO they found a trend in cirrus cloud cover
10
over northern mid latitudes which to a large extent paralleled consumption of fuel by aircraft, leading to their conclusion that there is evidence of a possible aviation effect on cirrus cloud cover.
Aircraft induced contrails and cirrus clouds impact longwave and shortwave radi-ation, with a general predominance of the longwave contribution. Such clouds, like
15
naturally occurring cirrus clouds, therefore have a net positive radiative effect (IPCC, 1999; 2001). In IPCC (1999; 2001) a global mean radiative forcing caused by contrails and aircraft induced cirrus was estimated to be from 0.02 and 0.04 (upper limit) Wm−2, respectively. Although the global mean of these forcings are small, the regional radia-tive forcing may be more significant. In Europe and North America the forcing due to
20
contrails may reach 0.5 Wm−2(Minnis et al., 1999; Myhre and Stordal, 2001)
Travis et al. (2002) found a significant increase in the diurnal temperature range over USA during the 3 days following 11 September 2001 when all commercial aircraft traffic was grounded. Contrails and aircraft induced cirrus clouds affect the diurnal tempera-ture because during the night their longwave effect inhibits cooling. On the other hand,
25
during the day the longwave effect and shortwave effects are rather similar but oppo-site in sign: the shortwave effect could even dominate and yield a cooling (Myhre and Stordal, 2001; Ponater et al., 2002). The Travis et al. (2002) study showed a larger than 1 degree increase in the diurnal temperature range compared to the three days
peri-ACPD
4, 6473–6501, 2004
Is there a trend in cirrus cloud cover due to aircraft traffic?
F. Stordal et al. Title Page Abstract Introduction Conclusions References Tables Figures J I J I Back Close Full Screen / Esc
Print Version Interactive Discussion
© EGU 2004
ods before and after the grounding of the aircraft traffic. This is clearly larger than what would be expected from contrails alone, pointing towards cirrus clouds evolving from contrails as a potentially significant effect in affecting the diurnal temperature range.
The present study is based on satellite observations of cirrus and high level clouds and seeks to identify trends that can possibly be related to aircraft traffic. In our study
5
we use ISCCP data over a 16 years period. We focus on the region of METEOSAT data where we have also developed an independent retrieval of upper level clouds.
2. Methods
2.1. ISCCP data
The ISCCP project was established in the early 1980s. One of the aims was to produce
10
global calibrated and normalized radiance dataset for the infrared (IR) and visible (VIS) from which cloud parameters could be derived. The ISCCP cloud analysis procedure contains three principal parts: cloud detection, radiative model analysis, and statistical analysis (Rossow et al., 1991; Rossow and Schiffer, 1991).
The primary data products of ISCCP are a collection of VIS and IR radiation images
15
from several operational weather satellites that have been normalized to a standard reference calibration (Schiffer and Rossow, 1985). Data are taken from the geostation-ary satellites METOSAT (Meteorological Satellite), GMS (Geostationgeostation-ary Meteorological Satellite), GOES (Geoatationary Operational Environmental Satellite) East and West, as well as from polar NOAA (National Oceanographic and Atmospheric Administration)
20
A (Afternoon) and M (Morning) orbiters.
In the ISCCP cloud detection procedure each individual satellite pixel (4-7 km) is classified as cloudy or clear (Rossow and Garder, 1993). To be classified as cloudy, either the VIS or the IR radiance must differ from its corresponding clear sky value by more than a pre-defined detection threshold. Each pixel is assumed to be completely
25
ACPD
4, 6473–6501, 2004
Is there a trend in cirrus cloud cover due to aircraft traffic?
F. Stordal et al. Title Page Abstract Introduction Conclusions References Tables Figures J I J I Back Close Full Screen / Esc
Print Version Interactive Discussion
© EGU 2004
for larger areas, according to the fractional area of the pixels containing clouds. In our analysis we have used the monthly mean D2 data product on a 2.5◦×2.5◦resolution for the 16 year period 1984–1999.
In our analysis we use two different ISCCP datasets for upper level clouds in an attempt to study formation of cirrus clouds developing from aircraft contrail clouds. One
5
is derived from IR only (denoted in the following as ISCCP IR), yielding results both day and night. This method cannot discriminate between the various types of high clouds; thus these clouds include deep convective clouds and cirrostratus in addition to cirrus and are often denoted as total amount of high clouds. However, very importantly in our context, the ISCCP IR method has a problem in the retrieval of cloud top height as
10
only the IR channel is used, and thus identification of thin cirrus clouds is problematic. Although they are detected by the IR, they are mis-classified as lower-level clouds since they are partially transparent to IR, thus appearing warmer than they actually are. Consequently, the high cloud amount from the IR does not include a significant part of the thinnest cirrus, some of which might be caused by aircraft.
15
The other dataset is derived from a combination of visible and IR information (de-noted as ISCCP VIS/IR), with results only during the day. The VIS radiances are used to determine the optical thickness, which is a basis for a correction of the cloud top temperature, resulting in a better classification of thin cirrus clouds.
High clouds (ISCCP VIS/IR) have been compared (see Rossow and Schiffer, 1999)
20
to SAGE (Stratospheric Aerosol and Gas Experiments) data (Liao et al., 1995) and two different analyses of HIRS (High-Resolution Infrared Sounder; Jin et al., 1996; Stubenrauch et al., 1999). In summary, those comparisons showed that the ISCCP VIS/IR data for high clouds were lower than the other datasets by at least 0.05–0.10. The discrepancies include uncertainties in all the datasets but are consistent with the
25
lower detection sensitivity of ISCCP, which limits it to clouds with optical depths ≥0.1– 0.3 (ocean and land, respectively). The ISCCP IR high cloud amounts are also lower than the VIS/IR amounts by about 0.1 as well.
ACPD
4, 6473–6501, 2004
Is there a trend in cirrus cloud cover due to aircraft traffic?
F. Stordal et al. Title Page Abstract Introduction Conclusions References Tables Figures J I J I Back Close Full Screen / Esc
Print Version Interactive Discussion
© EGU 2004
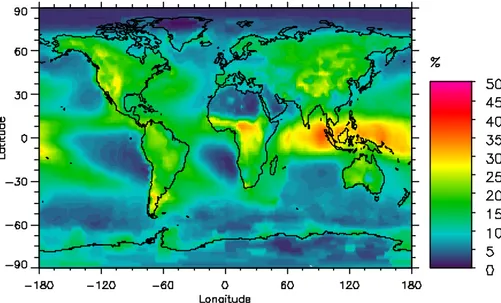
and total high clouds (ISCCP IR) for the 1984–1999 period. The well known features of large cloud amounts are seen in the tropics (over South America, Africa and Indonesia). The cirrus is more widespread than the total amount of high clouds in certain regions, e.g. over Indonesia. From Figs. 1 and 2 it is evident that in some regions the amount of cirrus is larger than the total amount of high clouds. Again this is due to underestimation
5
of the total amount of high clouds due to mis-classification of thin cirrus in the ISCCP IR dataset.
One particular feature in the distributions shown in Figs. 1 and 2 must be noticed, namely the fact that there are discontinuities in the data at the borders between areas covered by different satellites. One example is the Indian Ocean, which is covered by
10
three satellite instruments, namely GMS east of the southern tip of India, METEOSAT west of the south-eastern tip of the Arabian peninsula, and NOAA-A in between. This pattern is a result of the use of a constant radiance threshold for cloud detection that has been set to be sensitive enough to detect very thin cirrus (Rossow and Garder, 1993). This causes a satellite zenith angle dependence in the detection of high clouds.
15
As the slant path effect of an optically thin cloud is larger than the nadir path effect, more thin cirrus is detected at slant views (as can be seen in the region pointed to above in the Indian Ocean). This feature is important when it comes to determining trends in cirrus, as will be discussed below.
2.2. A METEOSAT retrieval
20
In order to verify trends and daily variations of high clouds from ISCCP, we have also analyzed METEOSAT images from 1985, 1990, 1995 and 2000 (METEOSAT Archive at
http://www.eumetsat.de) using our own analysis method. Images from the IR channel have been calibrated to co-located AVHRR infrared channels. Tests have indicated that this is possible if the difference in time between the two satellite platforms is not more
25
than 15–20 min. Some difficulty in the temperature calibration has been present due to the difference in ground-pixel size of the two satellite platforms. This was especially the case for regions located furthest away from the nadir-viewing angle of METEOSAT,
ACPD
4, 6473–6501, 2004
Is there a trend in cirrus cloud cover due to aircraft traffic?
F. Stordal et al. Title Page Abstract Introduction Conclusions References Tables Figures J I J I Back Close Full Screen / Esc
Print Version Interactive Discussion
© EGU 2004
and in regions exhibiting large temperature inhomogeneity.
In our study the 440 mb temperature fields (from the ECMWF) with spatial resolu-tion of 2.5◦×2.5◦ are used for identifying high clouds in different regions. Daily 440mb temperature data from 1995 have been averaged and separated into four seasons: winter (December–February), spring (March–May), summer (June–August) and fall
5
(September–November). Thus, when an IR pixel reading at a given site and date is below the corresponding 440 mb temperature for the actual season, the pixel is clas-sified as cloudy. The 440 mb level is chosen as this is the bottom level of high clouds in the ISCCP classification. However, our procedure allows other kinds of high clouds than cirrus to be detected, like in the ISCCP IR dataset described above. Further,
10
the method fails to include thin cirrus cloud, for the same reason as for the ISCCP IR dataset.
METEOSAT is located over 0◦longitude (the Greenwich meridian), and the equato-rial location of the geostationary orbit means that the full disc view from the satellite cov-ers Africa, Europe, the Middle East, and the Atlantic Ocean. A complete METEOSAT IR
15
image consists of 2500×2500 pixels, which gives a spatial resolution of approximately 5 km at the sub-satellite point. Cloud information is retrieved from all these pixels, and thereafter average cloud coverage with 1◦×1◦ resolution is calculated. It should however be noted that the maximum latitude visible from a geostationary equatorial satellite is 81.27◦(EUMET, 2001).
20
Our high cloud analysis from METEOSAT is based on one image per day (12:00 UTC) in contrast to the ISCCP D2 data described above that are monthly aver-ages of cloud quantities at eight sequential 3-h periods every day. On the other hand, a better horizontal resolution is available and daily data have been extracted. Finally, using METEOSAT only for the entire north Atlantic flight corridor (NAFC) region avoids
25
the problem in the ISCCP data which is based on data from more than one satellite. Figure 3 shows results for cloud amount in our NILU/METEOSAT retrieval, given as the average over the four available years. The results are similar to the ones based on the ISCCP VIS/IR analysis (Fig. 2).
ACPD
4, 6473–6501, 2004
Is there a trend in cirrus cloud cover due to aircraft traffic?
F. Stordal et al. Title Page Abstract Introduction Conclusions References Tables Figures J I J I Back Close Full Screen / Esc
Print Version Interactive Discussion
© EGU 2004
2.3. Trend estimation
We have determined temporal trends in the two ISCCP datasets described in Sect. 2.1 and the dataset that we have derived as described in Sect. 2.2. For the two ISCCP datasets trends have been established in two different ways. First, the datasets were divided into two 8 years periods, 1984–1991 and 1992–1999. Trends were taken as the
5
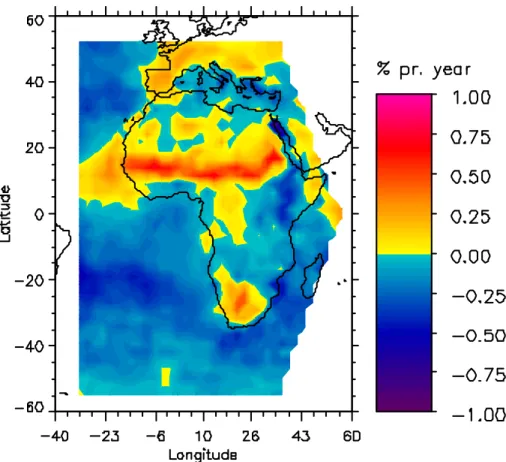
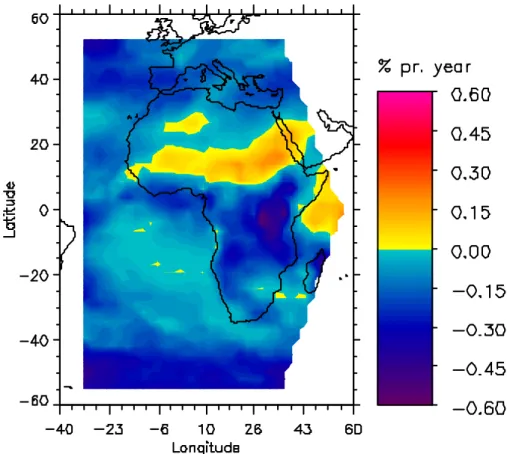
difference between the two periods (in % cloud cover/yr). Results are shown in Figs. 4 and 5 for the two ISCCP datasets, in an area covering a large part of the METEOSAT region. The strongest positive trends are found over central Africa in both datasets. It is important to notice that there are also large areas with negative trends. Similar trends are found also over large parts of Europe for cirrus in ISCCP VIS/IR. In general
10
the trends are somewhat stronger for cirrus in ISCCP VIS/IR than for high clouds in ISCCP IR.
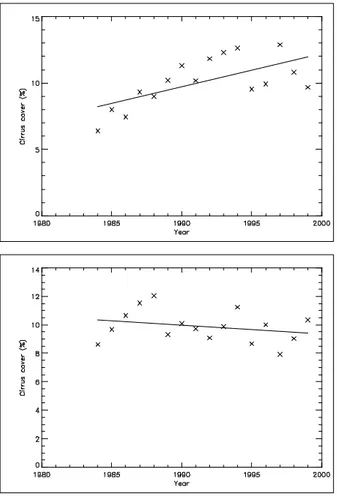
Second, trends were established from linear regression of the monthly mean data in the 16 years period. Figure 6 shows the temporal annual mean cirrus cover from ISCCP VIS/IR in two of the 2.5◦×2.5◦ grid boxes during the 16 years of our analysis
15
along with the regression lines. Two cases are shown in Fig. 6; one a location with high aircraft density and a positive trend in cirrus cloud cover (upper panel) and one location with low aircraft density and a negative trend in cirrus. The trends derived from linear temporal regression are similar to those derived from the differences between the latter and the former years of cirrus (not shown), although some differences have been
20
found, as will be shown in the following.
The satellite zenith angle dependence in the detection of cirrus and high clouds de-scribed in the previous section suggests that great care must be taken when patterns in derived trends are to be studied. This effect, combined with the changing satellite positions and numbers of satellites operating over the years, produces spatial
discon-25
tinuities in trends in cloud amount, much like what is the case in the data for cloud amount itself. Essentially they result from a change over the years in the viewing angle for each location. This puts a constraint on the use of trends from ISCCP, especially in
ACPD
4, 6473–6501, 2004
Is there a trend in cirrus cloud cover due to aircraft traffic?
F. Stordal et al. Title Page Abstract Introduction Conclusions References Tables Figures J I J I Back Close Full Screen / Esc
Print Version Interactive Discussion
© EGU 2004
investigations of geographical patterns. However, in ISCCP data viewing geometry and satellite identification are provided, helping reduce and overcome the problems raised above. To reduce the problems we have focused our trend analysis on regions which are covered by only one satellite in the ISCCP data. A particular emphasis has been on the METEOSAT region. METEOSAT has not moved in the whole period of record,
5
so that drifts in the zenith angle dependence are avoided.
Next we have derived trends in high clouds based on the NILU/METEOSAT retrieval. In this case the trends are calculated as the difference between the average of the two latter years (1995 and 2000) and the two former years (1985 and 1990). The trends are shown in Fig. 7. Many main features are in common with the data from ISCCP IR
10
in the METEOSAT region (Figs. 4 and 5), as high values over Africa and Europe and lower values over many oceanic regions. Still, there are significant differences between the two trend datasets. First, the trends are generally weaker in NILU/METEOSAT retrieval than in ISCCP IR. Second, the former dataset exhibits a finer structure, due to a better horizontal resolution. Also, contrasts between sub-regions are different in the
15
two datasets in some cases, as e.g. the Bay of Biscay versus the Sahara region.
3. Correlation with aircraft data
In this section we correlate trends determined in Sect. 2.3 with aircraft flight data. Global fuel usage, NOx emissions and km travelled were determined within the TRADEOFF project for 1992 and 2000 using the FAST model. FAST calculates 3D
20
inventories of fuel consumption, NOxemissions and distance travelled on a global grid, which is variable in horizontal and vertical dimensions as a user-specified input. For the TRADEOFF simulations, the inventories were generated at a vertical discretization of 610 m, equivalent to one flight level.
The FAST model has its origins in the ANCAT/EC2 emissions inventory (Gardner et
25
al., 1997; Gardner et al., 1998) and uses the same movement database for 1991/1992. Aircraft were modelled using representative 16 types and engine fuel-flow data for
ACPD
4, 6473–6501, 2004
Is there a trend in cirrus cloud cover due to aircraft traffic?
F. Stordal et al. Title Page Abstract Introduction Conclusions References Tables Figures J I J I Back Close Full Screen / Esc
Print Version Interactive Discussion
© EGU 2004
these 16 types were modelled using the PIANO aircraft performance model (Simos, 2003). Unlike previous inventories, the distance travelled per grid cell was also calcu-lated for the months of January, April, July and October. The variation in total global distance is rather small compared with the annual average, with a maximum variation of approximately 3%. The regional differences are, however, larger. The total distance
5
travelled by civil traffic in 1991/1992 was 17.4×10⁹km.
In order to determine fuel, emissions and distance for 2000, the model was used in forecast mode, in which the fleet was grown by statistics of Revenue Passenger Kilo-metres (RPK). Scenario data underlying the IPCC (1999) emission projections were used but it was first necessary to determine which growth rate (IS92a, e or c) was
ap-10
propriate for the period 1992 to 2000. ICAO RPK data were compared with the IPCC RPK scenario data and the actual growth rate between 1992 and 2000 was stronger than that suggested by the IS92e scenario. Thus, the “e” projection was utilized result-ing in a global distance travelled of 25.1×10⁹km. The distance travelled is non-linear with fuel; the fuel consumption increase estimated over the period was 33%, whereas
15
the increase in total distance was approximately 44%.
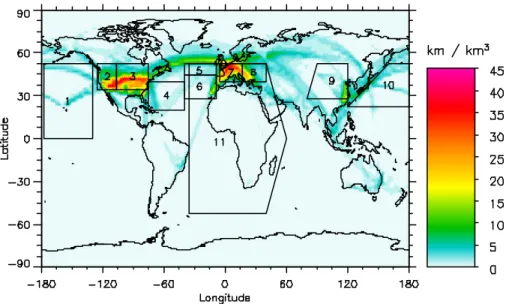
The distance flown is believed to be the parameter that most closely relates to the ability of aircraft to form contrails that later can develop into cirrus clouds, given that the environment is suitable for forming contrails. This parameter is thus used in the following analysis. Yearly averaged data for 2000 have been applied. Figure 8 shows
20
a global map of the volume density of the distance flown (km flown/km3 volume) at an altitude favourable of contrail and cirrus formation, taken to be the region 9760– 11 590 m (layer 17–19).
In the following we correlate trends in cirrus and high clouds with aircraft flight data. In order to avoid the problems related to the satellite zenith angle dependence in
25
the cloud detection in combination with the use of several satellites in ISCCP (see Sects. 2.1 and 2.3) we have selected 11 different regions of investigation that are cov-ered by only one single satellite. These 11 regions are also shown in Fig. 8. Region 11 covers most of the METEOSAT area that is in common between the ISCCP and
ACPD
4, 6473–6501, 2004
Is there a trend in cirrus cloud cover due to aircraft traffic?
F. Stordal et al. Title Page Abstract Introduction Conclusions References Tables Figures J I J I Back Close Full Screen / Esc
Print Version Interactive Discussion
© EGU 2004
NILU/METEOSAT datasets used in this work.
The trends in cirrus as seen in the ISCCP VIS/IR dataset (Fig. 4) in the METEOSAT region reveal a pattern with a general tendency of larger trends over land than over ocean in the European sector. Changes in cloud cover in this region could be due to aircraft activity, but certainly also to high natural variability in this region. They could
5
possibly also be caused by a climate change over the period of investigation. The large changes in cirrus cloud cover over Africa are certainly not due to aircraft. A few recent studies have pointed out that changes in anthropogenic aerosol emissions could have affected cloud cover in this region (Rotstayn and Lohmann, 2002; Lelieveld et al., 2002; Kristjansson, 2002). To reduce the impact of phenomena other than aircraft, we have
10
selected 11 regions of further investigation so that they broadly cover either land or ocean areas.
In the spatial correlation between trends in clouds and aircraft density we have used linear regression. We have determined the regression slope, given as (% cloud cover/yr)/(km flown/km3 volume) and the correlation coefficient. To eliminate natural
15
fluctuation in areas with very little aircraft activity we have generally introduced a cut-off limit for aircraft density, below which we exclude the data from the analysis. We have investigated spatial correlation based on all the different temporal trends used in this investigation, on flight data in various altitude regions, and on various cut-off levels. 3.1. Reference case
20
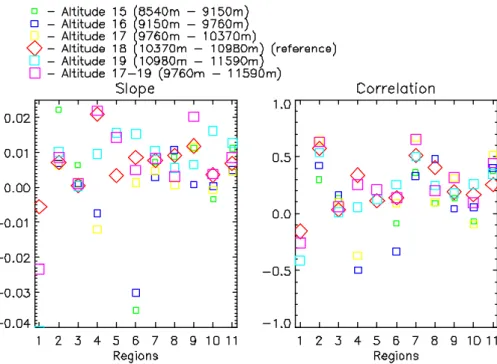
We have defined one reference case, namely a spatial correlation between the trends in cirrus based on ISCCP VIS/IR derived as differences between the 8 years periods 1992–1999 and 1984–1991 and aircraft data at layer 18, using a cut-off limit for aircraft density of 1.0 km/km3. The results for the 11 regions are shown in Fig. 9 for this case (along with other cases which will be discussed below).
25
Correlation coefficients around 0.5 are found in region no. 2 (western US), no. 7 and no. 8 (Europe). These regions have in common a generally high aircraft density, also with some contrasting areas with lower traffic density (especially regions 2 and
ACPD
4, 6473–6501, 2004
Is there a trend in cirrus cloud cover due to aircraft traffic?
F. Stordal et al. Title Page Abstract Introduction Conclusions References Tables Figures J I J I Back Close Full Screen / Esc
Print Version Interactive Discussion
© EGU 2004
8). The slopes are similar in these regions, around 0.01 (% yr−1)/(km km−3). For the METEOSAT region (no. 11), the correlation coefficient is slightly lower. The slope in this region is slightly below 0.01 (% yr−1)/(km km−3).
3.2. Comparative cases
Contrails and cirrus can only form at low temperatures and therefore at relatively high
5
altitudes in the troposphere. We have investigated the correlation between cirrus trends and aircraft density above 8540 m and below 11 590 m which encompasses the altitude range of the cruise level of most commercial flights. The results are shown in Fig. 9. The altitude level that yields the best correlation varies slightly between the regions. However, the three regions with the strongest correlation in the reference case have
10
similar correlations for layers 18–19 (region 7 also for layer 17 and region 8 also layer 16–17), with slightly weaker correlations for lower altitude levels. The slopes for the three regions of highest correlation fall within a factor 2 for the altitude levels of highest correlation (layer 18 and 19).
Next we have compared use of temporal trends derived from the two different
meth-15
ods for ISCCP VIS/IR data. Figure 10 shows that the use of temporal trends derived from regression rather than difference between two periods lower the spatial correla-tion with aircraft activity, especially in the regions of highest correlacorrela-tion (in particular regions 7 and 8 over Europe, where also the slopes are reduced considerably). On the other hand, the impact of varying cut-off levels is less, as also shown in Fig. 10.
20
Finally, in Fig. 11 we have compared results based on ISCCP data (IR only as well as VIS/IR) with those of the NILU/METEOSAT retrieval. In this case only regions within the METOSAT region are considered (5–8 and 11). As expected, due to classification of thin cirrus as lower clouds in the datasets based on IR only (ISCCP IR as well as NILU/METEOSAT), the spatial correlation with aircraft density is weaker for these
25
datasets than for the cirrus dataset based on ISCCP VIS/IR. Our analysis shows that this is the case especially in regions with the best correlation for cirrus (ISCCP VIS/IR).
ACPD
4, 6473–6501, 2004
Is there a trend in cirrus cloud cover due to aircraft traffic?
F. Stordal et al. Title Page Abstract Introduction Conclusions References Tables Figures J I J I Back Close Full Screen / Esc
Print Version Interactive Discussion
© EGU 2004
Differences are less between cases using different cut-off levels (0.0 vs. 1.6 km km−3). The variations in the slopes between the various cases to a large extent follow the variations in the correlation coefficients.
4. Aircraft impact on cirrus cover
Based on the various cases presented in the previous section, the correlation between
5
trends in cloud amount and aircraft traffic suggests that aircraft may have influenced cirrus. This is most clearly seen in the trends in ISCCP VIS/IR data, which include more of the thinner cirrus than the other two datasets. The correlations with aircraft density are above 0.5 in certain regions. In order to declare an undisputed relationship between cirrus and air traffic, one would need to have a higher correlation coefficient.
10
However, clearly natural variability in cirrus clouds would mask such a relationship and weaken the correlation. We regard the results that we have found to be indicative of an impact of aircraft on cirrus amount. The slope in the regions with the strongest correlation is around 0.01 (% yr−1)/(km km−3). It is worth noticing that the aircraft density is rather high in these areas.
15
In order to assess the potential global impact of aircraft on cirrus formation one needs to extrapolate the above results to a global scale. Based on the results presented in Sect. 3.2 this can only be done in a rather crude manner. We estimate the impact of aircraft on cirrus formation by using the slope in the regions with strongest correlation (0.01 (% yr−1)/(km km−3)), and assuming that only flights in levels 17–19 can cause
20
cirrus formation (based on Fig. 9). We multiply the slope by the global aircraft traffic density in layer 17–19 (1.2 km km−3). As the aircraft traffic in 1984 was about 50% of the aircraft traffic in 2000 (an increase over 8 years of 44% as given in Sect. 3, yields a factor 2 increase over 16 years) an additional multiplication with a factor 2 must be made to take into account the total aircraft traffic influence on cirrus clouds. In
25
this last consideration we assume that the geographical pattern has not been changed significantly during the time of aircraft activity. Further multiplying with the length of the
ACPD
4, 6473–6501, 2004
Is there a trend in cirrus cloud cover due to aircraft traffic?
F. Stordal et al. Title Page Abstract Introduction Conclusions References Tables Figures J I J I Back Close Full Screen / Esc
Print Version Interactive Discussion
© EGU 2004
period of investigation (16 yr), we arrive at changes in cirrus amount of 0.4 % for layer 17–19 due to aircraft. Assuming that the radiative forcing change is the same per unit of cloud cover for aircraft induced cirrus and contrails (0.12 W m−2per 1% cloud cover, see e.g. Myhre and Stordal, 2001 and references therein), we arrive at a global mean radiative forcing change due to an aircraft effect on cirrus that is 0.05 W m−2. We use
5
the radiative impact of contrails for aircraft induced cirrus which is likely lower than the one for cirrus on a global scale, as cirrus in the tropics have a larger longwave radiative effect.
Europe is the area within the region covered by METEOSAT which has the highest aircraft density. In this region the slope of the regression between trends in cirrus and
10
aircraft density is about 0.01 (% yr−1)/(km km−3). The aircraft density is slightly above 20 km km−3. This yields a trend in cirrus due to aircraft of 2 %/decade (note that this is in absolute % point units for cirrus cloud coverage). This is very similar to the result derived for Europe by Zerefos et al. (2003), who also based their analysis on the same ISCCP data, but used a different statistical approach. Quite important, Zerefos
15
et al. (2003) found an increase in cirrus cover in high air traffic areas of Europe of +1.3%/decade, contrasted by a decrease of 0.2%/decade in low air traffic areas, which can be interpreted as a 1.5%/yr trend in cirrus due to aircraft.
5. Discussion
In this study we have found indications that cirrus cloud amount increases have
ac-20
companied an increase in air traffic in the 16 year period 1984–1999 contrasting a general negative trend. However, the relationship between cirrus cloud amount and aircraft density is uncertain and we cannot draw firm conclusions or quantify the effect with high certainty. We find the strongest influence on cirrus clouds, as manifested in the ISCCP VIS/IR dataset, in parts of the regions with highest aircraft traffic. Our
re-25
sults may be influenced by natural variability, climate change, and other anthropogenic impacts.
ACPD
4, 6473–6501, 2004
Is there a trend in cirrus cloud cover due to aircraft traffic?
F. Stordal et al. Title Page Abstract Introduction Conclusions References Tables Figures J I J I Back Close Full Screen / Esc
Print Version Interactive Discussion
© EGU 2004
Our estimate of the radiative forcing (0.05 Wm−2) is close to the number given in the IPCC (1999) (upper limit in their assessment is 0.04 Wm−2), but significantly larger that the value estimated by Minnis et al. (2004), who calculate an upper limit for the total effect of cirrus and contrails of 0.026 Wm−2 in the mid 1990s. It is significant compared to the number for the total radiative forcing due to aircraft from all effects
5
other than cirrus, which is 0.1 W m−2 (IPCC, 1999). In this study, if we choose slopes for the regression between trends in cirrus and aircraft density that represent average between the three regions of highest correlation (regions 2, 7 and 8) in stead of the highest slope, we arrive at a radiative forcing of 0.04 Wm−2. On the other hand, our forcing efficiency of 0.12 Wm−2per 1% cirrus cloud cover is smaller than the one used
10
by Boucher (1999), but a recent estimate of contrails yields a smaller number mainly due to a slightly different altitude of the clouds and a smaller optical depth (Ponater et al., 2002; Marquart et al., 2003). However, with our estimate a cirrus cloud cover which is aircraft induced of about 7% in the regions with most aircraft traffic is clearly a large amount as can be seen from Fig. 1. This corresponds to approximately 2%/decade
15
increase in cirrus cover due to aircraft. This falls between the trend in cirrus due to aircraft deduced for Europe by Zerefos et al. (2003), as discussed above, and Boucher (1999) who found an increase of almost 3%/decade in cirrus over continental regions with high aircraft traffic.
In conclusion there are indications that cirrus cloud cover increased over the last
20
two decades of the previous century in regions with high aircraft traffic, contrasting a general decrease in cirrus for other reasons. From our results we conclude that cirrus from aircraft can potentially contribute to global warming over the last few decades. However, the correlations between cirrus change and aircraft traffic is only moderate, as many other factors may also have contributed to changes in cirrus over the same
25
time period.
Acknowledgements. This work was supported by the EU funded project TRADEOFF. We thank
ACPD
4, 6473–6501, 2004
Is there a trend in cirrus cloud cover due to aircraft traffic?
F. Stordal et al. Title Page Abstract Introduction Conclusions References Tables Figures J I J I Back Close Full Screen / Esc
Print Version Interactive Discussion
© EGU 2004
References
Boucher, O.: Air traffic may increase cirrus cloudiness, Nature, 397, 30–31, 1999.
Chagnon, S. A.: Midwestern cloud, sunshine and temperature trends since 1901 – Possible evidence of jet contrail effects, J. Appl. Meteorol., 20, 496–508, 1981.
Duda, P. D., Minnis, P., Nguyen, L., and Palikonda, R.: A case study of the development of
5
contrail clusters over the Great lakes, J. Atmos. Sci., 61, 1132–1146, 2004.
EUMET: The METEOSAT Archive – User Handbook, EUM TD 06–2.6, November 2001,http:
//www.eumetsat.de), 2001.
Gardner, R. M. (Ed.): ANCAT/EC2 aircraft emissions inventories for 1991/92 and 2015: Final Report.EUR-18179, ANCAT/EC Working Group, 84 pp.+ appendices, ISBN-92-828-2914-6,
10
1998.
Gardner, R. M., Adams, K., Cook, T., Ernedal, S., Falk, R., Fleuti, E., Herms, E., Johnson, C. E., Lecht, M., Lee, D. S., Leech, M., Lister, D., Mass ´e, B., Metcalfe, M., Newton, P., Schmitt, A., Vandenbergh, C., and van Drimmelen, R.: The ANCAT/EC global inventory of NOxemissions from aircraft, Atmospheric Environment, 31, 1751–1766, 1997.
15
IPCC: Aviation and the Global Atmosphere, A Special Report of IPCC (Intergovernmental Panel on Climate Change), edited by Penner, J. E., Lister, D. H., Griggs, D. J., Dokken, D. J., and McFarland, M., Cambridge University Press, Cambridge, UK, 1999.
IPCC: Intergovernmental Panel on Climate Change, Third Assessment Report, Cambridge Uni-versity Press, Cambridge, UK, 2001.
20
Jin, Y., Rossow, W. B., and Wylie, D. P.: Comparison of the climatologies of high-level clouds from HIRS and ISCCP, J. Climate, 9, 2850–2879, 1996.
Kristjansson, J. E.: Studies of the aerosol indirect effect of sulphate and black carbon aerosols, J. Geophys. Res., 107, No. D15, 10.1029/2001JD000887, 2002.
Lelieveld, J., Berresheim, H., Borrmann, S. et al.: Global air pollution crossroads over the
25
Mediterranean, Science, 298, 794–799, 2002.
Liao, X., Rossow, W. B., and Rind, D.: Comparison between SAGE II and ISCCP high-level clouds, Part I: Global and zonal mean cloud amounts, J. Geophys. Res., 100, 1121–1135, 1995.
Machta, L. and Carpenter, T.: Trends in high cloudiness in Denver and Salt Lake City, in Man’s
30
Impact on Climate, edited by Matthews, W. H., Kellogg, W. W., and Robinson, G. D., MIT Press, Cambridge, Massachusetts, and London, UK, 1971.
ACPD
4, 6473–6501, 2004
Is there a trend in cirrus cloud cover due to aircraft traffic?
F. Stordal et al. Title Page Abstract Introduction Conclusions References Tables Figures J I J I Back Close Full Screen / Esc
Print Version Interactive Discussion
© EGU 2004
Marquart, S., Ponater, M., Mager, F., and Sausen, R.: Future Development of Conrail Cover, Optical Depth, and Radiative Forcing : Impacts of Increasing Air Traffic and Climate Change, J. Climate, 16, 2890–2904, 2003.
Minnis, P., Young, D. F., Garber, D. P., Nguyen, L., Smith jr., W. L., and Palikonda, R.: Trans-formation of contrails into cirrus during SUCCESS, Geophys. Res. Lett., 25, 1157–1160,
5
1998.
Minnis, P., Kirk Ayers, J., Palikonda, R., and Phan, D.: Contrails, Cirrus Trends, and Climate,J. Climate, 17, 1671–1685, 2004.
Minnis, P., Schumann, U., Doelling, D. R., Gierens, K. M., and Fahey, D. W.: Geophys. Res. Lett., 26, 1853–1856, 1999.
10
Myhre, G. and Stordal, F.: On the tradeoff of the solar and thermal infrared radiative impact of contrails, Geophys. Res. Lett., 28, 3119–3122, 2001.
Ponater, M., Marquart, S., and Sausen, R.: Contrails in a comprehensive global cli-mate model: Parametrization and radiative forcing results, J. Geophys. Res., 107, 10.1029/2001JD000429, 2002.
15
Rossow, W. B. and Garder, L. C.: Cloud detection using satellite measurements of infrared and visible radiances for ISCCP, J. Climate, 6, 2341–2369, 1993.
Rossow, W. B. and Schiffer, R. A.: ISCCP Cloud data products, Bull. Amer. Meteor. Soc., 72, 2–20, 1991.
Rossow, W. B. and Schiffer, R. A.: Advances in understanding clouds from ISCCP, Bull. Amer.
20
Meteor. Soc., 80, 2261–2287, 1999.
Rossow, W. B., Garder, L. C., Lu, P. J., and Walker, A. W.: International satellite Cloud Clima-tology Project (ISCCP) Documentation of Cloud Data, WMO/TD-No. 266 (Revised), World Meteorological Organisation, Geneva, 76+ pp, available from World Meteorological Organi-zation, Geneva, Switzerland, 1991.
25
Rotstayn, L. D. and Lohmann, U.: Tropical rainfall trends and the indirect aerosol effect, J. Climate, 15, 2103–2116, 2002.
Schiffer, R. A. and Rossow, W. B.: ISCCP global radiance data set: A new resource for climate research, Bull. Amer. Meteor. Soc., 66, 1498–1505, 1985.
Simos: PIANO Project Interactive Analysis and Optimisation aircraft performance tool, http:
30
//www.lissys.demon.co.uk, 2003.
Stubenrauch, C. J., Rossow, W. B., Cheruy, F., Chedin, A., and Scott, N. A.: Clouds as seen by satellite sounders (3I) and imagers (ISCCP), Part 1: Evaluation of cloud parameters, J.
ACPD
4, 6473–6501, 2004
Is there a trend in cirrus cloud cover due to aircraft traffic?
F. Stordal et al. Title Page Abstract Introduction Conclusions References Tables Figures J I J I Back Close Full Screen / Esc
Print Version Interactive Discussion
© EGU 2004
Climate, 12, 2189–2213, 1999.
Travis, D. J., Carleton, A. M., and Lauritsen, R. G.: Contrails reduce daily temperature range, Nature, 418, 601, 2002.
Wylie, D. P. and Menzel, W. P.: Eight years of high cloud statistics using HIRS, J. Climate, 12, 170–184, 1999.
5
Zerefos, C. S., Eleftheratos, K., Balis, D. S., Zanis, P., Tselioudis, G., and Meleti, C.: Evidence of impact of aviation on cirrus cloud formation, Atmos. Chem. Phys., 3, 1633–1644, 2003,
ACPD
4, 6473–6501, 2004
Is there a trend in cirrus cloud cover due to aircraft traffic?
F. Stordal et al. Title Page Abstract Introduction Conclusions References Tables Figures J I J I Back Close Full Screen / Esc
Print Version Interactive Discussion
© EGU 2004
17
Figure 1: Global map of average cirrus cover based on ISCCP VIS/IR data for the period
1984-1999.
Fig. 1. Global map of average cirrus cover based on ISCCP VIS/IR data for the period 1984– 1999.
ACPD
4, 6473–6501, 2004
Is there a trend in cirrus cloud cover due to aircraft traffic?
F. Stordal et al. Title Page Abstract Introduction Conclusions References Tables Figures J I J I Back Close Full Screen / Esc
Print Version Interactive Discussion
© EGU 2004
18
Figure 2: Global map of average high cloud cover based on ISCCP IR data for the period
1984-1999.
Fig. 2. Global map of average high cloud cover based on ISCCP IR data for the period 1984– 1999.
ACPD
4, 6473–6501, 2004
Is there a trend in cirrus cloud cover due to aircraft traffic?
F. Stordal et al. Title Page Abstract Introduction Conclusions References Tables Figures J I J I Back Close Full Screen / Esc
Print Version Interactive Discussion
© EGU 2004
Figure 3: Average (85, 90, 95, 00) high cloud cover based on the NILU/METEOSAT retrieval
Fig. 3. Average (85, 90, 95, 00) high cloud cover based on the NILU/METEOSAT retrieval.
ACPD
4, 6473–6501, 2004
Is there a trend in cirrus cloud cover due to aircraft traffic?
F. Stordal et al. Title Page Abstract Introduction Conclusions References Tables Figures J I J I Back Close Full Screen / Esc
Print Version Interactive Discussion
© EGU 2004
20
Figure 4: Changes in cirrus from ISCCP VIS/IR in part of the METEOSAT region, based on
differences between the two periods 1992-1999 and 1984-1991 (in % cloud cover per year).
Fig. 4. Changes in cirrus from ISCCP VIS/IR in part of the METEOSAT region, based on differences between the two periods 1992–1999 and 1984–1991 (in % cloud cover per year).
ACPD
4, 6473–6501, 2004
Is there a trend in cirrus cloud cover due to aircraft traffic?
F. Stordal et al. Title Page Abstract Introduction Conclusions References Tables Figures J I J I Back Close Full Screen / Esc
Print Version Interactive Discussion
© EGU 2004
21
Figure 5: Changes in high clouds from ISCCP IR in part of the METEOSAT region, based on
differences between the two periods 1992-1999 and 1984-1991 (in % cloud cover per year).
Fig. 5. Changes in high clouds from ISCCP IR in part of the METEOSAT region, based on differences between the two periods 1992–1999 and 1984–1991 (in % cloud cover per year).
ACPD
4, 6473–6501, 2004
Is there a trend in cirrus cloud cover due to aircraft traffic?
F. Stordal et al. Title Page Abstract Introduction Conclusions References Tables Figures J I J I Back Close Full Screen / Esc
Print Version Interactive Discussion
© EGU 2004
Figure 6: Cirrus cover (%) from ISCCP VIS/IR in two 2.5°×2.5° grid box in Europe: upper panel 1.25°E, 46.25°N, lower panel 38.75°E, 41.25°N. Data are yearly averages. Also shown are the temporal linear regression lines. The correlation coefficients are 0.65 and 0.26 respectively.
Fig. 6. Cirrus cover (%) from ISCCP VIS/IR in two 2.5◦×2.5◦ grid box in Europe: upper panel 1.25◦E, 46.25◦N, lower panel 38.75◦E, 41.25◦N. Data are yearly averages. Also shown are the temporal linear regression lines. The correlation coefficients are 0.65 and 0.26, respectively.
ACPD
4, 6473–6501, 2004
Is there a trend in cirrus cloud cover due to aircraft traffic?
F. Stordal et al. Title Page Abstract Introduction Conclusions References Tables Figures J I J I Back Close Full Screen / Esc
Print Version Interactive Discussion
© EGU 2004
Figure 7: Changes in high cloud cover in the NILU/METEOSAT retrieval, as differences between two pair of years, from the average of 1985 and 1990 to the average of 1995 and 2000 (in % cloud cover per year).
Fig. 7. Changes in high cloud cover in the NILU/METEOSAT retrieval, as differences between two pair of years, from the average of 1985 and 1990 to the average of 1995 and 2000 (in % cloud cover per year).
ACPD
4, 6473–6501, 2004
Is there a trend in cirrus cloud cover due to aircraft traffic?
F. Stordal et al. Title Page Abstract Introduction Conclusions References Tables Figures J I J I Back Close Full Screen / Esc
Print Version Interactive Discussion
© EGU 2004
24
Figure 8: Global map of distance flown with aircraft (km flown/km
3voulme) at altitude layer
17-19 (9.760 – 11.590 m altitude). Also shown are 11 regions used for trend analysis.
Fig. 8. Global map of distance flown with aircraft (km flown/km3voulme) at altitude layer 17–19 (9760–11 590 m altitude). Also shown are 11 regions used for trend analysis.
ACPD
4, 6473–6501, 2004
Is there a trend in cirrus cloud cover due to aircraft traffic?
F. Stordal et al. Title Page Abstract Introduction Conclusions References Tables Figures J I J I Back Close Full Screen / Esc
Print Version Interactive Discussion
© EGU 2004
Figure 9: Results of spatial regression analysis between trends in cirrus cloud amount from ISCCP VIS/IR and aircraft traffic density, for the slope in (% yr-1)/(km km-3) and the correlation coefficient. Temporal trends have been determined from differences between two 8 year periods, traffic data are taken from individual altitude layers from 15 (bottom at 8.540 m) to layer 19 (top at 11.590 m) as well as the region encompassing all layers 17-19. The analysis using the aircraft density data from layer 18 is the reference case in this study.
Fig. 9. Results of spatial regression analysis between trends in cirrus cloud amount from IS-CCP VIS/IR and aircraft traffic density, for the slope in (% yr−1
)/(km km−3) and the correlation coefficient. Temporal trends have been determined from differences between two 8 year peri-ods, traffic data are taken from individual altitude layers from 15 (bottom at 8540 m) to layer 19 (top at 11 590 m) as well as the region encompassing all layers 17–19. The analysis using the aircraft density data from layer 18 is the reference case in this study.
ACPD
4, 6473–6501, 2004
Is there a trend in cirrus cloud cover due to aircraft traffic?
F. Stordal et al. Title Page Abstract Introduction Conclusions References Tables Figures J I J I Back Close Full Screen / Esc
Print Version Interactive Discussion
© EGU 2004
Figure 10: As Figure 9, for altitude 18 only, but with temporal trends derived also from linear regression, and for an alternative cut-off level for aircraft density.
Fig. 10. As Fig. 9, for altitude 18 only, but with temporal trends derived also from linear regres-sion, and for an alternative cut-off level for aircraft density.
ACPD
4, 6473–6501, 2004
Is there a trend in cirrus cloud cover due to aircraft traffic?
F. Stordal et al. Title Page Abstract Introduction Conclusions References Tables Figures J I J I Back Close Full Screen / Esc
Print Version Interactive Discussion
© EGU 2004
Figure 11: As Figure 10, but for ISCCP cirrus (from the VIS/IR) as well as high clouds (IR only) and high clouds from NILU/METEOSAT, and alternatively with cut-off for aircraft density at 0. In this figure results are shown only for regions covered by METEOSAT.
Fig. 11. As Fig. 10, but for ISCCP cirrus (from the VIS/IR) as well as high clouds (IR only) and high clouds from NILU/METEOSAT, and alternatively with cut-off for aircraft density at 0. In this figure results are shown only for regions covered by METEOSAT.

![[PDF] Cours Word avec exemples : Insérer un tableau | Cours informatique](data:image/gif;base64,R0lGODlhAQABAIAAAP///wAAACH5BAEAAAAALAAAAAABAAEAAAICRAEAOw==)