HAL Id: hal-01499812
https://hal.archives-ouvertes.fr/hal-01499812
Submitted on 3 Apr 2017HAL is a multi-disciplinary open access archive for the deposit and dissemination of sci-entific research documents, whether they are pub-lished or not. The documents may come from teaching and research institutions in France or abroad, or from public or private research centers.
L’archive ouverte pluridisciplinaire HAL, est destinée au dépôt et à la diffusion de documents scientifiques de niveau recherche, publiés ou non, émanant des établissements d’enseignement et de recherche français ou étrangers, des laboratoires publics ou privés.
A new simple integral technique to analyze bedload
transport data
F. Métivier, C. Narteau, E. Lajeunesse, O Devauchelle, Y Liu, B. Ye
To cite this version:
F. Métivier, C. Narteau, E. Lajeunesse, O Devauchelle, Y Liu, et al.. A new simple integral technique to analyze bedload transport data. River, Coastal and Estuarine Morphodynamics, 2011, Beijing, China. pp.378–387. �hal-01499812�
River, Coastal and Estuarine Morphodynamics: RCEM2011 © 2011 Tsinghua University Press, Beijing
A simple integral technique to analyze bed load transport data
François METIVIER, Clément NARTEAU, Eric LAJEUNESSE,
Olivier DEVAUCHELLE
Equipe de dynamique des fluides géologiques
Institut de Physique du Globe de Paris, Sorbonne Paris Cité, Univ Paris Diderot UMR 7154 CNRS, F-75005 Paris, France
LIU Youcun
Key Laboratory of Water Environment and Resource Tianjin Normal University
393 Binshui west road, Tianjin 300387, China
YE Baisheng
The States Key laboratory of Cryospheric Science
Cold and Arid Region Environmental and Engineering and Research Institute Chinese Academy of Sciences
260 Donggang west road, Lanzhou, China
ABSTRACT: We describe a simple technique for the analysis of bed load transport data. The technique rests on a simple Rieman sum of bed load fluxes measured against some control variable (e.g. shear stress, discharge). We apply this technique to both natural and synthetic datasets. The natural dataset comes from the Urumqi river survey in the Chinese Tianshan. The synthetic datasets are produced by modeling bed load transport as a Poisson distribution whose parameter depends on shear stress only. One hundred sets of 30, 100 and 500 measurements are produced for two sets of shear stresses, one without uncertainty and one produced using a lognormal distribution. All together 600 synthetic surveys and corresponding datasets are produced and fitted using the integral method and two other conventional techniques, namely moving averages and binning. When compared to other techniques the integral presents the same efficiency, in terms of recovering the average sediment transport law, but it presents two practical advantages. It is not parametrized and therefore not dependent on the choice of parameters and it can be used for small small samples when other methods fail on natural datasets.
1 INTRODUCTION
Bed load is an essential component of gravel bed rivers dynamics. It controls the morphology of gravel bed rivers. It is the mode of movement of the material that forms alluvial piedmonts in the front of many mountain ranges. The transported gravels are an essential component of abrasion. Bed load may induce hazard to civil engineering constructions, such as dams, road, and bridges. Eventually, in mountain streams, it can account for a non negligible portion of the total load.
Surveys of bed load can be performed using different techniques. The most common devices used to measure movement of gravels are hand or cable held pressure difference samplers (e.g. Bunte and Abt, 2005; Diplas et al., 2008; Ryan and Porth, 1999). Many versions exist with different hydraulic efficiency and size.
Whatever the technique used to measure movement of gravelly material, the fluxes obtained vary within more than an order of magnitude. There is much debate about the reasons for this variability. The first and probably most important factor is the highly stochastic nature of bed load movement (Hung and Shen,
1974; Ergenzinger and Schmidt, 1990; Pitlick, 1988). The second reason for uncertainty is related to both the sampler type and the sampling procedures (Ryan and Porth, 1999). Expansion ratio and the mesh size of the nylon bag influence flow velocity (Hubbell, 1987; Diplas et al., 2008). As the bag fills the efficiency changes. Positioning of the sampler can induce dislodging of large gravels and under sampling of sands (e.g. Bunte and Abt, 2005; Ryan and Porth, 1999; Vericat et al., 2006),
Nowadays, several techniques are used to average the values obtained using portable samplers and traps in order to smooth the variability and minimize the number of vanishing fluxes measured for conditions that are above incipient motion. The most common techniques are moving average and binning (Press et al., 1989; Kuhnle, 1992). Moving average and binning procedures imply the arbitrary definition of parameters. These are the averaging window and step length for moving averages and the bin size for binning procedures.
Note that in addition to these smoothing techniques data are often averaged over the river section. Although this technique is useful to derive sediment rating curves relating stage or discharge to bed load fluxes, it has been proven to be inadequate for the analysis of local transport dynamics (Ferguson, 2003; Liu et al., 2008; Paola and Mohrig, 1996). Shear stress distribution in the channel is not uniform but varies according to local depth, slope, roughness and velocity distribution. It also varies according to the distance from the banks. It has therefore been shown that sediment transport estimated using section-average values of the shear stress most probably strongly under-predict sediment transport at low flows. This problem is equally valid for single thread streams of braided streams.
Here we define a new and simple integral technique that has the same efficiency as other techniques and has no parameter. We first theoretically describe the technique, then compare it to a synthetic dataset and eventually to a natural dataset leveled on the Urumqi River in the Chinese Tianshan.
2 DEFINITION OF THE BED LOAD INTEGRAL
Assume that we collected measurements of shear stress . The measurements are ordered by ascending order so that . Each of these values of shear stress is associated to a measurement of bed load . Let be the -th measurement of sediment flux, and the associated value of the shear stress. If we assume that the mean value of the sediment flux is a function of the shear stress, we can decompose it as
(1)
where every is a random variable whose probability density function is parameterized only by the shear stress. Its mean over realizations (denoted ) vanishes1, and its variance is a function only of
:
(2)
Let be the total number of measurements. Given the n first measurements ( ) we define as the Rieman sum of bed load fluxes over the shear stress range
(3) Let be the equivalent sum of the errors:
(4) Equation(3) can be rewritten as
(5) The mean over realizations is linear, so
1
Note that this is true only far above the threshold. Indeed, for very low sediment transport rates, the bed load sampler can only overpredict transport rates, since only positive numbers of grains are measured(Bunte and Abt, 2005).
380
(6)
since the mean of vanishes for an unbiased measurement. In addition, the last member of equation (5) tends to the integral of the transport function , provided the density of the measurements is sufficiently high. Consequently,
(7)
Equation (7) shows that integration smooths out the random component associated with individual bed load measurements and that the bed load integral converges towards the integral of the average bed load transport. Hence approaches as n becomes large.
In conclusion, it is possible to filter out the random component of bed load by integration. If the dataset is dense enough, that is if the difference between two consecutive values of shear stress is small, than the bed load integral should approximate the exact integral of the average bed load transport function .
3 TEST ON SYNTHETIC DATASETS 3.1 Synthetic datasets
In order to produce synthetic datasets we use a two steps procedure. First we produce a dataset of shear stresses then for each shear stress we calculate a value of bed load transport. Shear stress is obtained by two different techniques. First we assume that there is no measurement error and that the virtual observer is able to explore systematically the range of possible flow conditions. The shear stres dataset in this first case is simply a regularly spaced (in log scale) ensemble of values extending from a minimum to a maximum shear. As this situation is never achieved in nature we use a second procedure which consists in producing a random shear stress distribution. In this second case the logarithm of shear stress follows a normal distribution. The choice of this distribution comes from our observations on the Urumqi river (see below) (figure 1). Here we use a distribution centered around with a standard deviation of as for the Urumqi river.
Figure 1 Probability density distribution of measured shear stresses in the Urumqi river and fitted normal distribution for
Once the dataset of shear stress is obtained we calculate for each value of shear stress the corresponding value of the “measured” flux. We know from our measurements that the average bed load flux of the urumqi river from a thourough analysis (Metivier et al. manuscript in in prep) is
(8)
This flux corresponds to a number N of particles of a given representative grain size of the river (here we use a typical grain size of 5cm).
(9)
where is the sampler’s width. For a sampling time T this corresponds to a an average number of particles of
(10)
In order to capture the stochastic nature of sediment transport and create synthetic datasets that have a shape similar to the dataset of the Urumqi river we simply assume that the number of particles caught by a sampler follows a Poisson distribution of parameter (Hung and Shen, 1974; Ergenzinger and Schmidt, 1990; Chung, 1979; NIST/SEMATECH, 2009). The major outcome of chosing a Poisson distribution comes from the fact that, for low values of shear stress, the probability to catch a grain is so small that one catches almost always no grains. Even for larger stresses there is a possibility that a sampling leads to no catch hence a measured zero flux. On the contrary there is always a small but non zero probability to catch grains during one measurement.
3.2 Comparison with other averaging techniques
We developed an automatic four step objective procedure to compare between the integral technique and classical averaging techniques.
1. We first apply a given averaging technique (Integral, Binning, Moving average). When a technique is parametrized, successive values of parameters and combinations of values are explored.
2. We then remove NaN values, if they exist. These values do not correspond to zeros fluxes. They correspond for example to a range of shear stress for which no measurement was performed. 3. As the resulting averages are sorted by rising shear stress, we exclude the first null fluxes of bed
load. These values are thought to correspond to conditions of flow that are below threshold. 4. Eventually each resulting dataset is fitted by a best fit power law using a Levenberg-Marquart
least square algorithm (Press et al., 1989).
Comparison with binning
Binning is the most simple averaging technique. It consists in the decomposition of the range of measured shear stresses into constant intervals. Within each interval, all measurements of bed load are averaged. Intervals can be calculated on the shear stress (linear bins) or on the logarithm of the shear stress (log linear bins). The latter decomposition offers the possibility to explore small intervals in the lower range of shear stresses. It is well suited for power laws. Linear binning has for example been applied for example by Kuhnle (1992) on the dataset leveled in Godwin Creek to analyze differences in bed load transport between rising and falling stages.
Comparison with moving averages
This is the most common and simple technique (Press et al., 1989). There are two parameters: the window size over which the average is computed; the step length between two consecutive averages. The window length correspond to the bin size in the binning technique. In the case of moving averages, the bins overlap. the overlap is set by the step length. The moving average we use here is the most simple one. It corresponds to smoothing techniques available in Matlab, Octave or Python languages for example. The window and step length correspond to a given number of measurements.
382
3.3 Results
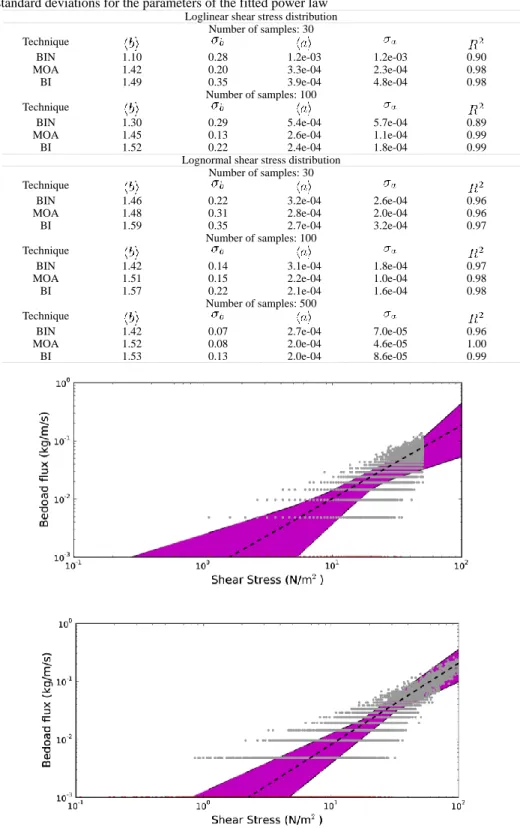
Figure 2 Bed load integral procedure: Dataset produced by the 100 simlations for a loglinear (above) and a lognormal (below) shear stress distribution. The coloured polygon gives the enveloppe of predicted values for the parameter of equation (11). Red dots show zero values plotted as 10-3 kg/m/s
In order to build a synthetic dataset we first produce N (30, 100 or 500) values of shear stress “measurements”. For each value a corresponding rate of bed load is then produced. The corresponding dataset is then averaged using either binning, moving averages of the bed load integral. Eventually a simple power law of the form
(11)
is fitted to the resulting averages. In the case of Binning and Moving averages several bin length, window sizes and step length are tested. This procedure is repeated 100 times. Average and standard deviations for the exponent are then calculated
Table 1 summarizes the results we obtain. For each technique two tests are shown on Figures 2, 3 and 4. The small points represent the total number of measurements simulated, the dashed lines the average prediction made by one given technique and the coloured polygon represents the space of all predictions, hence the variability of each technique. The bed load integral performs as well as other averaging techniques. Average values for the exponent and prefactor are often the nearest to the expected value of 1.5 for the integral technique. Furthermore the integral is not affected by the distribution of shear stresses whereas moving averages and binning techniques are. Most of all the integral does not have any adjustable parameter. The problem related to the choice of parameters for binning and moving averages will be discussed in more detail on the natural dataset of the Urumqi river.
Table 1 Simulation of bed load transport measurements (description in text). Each simulated dataset is then averaged using three techniques (BIN : Binning, BI: bed load integral, MOA: Moving averages) and the resulting averages are fitted for a powerlaw of the type . The table shows the resulting mean and standard deviations for the parameters of the fitted power law
Loglinear shear stress distribution Number of samples: 30 Technique
BIN 1.10 0.28 1.2e-03 1.2e-03 0.90
MOA 1.42 0.20 3.3e-04 2.3e-04 0.98
BI 1.49 0.35 3.9e-04 4.8e-04 0.98
Number of samples: 100 Technique
BIN 1.30 0.29 5.4e-04 5.7e-04 0.89
MOA 1.45 0.13 2.6e-04 1.1e-04 0.99
BI 1.52 0.22 2.4e-04 1.8e-04 0.99
Lognormal shear stress distribution Number of samples: 30 Technique
BIN 1.46 0.22 3.2e-04 2.6e-04 0.96
MOA 1.48 0.31 2.8e-04 2.0e-04 0.96
BI 1.59 0.35 2.7e-04 3.2e-04 0.97
Number of samples: 100 Technique
BIN 1.42 0.14 3.1e-04 1.8e-04 0.97
MOA 1.51 0.15 2.2e-04 1.0e-04 0.98
BI 1.57 0.22 2.1e-04 1.6e-04 0.98
Number of samples: 500 Technique
BIN 1.42 0.07 2.7e-04 7.0e-05 0.96
MOA 1.52 0.08 2.0e-04 4.6e-05 1.00
BI 1.53 0.13 2.0e-04 8.6e-05 0.99
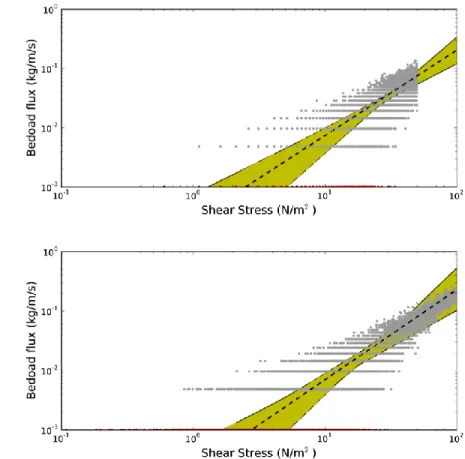
Figure 3 Binning procedure: Dataset produced by the 100 simlations for a loglinear (above) and a lognormal (below) shear stress distribution. The coloured polygon gives the enveloppe of predicted values for the parameter of equation (11). Red dots show zero values plotted as 10-3 kg/m/s
384
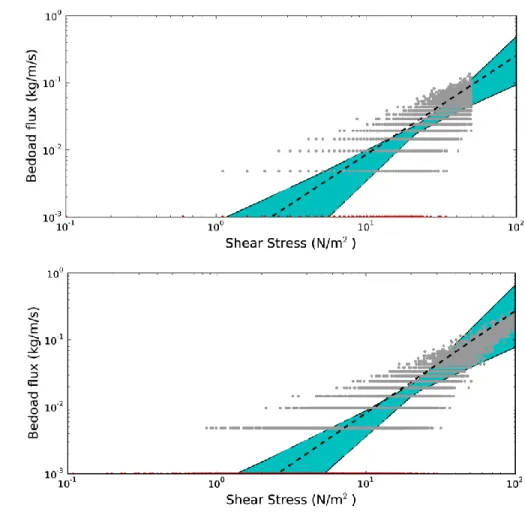
Figure 4 Moving average procedure: Dataset produced by the 100 simlations for a loglinear (above) and a lognormal (below) shear stress distribution. The coloured polygon gives the enveloppe of predicted values for the parameter of equation (11). Red dots show zero values plotted as 10-3 kg/m/s
4 APPLICATION OF THE INTEGRAL TO THE URUMQI RIVER
The dataset was acquired on the Urumqi river, a mountain stream located in the northeastern part of the Tianshan Mountain range in China (Métivier et al., 2004; Liu et al., 2008, 2010b, 2010a). The river flows from south to north and ends in a small reservoir in the Dzungar basin. The headwaters of the Urumqi originate at A.S.L. It originates from a glacier known as Glacier N 1 that flows from Tangger peak. The stream flows for before it leaves the high range and enters its alluvial Piedmont. The drainage of the Urumqi at the range front is . Hydrology is controlled by both orographic summer precipitation and glacial melting. Influence of the latter diminishes with the distance from the headwaters and accounts for about 10% of discharge at the range fronts.
4.1 Measurements performed in 2006
In 2006 two sites where sampled in the glacial valley of the Urumqi river. The sites are approximately 100 m apart. Site 1 is located at a confluence whereas site 2 is located upstream in a straight reach.
Bed load measurements were made using a hand held pressure difference sampler. The sampler’s entrance was 0.3 by 0.15 m, the expansion ratio was 1.4, and the sampler was equipped with a 0.25 mm mesh bag. Given these dimensions, our sampler should have the same properties as a Toutle river sampler (Diplas et al., 2008). These samplers were devised following discussions on the problems associated with using samplers with large pressure differences such as the Helley-Smith sampler (Hubbell, 1987; Diplas
et al., 2008). Sampling efficiency of the Toutle river sampler ranges between 80-116% (Diplas et al., 2008) so that the measurements obtained are on average likely to be good estimates of the true fluxes. Sampling duration was on average 120 s per sample. Each individual sample was weighed.
For each bed load measurement a velocity profile was made at the same location. Velocity was measured with an OTT C20 mechanical velocimeter. Each individual measurements gives the velocity averaged over 60s. Average flow velocity was then calculated for each individual profile. Shear stress acting on the bed was calculated from the average velocity, flow depth and grainsize using the technique discussed by Chang (1988), Wilcock (1996), Garcia (2008) and Ferguson (2007).
4.2 Results
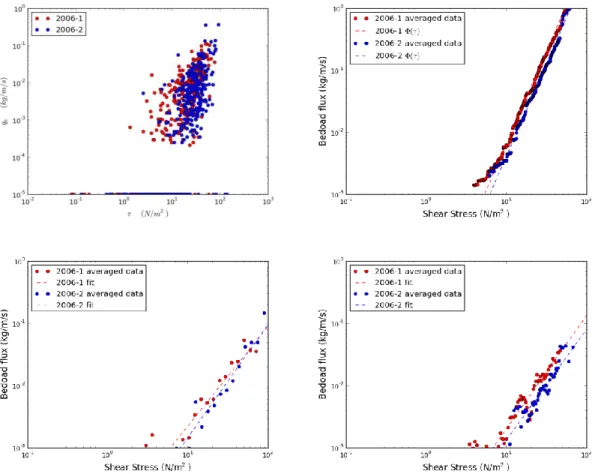
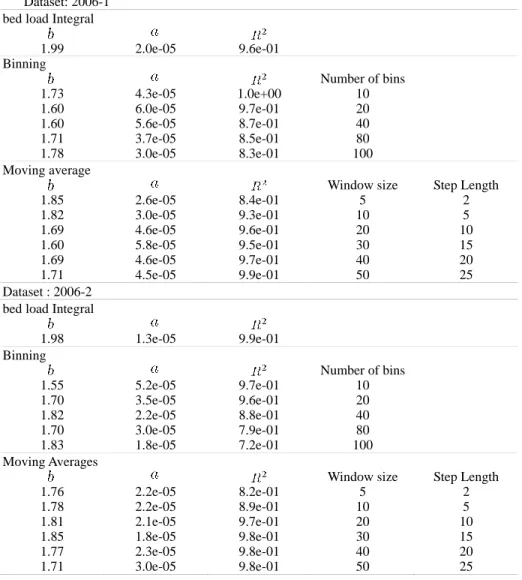
Figure 5 and Table 2 show the results of the three different averaging and fitting procedures applied to the Urumqi river dataset. Compared to the simulations the averaging procedures give results that vary more significantly between methods. It is interesting to note that the bed load integral gives almost the same results for the 2006-1 and 2006-2 dataset that were levelled almost at the same site. Other techniques give results that depend on the parametrization (number of bins or window and step length) of the averaging procedure. Furthermore for a given set of parameters the resulting averages vary from one dataset to the other. This is especially true for binning where the prefactor in equation (11) varies by a factor of 3. The exponent shows a 20% variation depending on the number of bins. Eventually both binning and moving average still show some scatter after averaging (figure 5) that leads to less constrained fits (see R values).
Figure 5 Upper left : 2006-1 and 2066-2 datasets, upper right : bed load integral, lower left binning (40 bins), lower right moving average (window size 10 points, step length 5 points)
386
Table 2 Results of the different averaging techniques applied to the urumqi river datasets: averages are fitted for a power law of the type
Dataset: 2006-1 bed load Integral
1.99 2.0e-05 9.6e-01 Binning Number of bins 1.73 4.3e-05 1.0e+00 10 1.60 6.0e-05 9.7e-01 20 1.60 5.6e-05 8.7e-01 40 1.71 3.7e-05 8.5e-01 80 1.78 3.0e-05 8.3e-01 100 Moving average
Window size Step Length
1.85 2.6e-05 8.4e-01 5 2 1.82 3.0e-05 9.3e-01 10 5 1.69 4.6e-05 9.6e-01 20 10 1.60 5.8e-05 9.5e-01 30 15 1.69 4.6e-05 9.7e-01 40 20 1.71 4.5e-05 9.9e-01 50 25 Dataset : 2006-2 bed load Integral
1.98 1.3e-05 9.9e-01 Binning Number of bins 1.55 5.2e-05 9.7e-01 10 1.70 3.5e-05 9.6e-01 20 1.82 2.2e-05 8.8e-01 40 1.70 3.0e-05 7.9e-01 80 1.83 1.8e-05 7.2e-01 100 Moving Averages
Window size Step Length
1.76 2.2e-05 8.2e-01 5 2 1.78 2.2e-05 8.9e-01 10 5 1.81 2.1e-05 9.7e-01 20 10 1.85 1.8e-05 9.8e-01 30 15 1.77 2.3e-05 9.8e-01 40 20 1.71 3.0e-05 9.8e-01 50 25 5 SUMMARY
We have described a new simple technique to average noisy datasets like bed load measurements. This technique, which we call the bed load integral, makes use of a simple Rieman sum of the fluxes as a function of shear stress to average out the noise in the signal. We tested this measure against synthetic datasets produced using Poisson distributions of bed load and a large dataset from the Urumqi River in Tianshan. The synthetic dataset shows that the integral is able to average out the stochastic component of the signal and recover the average sediment transport law. When applied to the Urumqi river the integral recovers a nice trend and the results are almost equivalent for two datasets that were leveled at the same site during the same period. We also compared the Integral to binning and moving averages. The integral performs as well as other techniques and has the real advantage that it does not necessitate the definition of arbitrary parameters to filter out the noise in the input signal.
6 ACKNOWLEDGMENTS
The research program on the Urumqi river was funded by the french Programme de Recherches Avancées (PRA-T05) and ANR-09-RISK-004/GESTRANS grant to F. Métivier, by the French ministry of foreign affairs (PhD thesis grant to Liu), National Basic Research Program of China (973 Program,
grant 2007CB411502 to B. Ye) and Distinguished scholar of the 100-Talent program of Chinese Academy of Sciences (40871036 to B. Ye). This is IPGP contribution N° 3165.
REFERENCES
Bunte, K., Abt, S., 2005. Effect of sampling time on measured gravel bed load transport rates in a coarse-bedded stream. Water Resources Research 41, –11405.
Chang, H. H., 1988. Fluvial processes in river engineering. Kreiger Publishing Company. Chung, K., 1979. Elementary probability theory with stochastic processes. Springer Verlag.
Diplas, P., Kuhnle, R., Gray, J., Glysson, D., Edwards, T., 2008. Sediment transport measurements. In: Garcia, M. H. (Ed.), Sedimentation engineering: processes, management, modeling, and practice. Vol. 110. ASCE, Ch. 5, pp. 307–353.
Ergenzinger, P., Schmidt, K., 1990. Stochastic elements of bed load transport in a step-pool mountain river. In: Sinniger, R. O., Montbaron, M. (Eds.), Hydrology in Mountainous Regions II. Vol. 194. IAHS, pp. 39–46. Ferguson, R. I., 2003. The missing dimension: effects of lateral variation on 1-d calculations of fluvial bed load
transport. Geomorphology.
Ferguson, R. I., 2007. Flow resistance equations for gravel- and boulder-bed streams. wrr.
Garcia, M. H., 2008. Sediment transport and morphodynamics. In: Garcia, M. H. (Ed.), Sedimentation engineering: processes, management, modeling, and practice. Vol. 110. ASCE, Ch. 2, pp. 21–163.
Hubbell, D. W., 1987. Bed load sampling and analysis. In: Thorne, C. R., Bathurst, J. C., Hey, R. D. (Eds.), Sediment transport in gravel bed rivers. Jonh Wiley and Sons Ltd., Chichester, pp. 89–106.
Hung, C. S., Shen, S. W., 1974. Research in stochastic models for bed-load transport. In: Proceedings Symposium on statistical hydrology. Vol. 1275 of Miscellaneous Publication. United States Department of Agriculture, pp. 262–286.
Kuhnle, R., 1992. Bed load transport during rising and falling stages on two small streams. Earth. Surf. Process. Landforms 17, 191–197.
Liu, Y., Metivier, F., Lajeunesse, E., Lancien, P., Narteau, C., Meunier, P., 2008. Measuring bed load in gravel bed mountain rivers : averaging methods and sampling strategies. Geodynamica Acta 21, 81–92.
Liu, Y., Metivier, F., Ye, B., Narteau, C., Han, T., Meunier, P., 2010a. Relationship between streambed evolution and runoff in gravel-bed streams, urumqi river. In: 2nd International Conference on Information Science and Engineering (ICISE2010).
Liu, Y., Metivier, F., Ye, B., Narteau, C., Lajeunesse, E., Han, T., 2010b. Integration of local sediment transport rating curves to derive mass budgets–the urumqi river. In: Proceedings onf the International Symposium and Hydraulic Physical Modeling and Field Investigation ISHPF2010.
Métivier, F., Meunier, P., Moreira, M., Crave, A., Chaduteau, C., Ye, B., Liu, G., 2004. Transport dynamics and morphology of a high mountain stream during the peak flow season: the ürümqi river (Chinese tian-shan). In: Second international conference on fluvial hydraulics - River flow 2004.
NIST/SEMATECH, 2009. e-handbook of statistical methods,. http://www.itl.nist.gov/div898/handbook/.
Paola, C., Morhrig, D., 1996. Paleohydraulics revisited: Paleoslope estimation in coarse-grained braided rivers. Basin Research 8, 243–254.
Pitlick, J., 1988. Variability of bed load measurement. wrr 24.
Press, W. H., Flannery, B. P., Teukolsky, S. A., Vetterling, W. T., 1989. Numerical recipes, the Art of scientific computing. Cambridge University Press.
Ryan, S. E., Porth, L. S., 1999. A field comparison of three pressure-difference bed load sampler. Geomorphology 30, 307–322.
Vericat, D., Church, M., Batalla, R., 2006. Bed load bias: Comparison of measurements obtained using two (76 and 152) helley-smith samplers in a gravel bed river. Water Resources Research 42, 01402.
Wilcock, P. R., 1996. Estimating local bed shear stress from velocity observations. Water Resources Research 32, 3361–3366.