Publisher’s version / Version de l'éditeur:
Cold Regions Science and Technology, 16, 2, pp. 145-58, 1989-02
READ THESE TERMS AND CONDITIONS CAREFULLY BEFORE USING THIS WEBSITE. https://nrc-publications.canada.ca/eng/copyright
Vous avez des questions? Nous pouvons vous aider. Pour communiquer directement avec un auteur, consultez la première page de la revue dans laquelle son article a été publié afin de trouver ses coordonnées. Si vous n’arrivez pas à les repérer, communiquez avec nous à [email protected].
Questions? Contact the NRC Publications Archive team at
[email protected]. If you wish to email the authors directly, please see the first page of the publication for their contact information.
NRC Publications Archive
Archives des publications du CNRC
This publication could be one of several versions: author’s original, accepted manuscript or the publisher’s version. / La version de cette publication peut être l’une des suivantes : la version prépublication de l’auteur, la version acceptée du manuscrit ou la version de l’éditeur.
Access and use of this website and the material on it are subject to the Terms and Conditions set forth at
Use of foil strain gauges in ice over a wide loading rate
Sinha, N. K.
https://publications-cnrc.canada.ca/fra/droits
L’accès à ce site Web et l’utilisation de son contenu sont assujettis aux conditions présentées dans le site LISEZ CES CONDITIONS ATTENTIVEMENT AVANT D’UTILISER CE SITE WEB.
NRC Publications Record / Notice d'Archives des publications de CNRC:
https://nrc-publications.canada.ca/eng/view/object/?id=2455c3e7-6dc0-4943-92bb-f3455dd0c506 https://publications-cnrc.canada.ca/fra/voir/objet/?id=2455c3e7-6dc0-4943-92bb-f3455dd0c506- - National Research Consell national Council Canada de recherches Canada
Ser
TH1
Institute for lnstitut deN21d Research in recherche en
.,
8
4
Construction constructionc . 2 BLDG
Use of Foil Strain Gauges in ice Over a
Wide Loading Rate
by N.K. Sinha
Reprinted from
Cold Regions Science and Technology Vol. 16, No. 2, February 1989
p. 145-158
(IRC Paper No. 1584)
L'auteur a Ctudit l'utilisation d'extensom&tres B feuille de dsistance adhkents universels pour la mesure des petites dCformations dans la glace pure fabriquke en laboratoire et dans la glace de mer n a m l l e de 1'Arraque. Il a mis au point une methode de montage des jauges sur la glace. Des exphences ont CtC faites, dans des conditions de chargement uniaxial, dans une large plage de vitesse de sollicitation de 1 x 10⁻³ B 1,25 x 10² MN*m-2s-1 -20 O C , et les rCponses des extensom&ucs B feuille ont Ctt compar6es ?celles d'une jauge i de dtplacement, aussi montte sur la glace. Les observations ont dvtlC qu'on pouvait se fier aux extensomtues B feuille lorsque les vitesses de sollicitation sont inferieures B 1 x 10⁻¹ XY-m-2s-1. L'anfyse du systeme hdique que la faibie adhknce B I'interfan pone-jaugc et couche de glace adhesive donne lieu une adnuation de la dponse des jauges ct limite leur ucilisacion des vltesses de chargemcn~ plus Acvies. Cenc strie d'essais a aussi permis d'obtenu pour la premi&re fois des donnCts exptnmenrales concernant la dtpcndance du modele effectif de la glace A l'tgard de la vitesse de sollicitanon pouvant aneindn 12 K 102 MNm-2s-1, soit une fr6qumcc d'cnviron I 0 0 Hz.
Cold Regions Science and Technology, 16 ( 1989) 145-1 58
Elsevier Science Publishers B.V., Amsterdam - Printed in The Netherlands
USE OF FOIL STRAIN GAUGES I N ICE OVER A WIDE LOADING RATE Nirmal K. Sinha
Geotechnical Section, Institute for Research in Construction, National Research Council, Ottawa, Ont. K 1A OR6 (Canada)
(Received April 12, 1988; accepted in revised form August 15, 1988)
ABSTRACT
The use of general purpose bonded resistance foil gauges has been examined for measuringsmall strain in both laboratory made pure ice and natural Arctic sea ice. A method for mounting thegauges on ice has been developed. Experiments were carried out under uniaxial loading conditions in a wide stress rate range of I x I O - ~ to 1.25x1O2 MN.m-2s-' at
-20" C and the responses of the foil gauges were compared with those of a displacement gauge also mounted on the ice. Observations indicated that the foil gauges can be used reliably for stress rates less than I
x
10-'
MN- m - 's-'. Analysis of the system indicates that weak bond at the interface between the gauge carrier and the adhesive layer of ice results in damped response of the gauges and limits their use at higher loading rates. This test series has also pro- vided, for thejirst time, experimental data on the de- pendence of effective modulus of ice on stress rate up to 1 . 2 ~ 1 O2 MN- m-2s-' or a frequency of about 100Hz.
INTRODUCTION
Mesoscale ice deformation studies, over a dis- tance from a hectometre to several kilometres, have been carried out primarily in the Arctic using re- mote sensing techniques involving the optical or the infrared frequencies (Hibler et al., 1973; Ono and Tanuma, 1973; Ito and Miiller, 1975; Tucker et al., 1980). Medium scale measurements over a dis- tance of 1 to 30 m have been carried out either by measuring directly the change in length between two anchors or reference planes using LVDT's or
DCDT's (Goodman et al., 1975; Allan, 1979; Chen and Lee, 1986) or by resistance wire or tape gauge techniques (Warner and Cloud, 1974; Cooper, 1975; Masterson et al., 1979). The former method, utiliz- ing LVDT's, is essentially an extension of the com- monly used method of measuring strain in the lab- oratory tests (Gold, 1958; Hawkes and Mellor, 1972; Traetteberg et al., 1975; Sinha, 1978) whereas the latter method is a larger scale application of the common resistance wire gauges. However, success- ful use of commercially available smaller size, stan- dard bonded resistance strain gauges in ice is rare. Ishida et al. ( 1972), Vaudrey ( 1973) and Cochran
( 1980) have used such gauges but it is not certain how reliable their measurements were because the gauges were installed by embedding them in ice and the problem of bonding to the ice was not addressed or evaluated by independent measurements.
To date, the most reliable but very limited evalu- ation of the response of standard bonded resistance gauges are those of Murat ( 1980, 1982). He used four-point bending tests on rectangular laths of ice and compared the surface strains indicated by the foil gauges in the central area, with those estimated from beam deflection assuming linear elastic be- haviour of the material. The tests were carried out in the limited range 0.01-0.6 MN-m-'s-' at the surface level. It was observed by Murat that for stress rates in the range of 0.1-0.6 MN-m-'s-' the re- corded strains compared favourably with the strains computed from the deflection measurements. For lower stress rates, between 0.1-0.01 MN-m-'s-', he noted a steadily increasing discrepancy between the two. The strain deduced from the load and the central deflection were as much as 15% greater than the measured strains. This discrepancy was ex-
plained by the assumption that linear elasticity was no longer valid at lower rates.
Flexural tests on beams are simple to perform but the test results are difficult to interpret if the me- chanical behaviour of the material is highly nonlin- ear such as for ice. Consequently it is not certain whether the discrepancy mentioned above was due to the invalid assumption of linear elasticity or whether there were bonding problems and the sur- face strains were not transmitted to the gauges at lower than 0.1 MN-m-2s-' rates of loading. There is a need, therefore, to conduct tests in which the deformation fields are uniform and homogeneous and the strains measured by the foil gauges are com- pared directly with those obtained through inde- pendent and reliable measuring techniques.
The test series to be described here were camed out under uniaxial loading conditions over a wide range of stress rates from 1
x
lo-' to 1 . 2 5 ~lo2
MN.m-2s-' and the outputs of the foil gauges were compared with those given by an extensometer mounted directly on the specimen. The choice of the gauge size in the present study was made by giv- ing consideration to the size of the grains, the struc- ture and texture of the ice, the strain levels to be measured and the problems of mounting the gauges on the ice specimen. A method was then developed for mounting the foil gauges on the specimen sur- face. Severe constraints, to be discussed later, were imposed on test conditions in order to avoid any damage such as formation of microcracks in the ice near the gauges that could influence the gauge re- sponse. The results indicated that the gauges can not be used at higher loading rates relevant to many en- gineering situations. Analysis of the system is made to develop an understanding of the problem.CHOICE OF GAUGE SIZE
It is imperative that the gauge length should be sufficient to cover a large number of grains. Grain size in ice varies from fractions of a millimetre to several centimetres depending on ice type. There are, however, severe limitations as to how large a gauge can be used practically. The practical limita- tions are imposed mainly by the difficulties of in-
stallation. The larger the physical size of the gauge the more difficult it is to mount it uniformly on the specimen surface, particularly when the specimen is very cold and the mounting process involves freezing a thin layer of water. Moreover, because of the cold working environment gloves must be used which imposes limitations on dexterity. It is rather difficult to handle small objects, such as thin foil gauges, with cold fingers and thick gloves.
Foil gauges with gauge lengths of 4.8 mm, 6.4 mm and 9.5 mm were tried on ice by Murat ( 1980). Be- cause of handling difficulties, though not discussed in his paper, he decided finally to use only gauges with a gauge length of 9.5 mm. As the ice used had grain sizes of 1 mm, these gauges spanned about ten grains and probably that was sufficient.
Usually, the grain sizes in natural ice are signifi- cantly larger than 1 mm. Often the grain sizes could be several centimetres in diameter. It would be dif- ficult, if not impossible, to use foil gauges to cover ten or more grains for ice with large grains. How- ever, if the material density is comparable to that of a single crystal of ice and the deformation is small and homogeneous, relatively smaller gauges than ideally required could probably serve the purpose. This possibility, in fact, is also explored here.
Foil gauges with an active gauge length of 12 mm were used in the present investigation. These are not too small to handle with gloved hands, yet not too large to give difficulties in mounting them uniformly.
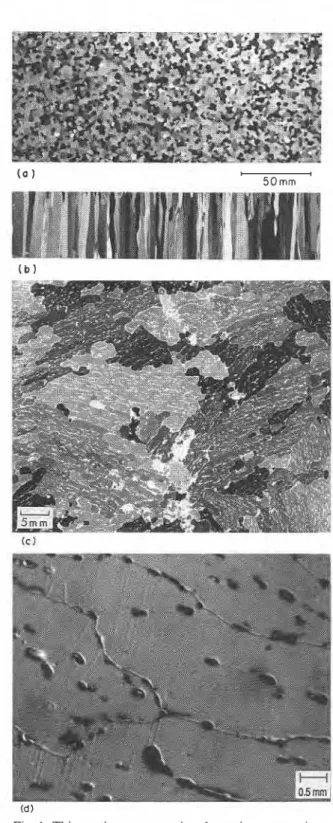
The ice used was columnar-grained. Both fresh water ice and first-year sea ice from the Arctic were used (Fig. 1 ). In the case of fresh water ice the av- erage cross-sectional grain diameter was 2-3 mm; the length of the columns was greater than 50 mm. An aspect ratio A = l / d , where
1
is the active gauge length and d is the grain size, of 4-6 was applicable for the gauges mounted on the horizontal (x, -x2) plane or the surfaces normal to the long axis of the grains (Fig. 2) or the growth direction of the origi- nal ice cover. However, the aspect ratio was less than$ for the gauges mounted on the vertical (x3
-x,
)plane or the surface parallel to the length of the col- umns, with the gauge axis also parallel to the longi- tudinal axis of the grains. A very similar aspect ra-
(d)
Fig. 1. Thin sections representing the entire test specimen,
I L83, of pure S-2 ice after completing the test series. ( a ) Hor-
izontal; (b) Vertical; (c) Horizontal thin section of oriented C first-year S-3 type, Arctic Sea ice test specimen, L82, after the test series. Microstructural details are made visible by a scat- tered-cross-polarized light technique; ( d ) Brine pockets, subgrain boundaries and small-angle tilt boundaries in de- formed first-year sea ice.
1 . 2 . 3 . 4 - F O I L G A U G E S 5 - D I S P L A C E M E N T A A U G E
0 - A N C H O R I C E
Fig. 2. Experimental arrangement for the gauges on a specimen.
tio applied for the gauges on the vertical plane for sea ice, although this is not as straightfonvard for these gauges on the horizontal plane. The sea ice used had a preferred c-axis orientation in the hori- zontal plane (Fig. 1 (c) ). This oriented fabric of the ice is indicated in Fig. 1 (c) by the orientation of the brine pockets made visible as bright inclusions, us- ing a combined scattered light-polarized light tech- nique developed by this author. Brine pockets are usually trapped at sub-grain boundaries parallel to the basal plane. Consequently the sub-grains are also oriented in the horizontal plane (Nakawo and Sinha, 1984). The values of A were, therefore, about 6 and 24 depending on the orientation of the gauges if the sub-grain size (about 0.5
x
2 mm in cross-sec- tion) is considered as the basic structure that deter-mines the deformation mechanism (Sinha, 198 1 ).
An example of sub-grain boundaries and tilt bound- aries in deformed sea ice is illustrated in Fig. 1 (d); the details are revealed by thermal etching follow- ing microtoming.
In this study, all the tests were carried out at
-
20" C in order to avoid complications due to the presence of liquid (brine) inclusions in the sea ice.PROCEDURES FOR MOUNTING THE GAUGES
Two types of commercially available foil gauges were used. No differences were noted in their re- sponse. Both were integral lead type with a constan- tan alloy grid and an active gauge length of 12 mm. These gauges were readily available Micro Mea- surement Inc. gauges with model numbers of CEA- 06-500UW-350 (completely encapsulated in a flex- ible polyimide coating) and EA-06-500BL-350 (open faced with only a polyimide backing). In both cases the lead wires were cleaned and carefully sol- dered onto the tabs. The active gauge portions of the open faced gauges were waterproofed by coating first with a thin layer of Dow Coming 3 140 RTV followed by a thin layer of Micro Measurements ni- trile rubber coating, model M. The open ends of the lead wires and the tabs were also waterproofed for both types of gauges by the two layer technique. En- capsulated gauges, however, were preferred because they required less preparation than the open faced gauges.
Several methods were tried inside a cold room for mounting the strain gauges on the specimen sur- faces. The simplest and yet satisfactory method may be described as follows. After selecting the desired location and positioning the gauges, about 10 mm of the lead wires were frozen to the specimen (Fig. 2) at a distance of about 50 mm from the active portion, using an eye dropper and two or three drops of water from a container maintained at about 0" C. These frozen leads acted as the anchors and isolated the gauges and'the joints from any pulling action of the lead wires during further handling. Moreover, this procedure also isolated the gauges from any vi- brational strain induced by the lead wires, which were often observed to vibrate during the experi- ment when the load was applied suddenly for the rapid tests or due to the air circulation inside the cold room during the slow tests. With the lead wires secured solidly at the anchor, the gauge was lifted slightly and two drops of cold water were applied to the area where the gauge was to be mounted. The gauge was then quickly and accurately pressed into place using a flat rubber pad and held until freezing of the water was complete. The pad was then re- moved. The ice was prevented from freezing on the
pad by covering the surface of the pad with a thin layer of clear plastic. After inspection for overall freezing and flatness, a thin layer ofwater was placed over the gauge and a small portion of the lead wires for protection against sublimation. Needless to say, a great deal of practice was required before the gauges could be properly mounted. The common problem was the partial freezing and wrinkling of the gauges. It should be mentioned here that the use of water at about freezing point was found neces- sary to avoid thermal stress induced microcracking activities on the specimen surface. Examination under a microscope revealed that even one drop of water at 20°C (usual warm room temperature)
damages the ice surface at - 20°C.
Tests were camed out on prismatic samples with
final dimensions of 50
x
100x
250 mm for fresh-water ice and of 100 X 100
x
250 mm for sea ice.Their long dimensions were normal to the length of the columnar grains. The specimens were machined with a milling machine and a lathe inside a cold
room at - 15 "C. Cutter marks on the surfaces were
removed with fine sandpaper on flat granite block. Final finish was given by wiping with a tissue slightly moistened with alcohol. The samples were then stored in individual bags until they were tested within a few days. They were stored in another cold room that houses the test system. This cold room
was maintained at
-
20+
0.1 " C.Four foil gauges were mounted on the specimen
at
-
20" C as shown in Fig. 2. These provided inde-pendent measurements of both axial and lateral strains on two surfaces, one parallel to the length of the columnar grains and the other normal to it. These gauges were excited by a commercial signal conditioner and the gauge outputs were amplified before recording. An excitation voltage of 7 volts, for the 350-ohm strain gauges, was found satisfac- tory without showing any adverse effect due to heating. At this setting, no drift in the output signal was noted and no local temperature difference on the surface could be detected by a pointed thermis- tor probe capable of measuring temperature with an accuracy of 0.01 "C. It should be pointed out here that the cold room temperature is maintained by a forced air circulation system which also helps in the removal of heat generated by the gauges. In fact, the room is rather breezy.
Axial strain was also determined independently by a 200 mm gauge-length commercial (MTS) ex- tensometer (No. 5 in Fig. 2) attached directly to the central area of one 100x250 mm face of the specimen. Two metal strips ( 1
x
4x
30 mm) with a groove in the middle of the 4x
30 mm faces and fro- zen near the top and bottom of the specimen were used to seat the knife edges of the displacement gauge. A detailed description of this mounting sys- "tem and the evaluation of the response of this ex- tensometer by means of other independent systems is given in Sinha ( 1986).
I
TEST METHODSA commercial closed-loop, servohydraulic test machine (MTS) with a design load capacity of 1 MN for the frame, situated inside the cold room near an observation window, was used. The con- trols, pumps and recording systems were kept out- side the cold room. The loading train consisted of two 152 mm diameter compression platens (one at the top and one at the bottom of the specimen), a spherical seat and a 250 kN capacity load cell and a 250 kN capacity actuator. The lower platen was specially designed with a liquid circulation system to maintain it at the cold room air temperature and thereby isolate it from any warming effect of the ac- tuator. Compressive loads were applied parallel to the long axis of the specimens and hence normal to the length of the columnar grain (see Fig. 2 )
.
Axial load rate and hence stress rate was maintained con- stant during a test by the feedback system. Tests were conducted over a wide range of stress rates from 1 X 10⁻³MN.m-2s-1 to 1 . 2 5 ~ 102MN-m-2s-1.It was decided to keep the peak stress a,, well be- low cracking level to avoid any effects due to the cracks and thereby maintain the stress and strain field homogeneous. Earlier experiments (Sinha, 1982) carried out on columnar-grained fresh water ice showed that microcracks about the size of the grain facets form when the stress exceeds about 1.2 MN.m-2 for stress rate of 1
x
l o p 3 MN.m-2s-1. This threshold stress level increased to about 2.0 MN.m-2 when the stress rate increased to 1x
MN-m-2s-1. A similar rate effect in the threshold stress for microcracking was also noticed in 0.5-1.5% salinity, multi-year columnar-grained sea ice (Sinha, 1985). The threshold stress in sea ice was found however, to be about half of that in fresh water ice. The system was, therefore, programmed to ap- ply the load up to an equivalent stress level of about 0.75 MN.m-2 and to unload rapidly to zero stress. For sea ice, a,, was kept at 0.5 MN.m-2 for b,
<
1x
l o p 2 MN.m-2s-1 in order to be consistent with the previous acoustic emission study (Sinha, 1985). To avoid specimen-to-specimen variation, it was planned to do as many tests as possible on the same specimen. A long recuperation time was given after each test, during which the specimen strains were monitored in order to be certain that the specimen had returned to an equilibrium state before loading again. Stress rates were chosen randomly to avoid any effect due to microstructural change that could occur during the tests and systematically influence the results. An accident did occur during handling when, after several tests, the first fresh water test specimen (designated as L81) broke into small pieces when it slipped and dropped on the floor. A second fresh water ice specimen (L83) was then used. Tests were terminated on this specimen after several days of testing when two foil gauges came off the specimen during storage over a weekend, primarily due to the sublimation process. This spec- imen showed no cracks after all the tests. Micro- structural examination of this specimen was then made and in fact is illustrated in Fig. 1 (a). Tests on the sea ice specimen (L82) were terminated when it was damaged at one corner during handling. Mi- crostructure of this specimen is shown in Fig. l (c). For the chosen maximum stress level of 0.75 MN-m-2, the total loading time is 0.0075 s at the intended maximum stress rate of about 1 X lo2 MN-m-2s-1. In order to record a reasonably con- tinuous history of loading, there should at least be 100 data points during the loading phase. This means that data should be collected at a rate of 1 . 3 ~ lo4 s-'. A six channel transient recorder ca- pable of recording all the channels simultaneously up to 2x
lo6 s-' proved ideal. It was imperative that the axial load and the deformation of essentially the entire specimen given by the 200 mm long MTS displacement gauge (Fig. 2) mounted directly on the specimen be recorded. This allowed only fourchannels to be used for other measurements. All the electronic equipment was kept outside the cold room.
RESULTS
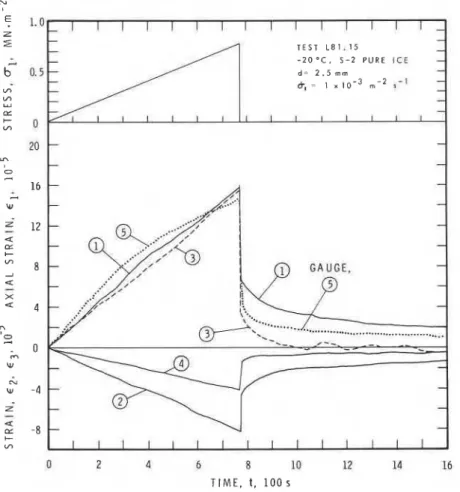
Examples of experimental observations are illus- trated in Figs. 3-5. It may be seen that the test sys- tem maintained the programmed stress rates (nom- inal rate, b,,) for low to moderately high load rates. The variance in the actual load rate, during the be- ginning and end of a cycle, was evident at high stress rates. A summary of observations on the stress rate is given in Fig. 6 in which
iT,
represents the average rate to the peak load (=a,,/t,) where t, is the rise time. Clearly the system was not capable of impos-ing a constant stress rate at about q,>20
MN-m-'s-'. However, these were rather rapid tests and involved t,
<
49 ms.Irrespective of the type of ice, the foil gauges re- sponded well at low rates of loading, as can be seen in the measured axial strains in Figs. 3 (a), 4(a) and 5 (a). The outputs from the foil gauges ( 1,3 ) com- pared well with those given by the displacement gauge ( 5 )
.
Consideration should be given to the fact that the strain levels were extremely small, there- fore measurement errors become significant. Even slight imperfections of the surface, such as grain- boundary grooves developed on the specimen due to sublimation, would significantly affect the sur- face strains. Moreover, it was also impossible to eliminate completely any bending moment. Al- though the effect of bending on surface strains could have been examined and probably eliminated by using gauges on opposite faces of the specimen, itI I I l 1 1 1 1 _
-
T E S T L 8 1 . 1 5-
--
- 2 0 ° C , S - 2 P U R E I C E d d = 2 . 5 m m-
k,= 1 x ~ o - 3 m - 2 7 - '-
-
-
- I I I l l 1 1 1-
-
-
-
-
-
-
-
-
-
-
-
-
-
-
-
I t I 1 I I I I I I I I I I I 0 2 4 6 8 10 12 14 16 TIME, t , 100s10
,
, , ,
,
,
, ,
, ,
, ,
,
,
T E S T LEl.7, PURE I - ? I C E-
m - 2 D D C , 4 = 4 8 . 7 M N - n - ? 1-' 'n 8-
d = 2 . 5 m m I & 0 1 2 3 4 5 6 7 TIME, t, 10 -2 SFig. 3 ( b ) . Stress and strain histories for a high rate of loading
using test specimen, L8 1, of pure ice.
was not possible to do that in this test series because of the restricted number of channels available for recording purposes and because of the intended purpose of making observations over a wide load- ing rate without changing the measurement system. An alternative method would have been to attach gauges to all four sides of the specimen, connect them in series, and excite with a constant current source. This would provide the average strain on all sides. This method, suitable for isotropic and linear elastic or linear viscoelastic materials, could not be applied in this case because of the anisotropic na- ture of the ice used. Moreover, this method would not readily allow detection of problems, particu- larly the response of individual gauges during the entire test series. Another choice would have been to average the outputs of gauges mounted on oppo- site faces and connected in series. This, however, would have failed to give a measure of the degree of bending, if any, which could have added complica- tions to transverse strain because of the nonlinear-
ity of mechanical response of ice. It should be men- tioned here that this project had two primary goals. One objective was to evaluate the response of foil gauges (the subject of this paper), and another ob- jective was to measure the effective Poisson (or strain) ratio from the outputs of each pair of gauges in order to examine the anisotropic and non-linear strain response of ice (Sinha, 1988 ).
Reliability of the foil gauges is judged in the fol- lowing paragraph by comparing their response with that of the displacement gauge. Much of this com- parison therefore hinges on the question: how reli- able is the displacement gauge? This is a commer- cially available system marketed by MTS and has been used extensively by many investigators on many different materials. As for its use on ice, this gauge was evaluated in an earlier experiment at moderate rates of loading (Sinha, 1986). Further discussion to clarify the response at higher rates is included in the following section.
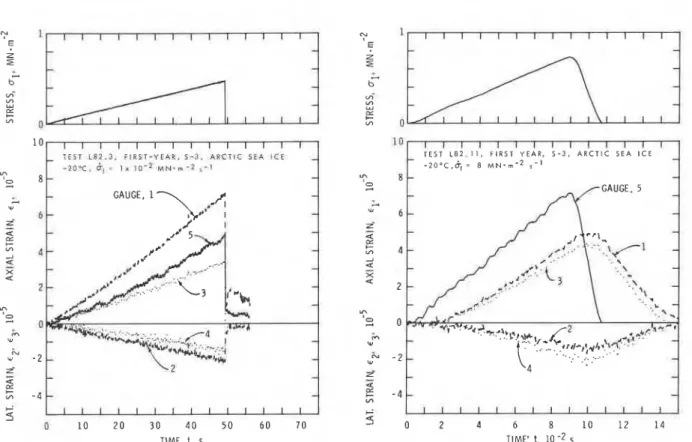
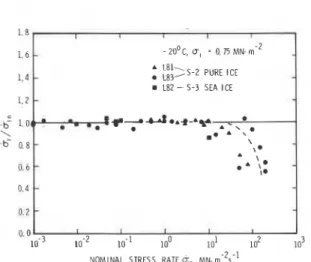
With an increase in loading rate the response of the foil gauges ( 1,3 ) exhibited increasing devia- tions in comparison to that of the displacement gauge ( 5 ) as can be seen in Figs. 3 (b), 4(b) and 5 (b). Foil gauges recorded decreasing strains with increasing loading rate. They also exhibited in- creasingly delayed response with increase in stress rate. The output from the displacement gauge was noted to be in phase with that from the load cell at all stress rates but the corresponding peak response in the foil gauges occurred after a significant lapse of time. Note that this delayed response occurred also in the case of gauges mounted to record the lat- eral strains. Thus foil gauge response was signifi- cantly damped at high rates. This damping effect was so great at high rates that the time required to peak strain (the rise time) for foil gauges, t,(foil), was more than three times longer at 100 MN.m-2s-1 than the corresponding rise time, t,(disp) for the strain given by the displacement gauge. The response characteristics of the foil gauge in relation to that of the displacement gauge are summarized in Fig. 7. In spite of a large scatter (up to about
+
20%) in the peak magnitude of the foil gauge axial strain normalized with that given by the displacement gauge, the results show a systematic rate effect. It may be seen that the foil gauges begin to underestimate the strain at a significantly lower2
I) 1 0 2 0 3 0 4 0 5 0 6 0 70 TIME t, S I T I I I T I I I I , l I , T E S T L 8 2 . 1 1 , F I R S T Y E A R , 5 - 3 , A R C T I C S E A I C E - 2 0 e C , 4 = 8 M N . m - 2 s - I 0 2 4 6 8 1 0 12 14 TIME' t. sFig.4. (a, left) Stress and strain histories for a low, constant stress rate, loading test using specimen, L82, of first-year sea ice; (b,
right) Stress and strain histories for a high rate of loading using test specimen, L82, of first-year sea ice.
N T E S T L 8 3 . 1 b- v; VI w v; ai C C TIME, t, S TIME. t. S
Fig. 5. (a, left) Stress and strain histories for a low, constant stress rate, loading test using specimen, L83, of pure ice; (b, right) Stress and strain histories for a high rate of loading using test specimen, L83, of pure ice.
1 . 8 1 I 1 , 6 - - 20' C. c, = 0.75 M N rn-'
:
:ii>S-2 PURE ICE 1.4-
L82 - 5-3 SEA ICE 1.2-
p - d * . * - ~ , . .. * . b - l . n " = 0--..I.
'l . A A ' \ o - b 0.8-
\ \ A \ I- 0 . 6 +-
Fig. 6 . Dependence of measured stress rate on nominal stress rate.
rate than the onset of their delayed response. The salient features are: (a) the foil gauges are good strain indicators only for 15~0.1 MN-m-*s-', (b) the delayed response in the foil gauges occurs at a, 2 3 MN-m-2s-1.
Fig. 7. Stress rate
The observation (a) above provides direct con- firmation of Murat's ( 1980) conclusion, presented earlier in the introduction, that the foil gauges could give acceptable measures of deformation in the lim- ited stress rate range of 0.1 to 0.6 MN.m-2s-1. This range, however, appears to be just outside the range of reliability (Fig. 7 ) . On the other hand, the pres- ent observations furnish evidence that Murat's foil gauge strain data in the range 0.0 1-0.1 MN-m-2s-
',
which he could not confirm, were probably correct. Thus his assumption on the invalidity of linear elas- ticity in the estimation of surface deformation from central deflection in flexure for the rates of loading in this range is justified.DISCUSSION
Although the peak rate of loading was rather high at the high end, the shortest rise time to peak load, t,, was about 6 ms or the highest approximate fre- quency of loading,
f=
1/(2t,), was about 80 Hz,-
a 4 - - 2 0 ° c • 01-
W,.-
D-
A L 8 1 ~ ~ - 2 , L83' P U R E I C Ed
L 3 --
-
¤ L 8 2 - 5 - 3 , S E A I C E / 4-
-
/-
' 2-
-
-
-
*d'.
L /L-
1=
-&+&&A I '0 4 0 I I I I A I 0 L 2 0-
-
-
at, = t , ( f o i l ) - t , ( d i s p ) , 1 0 - ~ s # A A- aI
#he A O h ==
-L -!:=--'-;.
A I I 0 I I I I 0 \1
l o - 3 l o - = 1 0 - I 1 o0 l o 1 1 o2 1 o3 - 2 - 1 S T R E S S R A T E , d; , MN. m swhich is well within the capacity of both the load cell and the extensometer. Both of these trans- ducers after all, are based on strain gauge technol- ogy and a typical rise time for a bonded gauge mounted on steel is about 0.7 ps including the transit time for typical carrier and adhesive combinations and the time required for the conductor to respond (Dally and Riley, 1978). The transit time for a compression wave to travel through the 250 mm ice specimen is 0.8 ps assuming a wave velocity in ice of 3000 m/s (Ewing et al., 1934) for the load cell situated at the opposite end of the actuator. The travel time applicable for the displacement gauge, however, would be 0.7 ps plus the sum of the transit time through the 200 mm segment of the ice speci- men (about 0.7ps) and through the mounting sys- tem consisting of the bonding ice, the metal strips and the knife edges. The mounting system ob- viously did not affect the response of the extensom- eter (at least in measurable terms) because output from both the extensometer and the load cell were in phase at all rates. As for the frequencies in- volved, it is apparent that both the load cell and the extensometer were well suited for the present tests.
An alternative, though somewhat indirect ap- proach of examining the response characteristics of the extensometer would be to estimate the effective modulus or the secant modulus for the peak load:
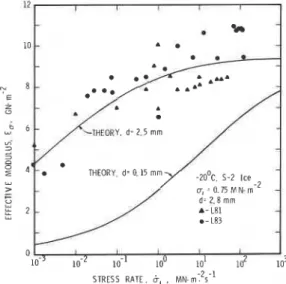
where the peak strain e l is indicated by the displace- ment gauge. The rate dependence of measured val- ues of E,, estimated in this way and shown in Fig. 8, bears close resemblance to previously reported experimental observations on the dependence of measured values of E, on stress rate (Sinha, 198 1 )
and on strain rate (Traetteberg et al., 1975); how- ever, previous observations were made for stress rates below about 1.0 MN.m-2s-1. The close nu- merical agreement with the previous measurements is a fair indication that the extensometer worked well during the present test series.
For uniaxial loading at constant axial stress rate,
r?,, it was shown by Sinha (1983) that the axial strain in a polycrystalline material like ice for con- ditions of no microcracking is given in terms of the
following three strain components at time t, after initiation of loading:
where a, =
6,
t = N A a, = Nbl At; N is the number of equal steps chosen to divide the stress path for the numerical integration method used in the above formulation. Equation (2) is a special case of a gen- eral equation developed for monotonically increas- ing loading history (Sinha, 1983). In this equation,E is Young's modulus and d is the grain size; i,, is the viscous strain rate for unit or reference stress 00;
c, is a constant corresponding to the unit or refer- ence grain size, dl; b,n, are constants; a, is the in- verse relaxation time. Both i,, and a, vary with temperature, T, in Kelvin and were shown (Sinha, 1978) to have the same value for activation energy, as follows:
where TI and T2 are temperatures and F , , is a shift function given by:
THEORY d= 0.15 rnrn-/.7r
I'C. 5 - 2 Ice .
1
STRESS RATE, 6,
.
~ ~ . r n : ' s - lin which Q and R are activation energy and gas con- stants respectively. It has been shown experimen-
.
tally that Q does not change for ice in the tempera-.
turerange-5to-45OC(Sinha,1979,1983)forconditions of no cracking. Cracking activity, how-
-
ever, affects the value of the apparent creep activa-tion energy (Sinha, 1984).
The units of measurements are now made in SI
system, oo= 1 MN-m-2, dl = lm and t= 1 s. Exper-
iments on ice (Sinha, 1978) have indicated that
b z 1 / n and n = 3. Introduction of this information in eqn. (2) gives a simpler formula for ice:
o C N + l
E ,
1
Ao, [ 1 -exp{- (a,[NE Edi=I
As E can be estimated fairly accurately from
available single-crystal behaviour, the unknown material constants for polycrystalline pure ice re- duce to four: c, , a,, i,, and Q.
Calculations on the basis of eqn. (5) and relevant to the present tests were made (Fig. 9) using the value of the constants given in Sinha (1979): E=
9.5 GN.m-2, c, = 9 x a, (T=263K) = 2 . 5 x
10-4s-1, iUo(T=263K) = 1 . 8 ~ 10-'s-', Q=
67 kJ mol-' and R=8.32 J mol-I K-'.
Note how little is the viscous or the permanent deformation in Fig. 9 even at the slowest tests. It should perhaps be mentioned here that the perma- nent strain can be readily calculated from the 3rd
term in eqn. (5 ). Direct experimental verification
of negligible permanent strain can be seen in the re- covery portions of Figs. 3-5.
Comparison of the calculated total strain, at peak load, with the experimental observations are made in Fig. 8 by estimating E,. Fair agreement between theory and experiments provide indications of the validity of the theory and the reliability of the ex- tensometer data.
Figure 8 also shows calculations made for a fine-
grained ice with a grain size of 0.15 mm. These cal- culations are relevant to the ice when a drop of water slightly above 0°C is brought in contact with a ma-
chined surface of a clear block of ice at
-
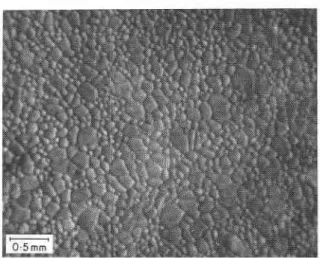
20°C aswas done during the freezing of the foil gauges. Rapid solidification occurs leading to fine grains. A micrograph of such bonding ice is shown in Fig. 10. The average grain diameter in this ice was found to be 0.15 mm which is significantly smaller than those
in the specimens used for testing (Fig. 1 ).
18 - -20'~. G R A I N SIZE = 2.5 m m ' a, = 0.75 MN . m-'
d I I . A
10-I lo0 lo1 lo2 lo3
STRESS RATE. 6, , ~N.m-~s-l
Fig. 9. Peak strain and the elastic, delayed elastic and viscous components.
Fig. 10. Texture of bond ice with an average grain diameter of 0.15 mm revealed by microtoming and thermal etching.
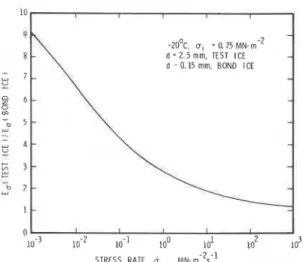
Fig. 1 1. Effective modulus of test ice normalised with that of bond ice and its rate sensitivity.
It can be seen, in Fig. 8, that the theoretical effec- tive modulus and hence the stiffness of the bonding
ice ( d = 0.15 mm ) is significantly lower than that of
the experimental ice (d= 2.5 mm). The modulus of the experimental pure ice is about 8 times greater than that of the bonding ice at the lowest rate tested here (Fig. 1 1 ). This ratio is 4.4 at 0.1 MN-m-2s-', above which the foil gauges exhibited a trend of phase lag. There is similarity between the stress rate dependence of E,(ice) /E, (bond ice) shown in Fig.
11 and the corresponding rate sensitivity of 6, (foil) 1 6 , (disp) shown in Fig. 7. This similarity could raise the question whether the observed in- creasingly damped response of the foil gauges with increased loading rate could be related, in an indi- rect manner, to the increasing relative stiffness of the ice used as the adhesive between the specimen and the carrier or the backing of the gauges. The ef- fective modulus of the adhesive ice is 0.5 GN.m-2 at 1 X MN-m-*s-' whereas its value is 6.5 GN.m-2 at 100 MN.m-2s-' (Fig. 8). Thus the stiffness of this layer increased by a factor of about 13 over the stress rates investigated. In comparison to this, the modulus of the strain gauge backing ma- terial most probably did not change at all because of the low temperature of the experiment. An in- crease in the modulus of the adhesive ice layer should, in fact, improve the strain transmittal qual- ities of the system (Stein, 1962) assuming, of course, excellent bond between the backing layer and
the grid, between the backing and the bonding ice, and between the specimen surface and the ice bond- ing layer. Poor strain transmittal qualities can not, therefore, be explained on the basis of the above arguments.
Although the bond between the specimen surface and its adhesive layer, both being ice, is expected to be good, the bond between the backing and this layer of ice could be very poor because of the differences in the materials. The poor bond was evident from the fact that the gauges could be peeled off easily from the specimen by pulling the connection wires even in equilibrium thermal state, that is, without any electrical input through the gauges that could affect the local thermal regime. Moreover, as men- tioned earlier, local heating effect, if any, was less than the error of measurement. There is a possibil- ity therefore, that the surface strain would be trans- ferred well to the adhesive layer at all the rates in- vestigated but the degree of transfer from the adhesive layer to the backing, and hence the grid wires, could depend on the rate of loading. Support for the first possibility comes from the fact that the displacement gauge did not show any rate effect in spite of the fact that a similar adhesive layer was used to bond the seat of its knife edges. These seats could not be removed from the specimen as easily as the'foil gauges could be removed.
The present problem, therefore, must be related to the interface between the adhesive layer of ice and the gauge backing. It is highly possible that the wetting was poor and the molecular bond between ice and the plastic was very weak. More work is needed to obtain a satisfactory explanation of the problem and thereby expand the range of useful ap- plication of the foil gauges.
CONCLUSIONS
General purpose foil strain gauges bonded to a flexible carrier can be mounted reasonably well on both fresh water ice and first-year sea ice, using water at about 0°C. This 'glue' acts as the adhesive layer, on freezing, between the gauges and the spec- imen surface. For small strains, less than 0.02%, these gauges provide a means for making accepta- ble measurements of strain if the rate of loading is
less than 0.1 MN.m-2s-'. With increasing loading rates, foil gauges exhibit increasingly damped re- sponse; the output decreases and the phase lag in- creases. At a stress rate of 100 MN m-2s-' foil gauges give only about 15% of the actual strain and the rise time to the peak strain is 3 times longer than the actual loading time. The inadequacy of the bond between the adhesive layer and the carrier is thought to be the factor that limits the performance of these gauges for dynamic applications in ice. Future stud- ies should concentrate on the problems of transport mechanism of ice surface strain to the strain in the grid system of the foil gauges if this type of gauge is to be used at high rates of loading.
ACKNOWLEDGEMENTS
The author is indebted to R. Jerome for his assis- tance in all phases of this work. This is a contribu- tion from the Institute for Research in Construc- tion, National Research Council of Canada.
REFERENCES
Allan, A.J. ( 1979 )
.
Surface strain of artificially thickened ice drilling platforms. Proc. Workshop on the Bearing Capac- ity of Ice Covers, 16-17 Oct. 1978, Winnipeg, Canada, Snow and Ice Subcommittee, Assoc. Comm. of Geotech. Res., National Research Council of Canada, Technical Memorandum No. 123, pp. 14-23.Chen, A.C.T. and Lee, J. ( 1986). Large-scale ice strength tests at slow strain rates. Proc. 5th Int. Symp. Offshore Me- chanics and Arctic Engineering, Tokyo, Japan, 4: 14-23. Cochran, G.V.B. ( 1980 ). Field techniques for experimental
stress analysis in Arctic sea ice. J. Glaciol., 25 (91 ): 175- 182.
Cooper, P.F. Jr. (1975). Movement and deformation of the landfast ice of the southern Beaufort Sea. Beaufort Sea Tech. Rep. 37, Beaufort Sea Project (December 1975). Dally, J.W. and Riley, W.F. (1978). Experimental Stress
Analysis. McGraw-Hill, New York (Chapter 6) p. 153. Ewing, M., Crary, A.P. and Thorne, A.M. (1934). Propaga-
tion of elastic waves in ice, Part 1. Physics, 5 (6): 165- 168.
Gold, L.W. ( 1958). Some observations on the deuendence of strain on stress for ice. Can. J. Physics, 36(10): 1265- 1276.
Goodman, D.J., Allan, A.J. and Bilham, R.G. ( 1975 ). Wire strainmeters on ice. Nature, 255 (5503): 45-46.
Hawkes, I. and Mellor, M. ( 1972). Deformation and fracture
of ice under uniaxial stress. J. Glaciol., 1 1 (6 1 ): 103-1 3 1. Hibler, W.D. 111, Weeks, W.F., Ackley, S., Kovacs, A. and Campbell, W.J. ( 1973 ). Mesoscale strain measurements of the Beaufort Sea pack ice (AIDJEX 197 1 ). J. Glaciol., 12(65): 187-206.
Ishida, T., Tabata, T., Suzuki, Y., Ono, N. and Fujino, K. (1972). Preliminary tests of stress and strain measure- ment within ice sheet. In: Sea Ice, Proc. Int. Conf., Nat. Res. Council, Reykjavik, pp. 174-1 75.
Ito, H. and Miiller, F. (1975). Measurement of sea ice force by strain rosette in the north water area. Proc. 3rd Conf. on Port and Ocean Engineering Under Arctic Conditions, Fairbanks, Alaska, 1: 269-284.
Masterson, D.M., Anderson, K.G. and Strandberg, A.G. (1979). Results of strain measurements in floating ice platforms using a 3m-long resistance wire gauge. Proc. Workshop on the Bearing Capacity of Ice Covers, 16-17 October, 1978, Nat. Res. Council of Canada, Tech. Mem- orandum No. 123, pp. 25-38.
Murat, J.R. and Lainey, L.M. (1982). Some experimental observations on the Poisson's ratio of sea ice. Cold Re- gions Science and Technology, 6: 105-1 13.
Murat, J.R. ( 1980). Small scale surface strain measurement on sea ice. Proc. Workshop on Sea Ice Field Measure- ment. St. John's, Centre for Cold Ocean Resources Engi- neering, Memorial University of Newfoundland, Pub. No. 80-21: 55-74.
Nakawo, M. and Sinha, N.K. (1984). A note of brine layer spacing of first-year sea ice. Atmosphere-Ocean, 22(2): 193-206.
Ono, N. and Tanuma, K. (1973). Strain measurements of pack ice floe with infra-red distancer. Low Temperature Sci., Ser., A31: 229.
Sinha, N.K. ( 1982). Acoustic emission and microcracking in ice. Proc. 1982 Soc. Exp. Stress Analysis, Japan Soc. of Mech. Eng., Honolulu/Maui, Hawaii, Part 2: 767-772. Sinha, N.K. ( 1985). Acoustic emission study on multi-year
sea ice in an Arctic field laboratory. J. Acoustic Emission, 4(2/3): 1265-1276.
Sinha, N.K. ( 1981 ). Constant stress rate deformation mod- ulus of ice. Proc. 6th Int. Conf. on Port and Ocean Engi- neering under Arctic Conditions, Quebec City, Canada, 1: 2 16-224.
Sinha, M.K. ( 1983). Creep model of ice for monotonically increasing stress. Cold Regions Science and Technology, 8(1): 25-33.
Sinha, N.K. ( 1987). Effective Poisson's ratio of isotropic ice. Proc. 6th Int. Symp. on Offshore Mechanics and Arctic Engineering (OMAEIASME), Houston, Texas, USA, 4: 189-195.
Sinha, N.K. (1979). Grain-boundary sliding in polycrystal- line materials. Philos. Mag. A, 40(6): 825-842.
Sinha, N.K. ( 1978 ). Rheology of columnar-grained ice. Ex- perimental Mechanics, 18 ( 12): 464-470.
Sinha, N.K. (1984). Intercrystalline cracking, grain-bound- ary sliding, and delayed elasticity at high temperatures. J. Materials Sci., 19(2): 359-376.
Sinha, N.K. ( 1986). Young Arctic frazil sea ice: field and lab- oratory strength tests. J. Materials Sci., 21 (5): 1533-1546. Sinha, N.K. ( 1988). Experiments on anisotropic and rate-
sensitive strain ratio and modulus of columnar-grained ice. Proc. 7th International Conference on Offshore Mechan- ics and Arctic Engineering (OMAEIASME), Houston, Texas, USA, 4:55-62 (also in press: J. OMAE).
Stein, P.K. ( 1962). Adhesives: How they determine and limit strain gauge performance. In: Semiconductor and Con- ventional Strain Gauges. M. Dean (Ed.), Academic Press, New York, pp. 45-7 1.
Traetteberg, A., Gold, L.W. and Frederking, R.M.W. ( 1975 ). The strain rate and temperature dependence of Youngs
I
modulus of ice. Proc. 3rd Int. Symp. on Ice Problems, Int. Assoc. of Hydraulic Res., Hanover, N.H., USA, pp. 479- 486.
Tucker, W.B., Weeks, W.F., Kovacs, A. and Gow, A.J. ( 1980). Nearshore ice motion at Prudhoe Bay, Alaska. In: Sea Ice Processes and Models, R.S. Pritchard (Ed.), University of Washington Press, Seattle, USA, pp. 261-272. Vaudrey, K.D. ( 1973). Development of a sea ice strain trans-
ducer. Tech. Note N-1310, Naval Civil Engineering Lab- oratory, Port Hueneme, California, 29 pp.
Warner, G. and Cloud, G. ( 1974). Measurement of surface strain rates in glaciers using embedded wire strain gauges. Exp. Mech., 14: 24-29.
This paper is being distributed in reprint form by the Institute for Research in Construction. A list of building practice and research publications available from the Institute may be obtained by writing to the Publications Section, Institute for Research in Construction, National Research Council of Canada, Ottawa, Ontario, KIA 0R6.
Ce document est disuibu6 sous forme de tir6-&-part par 1'Institut de recherche en construction. On peut obtenir une liste des publications de 1'Institut portant sur les techniques ou les recherches en matibre de bitiment en Ccrivant B la Section des publications, Institut de recherche en construction. Conseil national de recherches du Canada, Ottawa (Ontario), KIA 0R6.