CARBON DEPOSITION IN A BOSCH PROCESS USING A COBALT AND NICKEL CATALYST
by
James Edwin Garmirian B.A., Hope College (1976)
SUBMITTED IN PARTIAL FULFILLMENT OF THE REQUIREMENTS FOR THE DEGREE OF DOCTOR
OF PHILOSOPHY
at the
MASSACHUSETTS INSTITUTE OF TECHNOLOGY March 1980
Massachusetts Institute of Technology 1980
Signature of Author:
Department of CheyXlca-l Engineering Certified by:
Thesis Supervisor Certified by:
Accepted by:
Thesis Supervisor
7)
Chairman, Departmental Committee on Graduate Theses
ARCHIVES
MASSACHJ 3T i•JUN
i
3
1980
2
Abstract
NASA has been active in developing processes to recover oxygen from meta-bolic carbon dioxide. Their ultimate objective has been to construct a life support system capable of supplying oxygen in a cyclic process. The cycle of
interest here begins by reducing the carbon dioxide with hydrogen to form solid carbon and is known as the Bosch process. An iron catalyst is normally used.
CO2 + 2H2 Catalyst. C + 2H20 2H20 Electroylsis, 2H2 + 02
CO2 - C + 0
2
The water is then electrolyzed to oxygen and hydrogen. The overall process results in the conversion of carbon dioxide to carbon and oxygen.
Previous studies have shown that water concentrations over an iron catalyst are limited to a maximum of 16% (915K) due to the formation o'f non-catalytic iron oxides. It has been found in this thesis that through the use of cobalt and nickel catalysts, water concentrations of 32% (800K) and 25% (825K), re-spectively, may be obtained. The assumption that the gas phase is in equilib-rium with graphite leads to predictions that even higher water concentrations could be obtained at lower temperatures. However, it is shown that the equilib-rium state cannot be achieved. A mechanism has been proposed which suggests that carbon formation occurs via a carbide intermediate. The difference in Gibbs energy between carbide and graphite reactions correlates with the decrease of water concentrations at low operating temperatures.
DEDICATION
This thesis is dedicated to my parents,
Edwin and Rachael Garmirian,
for all their love, guidance, and support which they have given
Acknowledgements
This project was supported by a research grant from the National Aeronautics and Space Administration. The assistance of Dr. Philip D. Quattrone is gratefully acknowledged.
To Hope College, I give great thanks for providing me with more than just a college education, most of all, to Professors Sheldon Wettack, and William Mungall, and the rest of the Chemistry department for their encourage-ment and leadership. I thank Professors Richard Brockmeirer, James Van
Puttan, and James Toevs of the Physics department for their guidance and education. To Lise Hager, thanks for everything,Stratford, school, and just fooling around.
Bill Doerr and James Christowski made life in the basement interesting and were always very supportive, thanks. The friendship of Ted Bush, John Ninniger, Ken Hellyar, Tom Irwin, Patty Rich, Gina Shuck, Mike Klein and of course David Stern made graduate life both in and out of the lab enjoyable and entertaining. The friendship, discussions, and technical advice of Charles Foshey are greatly appreciated. Harold Duffett was a good friend, thanks.
I must thank (Father) Frank Bates, Peter Levy (Goodwrench), and Sue Harrison for their friendship and my Armenian wife.
Without the help and friendship of both Sally Kreuz and Stan Mitchell this thesis would have never been bound. Jeffrey Wingard's participation in collecting the experimental data is also appreciated.
I would like to thank Professor Williams for sincerely and patiently answering the somewhat obscure questions of a wondering graduate student.
I appreciate the time Professors Meissner and Satterfield spent discussing this thesis with me.
5
Albert Sacco was the one who inspired my initial interest in the Bosch process, to him I give many thanks.
I would like to thank Professor Robert Reid for the guidance and inspir-ation he has given me throughout my years here at M.I.T. Without Professor Michael Manning's daily discussions and technical advice, I still might have
finished this thesis, but without his inspiration, dedication, and genuine concern for my development both as an engineer and a human being, I would
have drifted by the wayside.
I would like to thank my brothers and sisters Bobby, Calvin, Paul, Bob, Dawn, Pat, Mary, Peter, Cutts, Billy, Mag, Jim, Joanne, and of course Patty
for all their love and support.
For a beautiful family, Sunday dinners, all the love in the world, and their daughter, I thank Marty and Helen (Granny) Mehron.
And ofcourse, who can forget Barbara. The two years I have known her have been the happiest years of my life. Without her unfailing love and support I might have ended up an automechanic.
Department of Chemical Engineering Massachusetts Institute of Technology
Cambridge, Massachusetts 02139
Professor Jack P. Ruina
Secretary of the Faculty
Massachusetts Institute of Technology Cambridge, Massachusetts 02139 Dear Professor Ruina:
In accordance with the regulations of the Faculty, I herewith submit a thesis entitled, "Carbon Deposition in a Bosch Process Using a Cobalt and Nickel Catalyst", in partial fulfillment of the requirements for the degree of Doctor of Philosophy In Chemical Engineering at the Massachusetts Institute of Technology.
Respectively submitted,
Table of Contents
1. Summary ... 14
1.1 Experimental Apparatus ... 15
1.2 Approach ... 16
1.3 Experimental Results ... 18
1.4 Discussion of the Equilibrium Results ... 20
1.5 Application of Results ... 25
2. Literature Survey ... 27
2.1 Previous Bosch Studies ... 28
2.1.1 CO-C02-Fe-Fe304 Equilibrium ... 29
2.1.2 The Equilibrium of H2,CO, CO2, CH4, and H20 with Iron and Iron Oxide ... 34
2.2 Nickel and Cobalt as Catalysts in the Bosch Process ... 39
2.2.1 Thermodynamics of the Ni-0 2 and Co-0 2 Systems .. 39
2.2.2 Thermodynamics of the H2-CO-CH 4-CO2-H20-Carbon System ... 44
2.2.2.1 Dent's Study of the Carbon-Gas Equilibrium ... 47
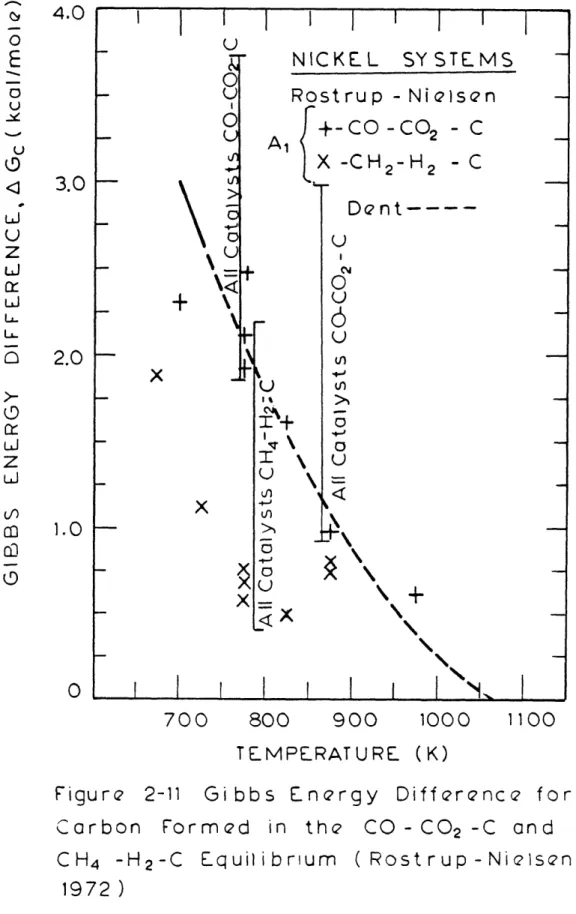
2.2.2.2 Rostrup-Nielsen's Study of the CO-C02-C and the CH4-H2-C Equilibrium ... 53
2.2.2.3 Methane-Hydrogen Equilibrium Over Various Solid Phases ... 59
2.2.3 Carbon and Carbides ... 66
2.2.3.1 The Formation and Decomposition of Cobalt and Nickel Carbide ... 66
2.2.3.2 The Occurence of Carbides During Car-bon Formation ... 74
2.2.3.3 The Hydrogen Content of Carbon Formed Over Iron ... ... . 80
2.2.4 Carbon Fiber Formation Mechanism ... .. 80
2.2.4.1 Dissolution-Diffusion Mechanisms for Filamentary Growth ... 80
2.2.4.2 Filamentary Growth through a Carbide Intermediate ... 96
2.2.4.3 The Importance of Surface Diffusion in Filamentary Growth ... 99
3. Apparatus and Procedure ... 102
3.1.1 3.1.2
Feed-Gas Delivery System ...
Thermogravimetric Reactor ... 3.1.2.1 Preheater and Lower Reactor Support Tube ...
3.1.2.2 Top Section Reactor Support Tube 3.1.2.3 Catalyst Assembly .
3.1.2.4 Furnace ... 3.1.3 Gas Sampling System ... 3.2 Experimental Procedure ... 3.2.1 Determination of Run Conditi 3.2.2 Equipment Start-Up ...
3.2.3 Run Procedure ... 3.2.4 Shut-Down Procedure ... Results and Discussion ...
4.1 Preliminary Experiments .... 4.2 Equilibrium Studies ...
4.2.1 Bosch Equilibrium S 4.2.2 Equilibrium Studies sitions and Temperatures ...
... e.... ... e... ons ... ... ... ,
.. .... .
. ..
.. ..
.oo... tudies at Var 4.2.3 A Discussion of the Equili sults ... ..io ... ious Compo-brium Re-... i.o.4.4 Hydrogen Content of Carbons Formed Under Various Conditions ... Application of Results ...
Conclusions ... Recommendations ...
...
Calculation of Equilibrium Gas Nomenclature ... Literature References ... ... Compositions ... ... ... ... ... 102 107 107 107 Appendix 8.1 8.2 8.3 109 109 111 114 114 114 115 115 117 117 117 123 137 151 171 175 184 185 186 186 188 190
Table of Figures
2-1 Phase Diagram for the Iron-Iron Oxide-Gas and Graphite-Gas Equilibria .. 31 2-2 Carbon Deposition from CO-CO2 Mixtures (Manning,1976) ... 32 2-3 Inhibition of Carbon Deposition by Fe304 at Various O/H Ratios (Sacco,
1977 ) ... 35 2-4 Determination of the Iron/Wustite Phase Boundary in a Five Component
Gas Mixture at Various O/H Ratios (Sacco, 1977) ... 37 2-5 Percentage of Theoretical PH /PH Versus Experimental PH H .... 38
for Various O/H values 2 20 e (Sacco, 1977) 2 2
2-6 Nickel-Oxygen Phase Diagram (Bogatski, 1951) ... 40 2-7 Equlibrium Constant for the Reaction 2 Co304 ' 6 CoO + 02 (Kubaschewski,
1967) ... ... ... 41 2-8 Phase Diagram for the Metal-Metal Oxide-Gas Equilibria for the Nickel
or Cobalt System ... 43 2-9 The Decomposition of Carbon Monoxide over a Nickel Catalyst (Dent,
1945) ... ... 49 2-10 Gibbs Energy Difference for Carbons Formed from Various Gas Mixtures
(Dent, 1945) .... ... 50 2-11 Gibbs Energy Difference for Carbon Formed in the CO-CO2-C and CH4-H 2
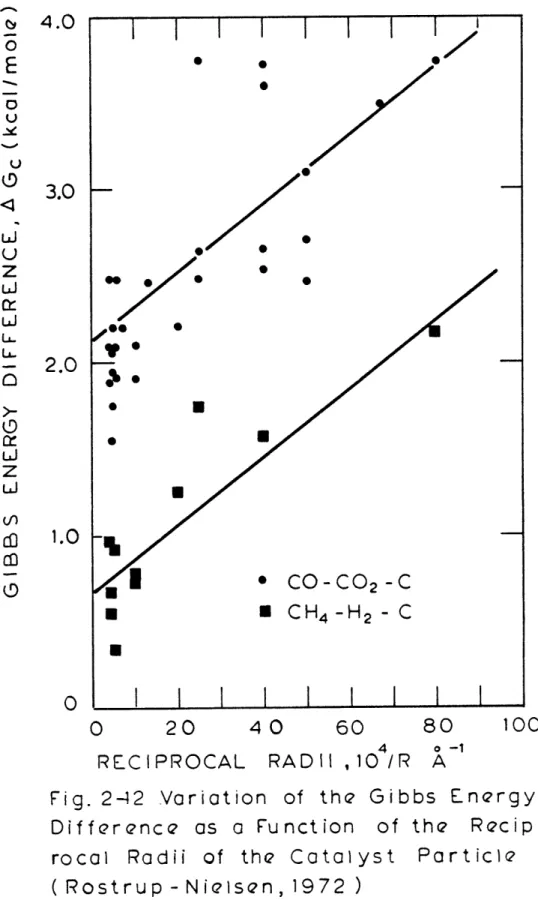
-C Equilibrium (Rostrup-Nielsen, 1972) ... 55 2-12 Variation of the Gibbs Energy Difference as a Function of the
Recipro-cal Radii of the Catalyst Particle (Rostrup-Nielsen, 1972) ... 58 2-13A Gibbs Energy Difference for the CH4-H2-C or - Nickel-Nickel Carbide
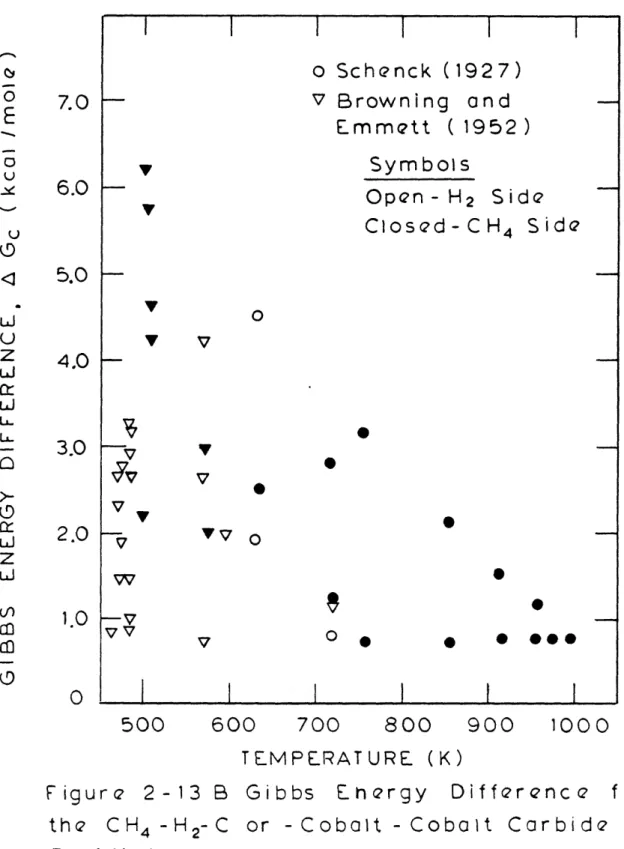
Equilibrium ... 61 2-13B Gibbs Energy Difference for the CH4-H2-C or - Cobalt-Cobalt Carbide
Equilibrium ... 64 2-14 The Decomposition of Cobalt Carbide at Various Temperatures (Hofer
et al., 1949) ... ... 67 2-15 An Arrhenius Plot for the Decomposition of Cobalt Carbide (Hofer et
al., 1949) ... 70 2-16 The Decomposition of Nickel Carbide at 596K (Hofer et al., 1950) ... 71 2-17 An Arrhenius Plot for the Decomposition of Nickel Carbide (Hofer et
Sigmoidal Growth Curve for Carbon Deposition ...
Fiber Growth Mechanism (Baker et al., 1972) ... Extrusion Mechanism of Fiber Growth (Baker and Waite, 1975) ... Fiber Growth Mechanisms Involving Iron Carbide (Boehm, 1973) ... Fiber Growth Mechanism Involving Surface Diffusion (Oberlin
et al., 1976) ...
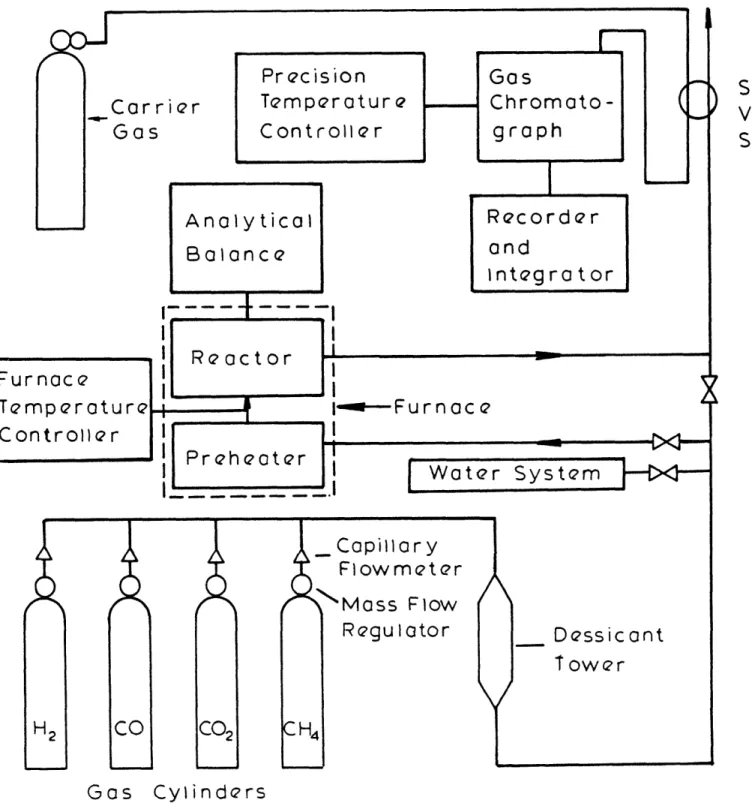
Schematic Diagram of Experimental System ... Feed-Gas System ...
Water Vapor Delivery System ... Top and Lower Reactor Section Including Catalyst Carrier in Support ... Gas Sampling Valve System ... Carbon Deposition on Cobalt Powder from Carbon Deposition on a Ni/A1203 Catalyst
4-3 Carbon 4-4 Carbon 4-5 Rate of
Deposition Deposition
on Cobalt Wire from a on Cobalt Powder from Carbon Deposition as
Carbon Deposition as Carbon Deposition as Carbon Deoosition as )eposition and Removal
Carbon Deposition as Carbon Deposition as Carbon Deposition as Carbon Deposition as Function Function Function Function Boundary runction Function Function a Function Pre-heat...er Pre-heater a H.: 2: from H2 :CO a H : of AG of AGc of AG of AG for an of AG of AG of AG of AGc
CO
(1:1)
H2 :CO 1:1) Mi (1 :1) for an for an for an for an O/H = 0. for an for an for an for an 3-1 3-2 3-3 3-4 3-5 3-6 4-1 4-2n Deposition and Removal Boundary for an O/H = 0.5 Over Nickel 4-15 Rate of Carbon Deposition as a Function of AGc for an O/H = 0.17 .. 2-18 2-19 2-20 2-21 2-22 83 84 92 98 100 103 104 106 108 110 112 118 119 120 121 124 125 126 127 130 131 132 133 134 136 138 Mixture .... (1:1) Mixture xture ... Mixture ... O/H = 0.5 ... O/H = 0.5 ...
O/H = 0.5 ...
O/H = 0.5 ... 5 over Cobalt O/H = 0.5 ...O/H
= 0.5 ...
O/H = 0.5 ... O/H = 0.5 ... D 4-6 4-7 4-8 4-9 4-10 4-11 4-12 4-13 4-14 Rate Rate Rate Carbc Rate Rate Rate Rate Carbo ... ... .... . .. '4-16 4-17 4-18 4-19 4-20 4-21 4-22 4-23 4-24 4-25 4-26 4-27 4-28 4-29 4-30 4-31 4-32 4-33 4-34 4-35 4-36 4-37 4-38 Rate of Rate of Rate of Rate of Rate of Rate of Rate of Rate of Rate of Rate of Rate of Carbon Cobalt Rate of Rate of Rate of Rate of Rate of Rate of Rate of Rate of Rate of Rate of Rate of
4-39 Carbon Deposition and Removal Nickel ...
a Function of AG for an O/H = 1.5. Carbon Carbon Carbon Carbon Carbon Carbon Carbon Carbon Carbon Carbon Carbon )eposit Carbon Carbon Carbon Carbon Carbon Carbon Carbon Carbon Carbon Carbon Carbon Carbon Deposition as Deposition as Deposition as Deposition as Deposition as Deposition as Deposition as Deposition as Deposition as Deposition as Deposition as ion and Removal
Deposition as... Deposition as Deposition as Deposition as Deposition as Deposition as Deposition as Deposition as Deposition as Deposition as Deposition as Deposition as a Function of a Function of a Function of a Function of a Function of a Function of a Function of a Function of a Function of a Function of Boundary for ... Function of a Function of a Function of a Function of a Function of a Function of a Function of a Function of a Function of a Function of a Function of a Function of Boundary for
Carbon Deposition Boundary and Ni-Ni 3C-CH4-H2 Equilibrium ... Phase Diagram for Nickel Catalyzed Bosch Process ...
AG for AGc for AGc for AGc for AGc for AGc for AGc for AG for c AG for Various AGc for AG for AG for AG for AGc for AG for AG for AG for AGc for AGc for AG for Various CH4-H2 Mixtures.. an O/H = 0.17 .... an O/H = 1.5 ... CO-CO2 Mixtures CH4-H2 Mixtures an O/H = 1.5. CO-CO2 Mixtures . CH4-H2 Mixtures an O/H = 1.5 ... CO-CO2 Mixtures O/H Ratios Over an O/H = 0.17 .... an O/H = 1.5 ... CH4-H2 Mixtures .. an O/H = 1.5 ... CO-CO2 Mixtures . CH4-H2 Mixtures an O/H = 1.5 .... CO-CO2 Mixtures.. CH4-H2 Mixtures an O/H = 1.5 ... CO-CO2 Mixtures .. O/H Ratios over
4-40 4-41 139 140 141 142 143 144 145 146 147 148 149 150 152 153 154 155 156 157 158 159 160 161 162 163 167 169
12
5-1 Equilibrium Water Concentration of a Bosch Reactor for Graphite, Iron,
Cobalt and Nickel Systems ... 176
5-2 Bosch Recycle Reactor ... 178
5-3 Gas Recycle Ratio for a Bosch Recycle Equilibrium Reactor ... 179
5-4 Equilibrium Conversion of the Reverse Water-Gas Shift Reaction ... 181
13
Table of Tables
2-1 Carbon Equilibrium in a Methane Synthesis System (Dent, 1945) ... 52 2-2 Induction Period and Quasi-Zero-Order Rate Constants for
Decomposi-tion of Fully Carburized Ni3C. (Hofer et al., 1950) ... 68 2-3 Effect of Carbon Monoxide-Hydrogen Composition and Temperature on
the Atomic Carbon-Hydrogen Ratio of Carbons (Walker et al., 1959) . 79
2-4 Change of Properties of Carbons with Weight Formed from a 99.2% CO-0.8% H2 Mixture at 801K over 0.1 Gram of Carbonyl Iron (Walker
et al., 1959) .... ... 81
2-5 Variation of Filamentous Carbon Yields and Structure with Various
Hydrocarbons (Baker et al., 1975a) ... 87 3-1 Feed-Gas Analysis ... ... 102
3-2 Critical Gas Chromatograph Parameters ... 113 4-1 Effect of AGc on the Equilibrium Gas Compositions ,in the Bosch
Process ... ... 128
1.0 Summary
The Bosch process had been investigated by NASA as a means of recovering oxygen from metabolic carbon dioxide. The ultimate objective has been to
con-struct a life support system capable of supplying oxygen in a cyclic process.
CO2 + 2H2 -+ C + 2H20
An iron catalyst is normally used. The water formation reaction is followed by electrolysis to yield hydrogen and oxygen,
2H20 -* 2H2 + 02
The overall process results in the reduction of metabolic carbon dioxide to carbon which accumulates on the iron catalyst, and oxygen which is returned to the spacecraft.
In the past, NASA scientists have run Bosch reactors using a steel wool catalyst and recycling unreacted gases to obta'in complete reaction (Holmes et al., 1970). One problem which they encountered was that the maximum water concentration obtained in the reactor was significantly less than the thermo-dynamically predicted equilibrium water concentration. Investigators at MIT were able to show that the phenomena which occurred resulted from oxide
in-hibition rather than slow reaction rates. That is, in addition to the reactions which occurred between carbon monoxide, carbon dioxide, methane, hydrogen,
water and carbon, oxidation of the iron catalyst also occurred. Above 860K the reaction
Fe + H20 Z FeO + H2 occurred, and below 860K,
3Fe + 4H20 Z Fe304 + 4H2
These reactions, coupled with the discovery that iron oxide does not catalyze carbon deposition reactions, led to an explanation for the low water concentra-tions present in the NASA reactors. Manning's (1976) and Sacco's (1977) ex-perimental data on the Bosch system were in good agreement with iron-iron-oxide-gas equilibrium calculations based on tabulated Gibbs energy data.
Preliminary theoretical calculations have revealed that water production limitations associated with the iron catalyzed Bosch process may not be encountered when the iron is replaced by nickel or cobalt. This suggests that a study of the nickel and cobalt catalyzed Bosch process may lead to a more efficient reactor.
1.1 Experimental Apparatus
The experimental apparatus is shown schematically in Figure 3-1. It is composed of the feed-gas delivery system, a thermogravimetric reactor, and a gas-sampling system. In the feed-gas delivery system, chemically pure gases were individually metered and mixed to synthesize desired gas compositions which could be reacted over a given catalyst. Water was added to the mixture as steam. The steam feed was produced by metering liquid water and then vapor-izing it.
The quartz reactor is shown in Figure 3-4. The catalyst assembly shown in Figure 3-5 rests on the lower ground-glass joint which is located in the lower reactor support tube. The feed gases were preheated and then directed vertically through the catalyst assembly. Within the catalyst assembly, the catalyst was held between plugs of quartz wool. Weight measurements were taken periodically by suspending the catalyst carrier from an analytical bal-ance by the suspension "T". Weight changes within ±1 mg could be detected,
Three catalysts were employed in the study. The first was a Ni/Al 203 catalyst powder supplied by the Alfa division of Ventron Corp. It had a BET surface area of 200 m2/g. It was reported to be 60-65 wt% Ni. A second catalyst, cobalt powder, was supplied by Bram Metallurgical Co. The powder was formed from 1-5pm spheres fused to form approximately 40vm aggregates. The purity was reported to be 99.9% and had a BET surface area of 0.7 m2/g. A third catalyst used was prepared by drying a 5 wt% sulution of cobalt ni-trate (Fischer Scientific Company) on lg of quartz wool, at 423K over a cop-per screen. This was then calcined in air and reduced in hydrogen at 700K to
form metallic cobalt.
A gas sampling system, which consisted of a vacuum system, heated gas-sample valve, and gas chromatograph, allowed the determination of inlet and
outlet compositions.
1.2 Approach
In the Bosch process carbon dioxide is reacted with hydrogen to form water and solid carbon. In the process carbon monoxide and methane are also formed. For a given temperature, pressure, and gas phase O/H ratio, if any three independent reactions are chosen, such as
H2 + CO2 _ CO + H2 (A)
CH4 + H20 = 3H2 +CO (B)
2C0 = C + CO2 (C)
then the equilibrium mole fractions of each component can be calculated. Typically, a solid carbon phase of pure s-graphite is assumed in making the calculations. However, results of Dent (1945) and Rostrup-Nielsen (1972) indicate that such a simplification can lead to erroneous results. The
equilib-17
rium constant for reaction (C) and (D) were measured by both Dent and Rostrup-Nielsen.
CH4 * 2H2 + C (D)
They found that only at temperatures of about 1000K would the assumption of a solid phase of s-graphite be justified. At temperatures below that, it was found that the Gibbs energy change for their reactions was apparently greater than that for the corresponding reaction with a solid phase of graphite. This difference was about 1.5 and 3.0 kcal/mole at 800 and 700K, respectively.
Table 4-1 shows the equilibrium gas composition at various temperatures, 1
atmo-sphere and an 0/H ratio of 0.5, assuming a solid phase of either graphite or one which deviated from graphite by the amount reported by Dent. As can be seen the results are quite different depending upon the form of carbon chosen for the calculation. The water concentration changes from 18 to 13%, 32 to
17%, and 45 to 11%, at temperatures of 900, 800, and 700K, respectively, for solid phases of graphite versus "Dent" carbon, respectively. These calculations demonstrate the magnitude effect that the Gibbs energy differences can have on equilibrium water concentrations obtainable in a Bosch process and emphasize the importance of experimentally determining the carbon-gas equilibrium.
In the calculations of graphite-gas equilibrium discussed previously three independent reactions, (A), (B) and (C), were chosen for the computations. The only reaction which included graphite was (C). Since it has been shown that
the Gibbs energy change of reactions involving carbon could not be calculated as that for a reaction with graphite, the parameter, AGc , was defined to
account for this Gibbs energy difference, so that
AG = -RT in K + RT ln K
where K may be written as
P
K C2 (C)
P p 2
CO
By allowing the equilibrium constant of reaction (C) to vary as
K = K exp(-aGC/RT)
K(C) P(C)graphite exp(-AGC/RT)
equilibrium gas calculations can be made for a given temperature, pressure, O/H ratio, and Gibbs energy of the experimental carbon.
Equilibrium gas compositions were then calculated for values of the para-meter AGc , from -5.0 kcal/mole to +5.0 kcal/mole. To determine the carbon
de-position boundary, gas mixtures corresponding to these AGc 's were passed over
a nickel or cobalt catalyst to determine whether carbon deposition, carbon re-moval, or neither occurred. The calculations and associated gas compositions extended beyond literature values of AGc which were reported by Dent (1945), Rostrup-Nielsen (1972), and Schenck (1927) to insure that the gas compositions employed experimentally would enclose the equilibrium point.
1.3 Experimental Results
The experiments were run at temperatures of 700, 750, 800 and 900K and a pressure of 1.0 atm. Measurements were made for the binary-gas systems of
CO-CO2 and CH4-H2 over carbon and catalyst. Multicomponent experiments with H2, CO,CH4, CO2, H20, and C were also carried out at gas phase O/H ratios of
0.17 0.5 and 1.5. Preceeding every equilibrium run where fresh catalyst was put into the reactor and reduced, carbon was deposited from a 1:1 mixture of hydrogen and carbon monoxide. This was done at the reaction temperature of the equilibrium run. In each case about 0.2 g C/g catalyst was deposited.
The life of the catalyst (g carbon/g catalyst)used in the Bosch process is critical. Certainly, no benefit from the Bosch process is obtained if one must transport a larger mass of catalyst than the mass of oxygen which it
eventually regenerates. To determine the catalyst life, an experiment similar to the preliminary carbon deposition described in the last paragraph was run at 800K. Figure 4-4 shows the results. As can be seen, the rate of carbon deposition remains constant up to 100 gC/g cobalt.
Figure 4-5 shows the results from an experiment to determine the carbon deposi-tion boundary at 900K, 1.0 atm, and an 0O/H ratio of 0.5 over cobalt. In the
fig-ure, the experimentally obtained rates of carbon deposition (mg/min) are plotted as a function of the parameter AG (kcal/mole), which is characteristic of.~the corresponding gas phase composition. Simultaneously drawn are curves which
represent the gas compositions which yielded the experimental data at the
various values of AGc . These compositions were calculated to be in equilibrium
with a carbon of the corresponding AGc . As can be seen the equilibrium point is indicated where the rate of carbon deposition and removal go to zero. This occurs when the parameter AGc is zero. Hence the equilibrium gas composition is that which one would expect to be in equilibrium with graphite.
In other experiments, the equilibrium point was not so clearly defined. For example, in Figure 4-7 a region of zero rate of carbon deposition exists between the point at which carbon deposition stopped (AGc z 1.5 kcal/mole),
and carbon removal began (AG z -1.0 kcal/mole). The results of over 30
ex-periments similar to the one portrayed in Figure 4-7 are summarized for co-balt in Figure 4-27 and nickel in Figure 4-39. In these figures, the limits of the region of no carbon deposition or removal are plotted. That is, for
a given experiment, the point at which carbon deposition stops or carbon removal begins is olotted as a function of tempe-a&ture. As can be seen in
the two figures, the carbon deposition boundary is seen to deviate more from the graphite equilibrium at low temperature. Carbon removal, for the most part, is observed to occur for AGc less than zero. For the experiments at 700K, over nickel and cobalt, carbon removal is typically not observed.
1.4 Discussion of the Equilibrium Results
In the iron-catalyzed Bosch process studied by both Manning (1976) and Sacco (1977),the iron-iron oxide-gas equilibrium curve was shown to correspond with the carbon deposition boundary and hence determines the concentration in that system. The inacitivity of the iron oxide as a catalyst for carbon
deposi-tion prevented the attainment of the higher water-concentradeposi-tions expected at the graphite-gas equilibrium. In other words, if iron oxide was active for the
various carbon deposition reactions, the graphite-gas equilibrium would be reached. The experimental results presented clearly show that the high water
con-centration predicted by the graphite-gas equilibrium at both 700 and 750K is also not attainable over either a nickel or cobalt catalyst. For example, as shown in Figure 4-7, the mole fraction of water expected to be in equilib-rium with graphite (AGc = 0) is about 38% at 750K. However, carbon deposi-tion and hence the overall process stops (AGc = 1.5 kcal/mole) at a water mole
fraction of about 24%. This effect is important when considering the optimiz-ation of the Bosch process.
The results at low temperatures may be due to a carbide intermediate. That is, one may have a reversible reaction to form carbide from metal and methane such as
CH4 + nMe ' MenC + 2H 2
where Me can be either nickel (where n=3) or cobalt (where n=2 or 3). The formation of carbide can also occur from other reactions, such as
H2 + CO + nMe I MenC + H20
and
2CO + nMe = Me C + CO2
The carbide can also decompose to free metal and carbon
Men C - C + nMe
It is suggested that the formation of carbon occurs by this reaction series. Quite specifically, the carbon is formed via an intermediate carbide. The netresults, using the methane-hydrogen-carbon reaction as one example, is
CH4 -÷ C + 2H2
In our experimental results, the observed weight increases are much greater than could be accounted for by the formation of a carbide. Thus, if a car-bide formed, it must have continuously decomposed to account for the mass in-creases observed in the experiments.
Carbides have, in fact, been shown to exhibit a metastable behavior. Hofer et al. (1949, 1950) have shown that both nickel and cobalt carbides de-compose readily at temperatures of 630K; the time required was less than one hour. Nagakura (1957, 1961) reported that in a temperature programmed study, decomposition of nickel carbide did not occur until 704K. He also indicated that the maximum rate of carbide formation (formation less decomposition) occurred at 623K. For the cobalt system, the decomposition of Co2C occurred at 723K and at 750K for Co3C. The maximum rate of formation (formation -decomposition) of both carbides occurred at temperatures between 723 and 773K. It should also be noted that Renshaw et al.(1971) observed Ni3C at temperatures
as high as 823K. In Nagakura's study, only free metal and carbon were observed at temperatures above 773K for Ni and 823K for Co. Thus, the available ex-perimental evidence indicates that the existence of both nickel and cobalt carbide at temperatures between 700 and 800K is highly likely.
Browning and Emmett (1952) also studied the equilibrium of nickel car-bide with both nickel and a gas phase of methane and hydrogen. Little scat-ter was observed in them in the nickel data. Also, the stability of the car-bide was shown to be greater than that of cobalt carcar-bide. With X-ray analysis, the hexagonal close-packed sturcture of Ni3C was observed confirming that measurements of the carbide equilibrium were in fact being made. Upon
com-parison of this low temperature study with the high temperature results of both Dent (1945) and Rostrup-Nielsen (1972), it is seen that the data fall on a line which results from a plot of AGc versus temperature (Figure 4-39). Since thermodynamics would predict a straight line for a given process, when AH and AS are constant, (AG = AH - TAS), it is believed that the solid species in equilibrium with the gas phase, at high temperature (above 700K), is the carbide and metal phase.
The results obtained over nickel and cobalt have several interesting similarities. First, the point at which carbon deposition ceases deviates more from graphite at lower temperatures. This would be expected if the car-bon deposition boundary corresponded not with the graphite-gas equilibrium,
but with an equilibrium with a different solid phase, such as a carbide. Most important is the agreement between the experimental results over nickel of Figure 4-39 and the nickel-nickel carbide methane-hydrogen equilibrium
line as shown in Figure 4-40. Secondly, although for the experiments over cobalt at temperatures of 800 and 900K carbon deposition and removal were
most of the other cases this was not so.
There either existed a region of no weight change or, as for the tempera-ture of 700K, no carbon removal was observed. This indicates that either the method of weight detection was not sufficiently sensitive, or below the point at which carbon deposition ceased the catalyst was converted to a less active form. In almost all cases carbon removal occurred only if AGc of the gas mix-ture was less than 0.0 kcal/mole. This would also be expected for a system where graphite was present. In Figure 4-41 the positions of the
graphite-gas and nickel-nickel carbide-graphite-gas equilibrium lines are shown at 700 and 800K.
The diagram for cobalt is similar. As temperature is increased the graphite and carbide lines are seen to move closer together. The carbide phase line indicates the points at which the gas phase is in equilibrium with both metal and metal carbide. Above the line, the free metal will react to form carbide; below the line, the carbide will react to form free metal. The graphite equili-brium is different since there is only one solid phase which is considered along with the gas phase. Gas mixtures, which are represented by a point above the line, deposit carbon, while ones which are below the line remove carbon.
In the experiments studied in this work, carbon deposition was observed in the region of the phase diagram above the metal-metal carbide equilibrium curve. This was a given distance from the graphite-gas equilibrium curve. Since the upper boundary is in fact a carbide phase line, in the region above the line ("X"), metal carbide is present. For most of the experiments there
existed a region of no weight change. Although carbon removal was not always observed below the graphite phase line (AGc = 0.0 kcal/mole), very rarely was
it observed above. In the region below the carbide phase line ("Y" and "Z"), no carbide would be expected to be present. If carbon formation only occurred through a carbide intermediate, no carbon deposition would be expected below
the carbide equilibrium curve ("Y"). The reaction
Men C + 2H2-÷nMe + CH 4
is not observed in that region either because the carbide decomposes to car-bon quickly, or the amount present is a relatively small fraction of the total
mass of metal plus carbon.
Carbon removal was in fact observed under some conditions. This must have occurred via the reaction
C + 2H2 - CH 4
which will only occur for gas mixtures where AGc is less than 0.0 kcal/mole. For the most part, Figures 4-27 and 4-39 support this thermodynamic argument
In this analysis, the carbon deposition could have been considered to re-sult from a carbon with a different Gibbs energy. The Gibbs energy difference could have been accounted for by structural differences such as those described in the analysis by Rostrup-Nielsen (1972). However, if this were the case,
carbon removal would have been expected in the region just below the carbon
equilib-rium curve for the hypothesized non-graphitic carbon. Also the agreement (Fig-ure 4-40)between the experimental data over nickel presented in Figure 2-13a and the nickel carbide equilibrium data of other authors gives strong evidence that the carbon deposition boundary coincides with the metal-metal carbide-gas equilibrium curve.
In summary, carbon deposition occurred via a metal carbide intermediate, upon reaching the metal-metal carbide-gas equilibrium carbon deposition ceased. In the region between the carbide and graphite equilibrium curves ("Y"),
where no carbide was present, no carbon deposition or removal was detected. Be-low the graphite phase line, carbon removal was observed. The rate, however,
was slow and became negligible as the temperature of the experiments was low-ered.
1.5 Application of Results
To date, iron nickel, and cobalt have been examined as possible catalysts for the Bosch process. The maximum water concentration obtainable in the iron system was shown by both Manning (1976) and Sacco (1977) to be determined by the iron-iron oxide-gas equilibrium at low temperature and by the graphite-gas equilibrium at high temperature. The present results, however, with
nickel and cobalt catalysts, indicate that the maximum water concentration is determined by the corresponding carbide equilibrium at low temperature and by the graphite-gas equilibrium at high temperature.
The equilibrium water concentrations obtainable in the graphite, cobalt, nickel, and iron system are shown in Figure 5-1. For the iron system, the maximum water concentration obtainable occurs at 915K, the temperature at which
the iron-iron oxide-gas equilibrium and the graphite equilibrium intersect at an O/H ratio of 0.5 For the cobalt system, it occurs at 800K, the point at which the carbide-gas equilibrium begins to have an effect. In the experiments
run over nickel, the graphite-gas equilibrium was not reached even at 900K. The maximum water concentration here occurred at 825K. The water concentra-tions were 16, 32, and 25% for iron, cobalt, and nickel, respectively. In a simple recycle reactor, the recycle ratio is calculated as
r = 2 ( 1 -l) moles gas recycled XH20,Eq. mole CO2 fed
For the iron, cobalt, and nickel systems, the minimum recycle ratio is 10.5, 4.3, and 6.0, respectively. For an equilibrium reactor, cobalt yields the low-est recycle ratio. The recycle ratios for the various catalysts are plotted
26 versus temperature in Figure 5-3.
2. Literature Survey
The Bosch process has been investigated by NASA as a means of recovering oxygen from metabolic carbon dioxide. The ultimate objective has been to construct a life support system capable of supplying oxygen in a cyclic pro-cess. The cycle begins by reducing the carbon dioxide with hydrogen to form solid carbon in what is known as the Bosch process. An iron catalyst is
nor-CO2 + 2H2 - C + 2H20
mally used. The water formation reaction is followed by electrolysis to yield hydrogen and oxygen,
2H20 -÷ 2H
2 + 02'
The overall process results in the accumulation of carbon on the iron cat-alyst with no net change in carbon dioxide, oxygen, or hydrogen mass.
In the past, NASA scientists have run Bosch reactors using a steel wool catalyst and recycling unreacted gases to obtain complete reaction (Holmes et al., 1970). One problem which they encountered was that the maximum water concentration obtained in the reactor was significantly less than the thermodynamically predicted equilibrium water concentration. Investigators at MIT were able to show that the phenomena which occurred resulted from oxide inhibition rather than slow reaction rates. That is, in addition to the reactions which occurred between carbon monoxide, carbon dioxide, methane,
hydrogen, water and carbon, oxidation of the iron catalyst also occurred. Above 860K the reaction
occurred, and below 860K,
3Fe + 4H20 - Fe304 + 4H2
These reactions, coupled with the discovery that iron oxide does not catalyze carbon deposition reactions, were given as an explanation for the low water concentrations present in the NASA reactors. Sacco's (1977) and Manning's
(1976) experimental data on the Bosch system were in good agreement with iron-oxide-gas equilibrium calculations based on tabulated Gibbs energy data.
Preliminary theoretical calculations have revealed that water produc-tion limitaproduc-tions associated with the iron catalyzed Bosch process may not be encountered when the iron is replaced by nickel or cobalt. This suggests that a study of the nickel and cobalt catalyzed Bosch process may lead to a more efficient reactor.
By measuring the compositions of gas mixtures of carbon dioxide, carbon monoxide, methane, hydrogen and water in equilibrium with deposited carbon, and then comparing these with gas compositions calculated making the assump-tion that the solid phase is B-graphite, it might be possible to determine if either a carbide or some other form of carbon is affecting the equilibrium.
2.1 Previous Bosch Studies
In the early 1970's researchers at MIT became interested in the Bosch process, especially with the difficulty which NASA scientists had encountered while running Bosch prototype reactors. By running a Bosch recycle reactor using a steel wool catalyst, the conversion of carbon dioxide to water was achieved. However, a large recycle rate was needed considering the low water concentrations present in the reactor. The water concentrations obtained were much lower than that predicted by equilibrium calculations based on a solid phase of s-graphite with a gas phase of carbon dioxide, carbon monoxide,
methane, hydrogen, and water.
2.1.1 CO-C02-Fe-Fe304 Equilibrium
Since the gas phase compositions obtained in the prototype reactors had not reached the equilibrium expected at the graphite-gas phase boundary, it was believed that a closer look should be taken at the thermodynamics of the system. To better understand the Bosch process, Manning (1976) began both a thermodynamic analysis and an experimental study of the process. Considering a gas phase of hydrogen, carbon monoxide, methane, carbon monoxide, and
water, and a solid phase of carbon, three independent reactions may be chosen to describe the system. As an example, there is the reverse water-gas shift reaction,
H2 + CO2 ÷ CO + H20, the disproportionation of carbon monoxide,
2CO ; C + CO 2
and the methanation reaction,
C +2H2 = CH4
A phase rule analysis of the system gives a variance of three which allows the temperature, pressure, and gas phase elemental O/H ratio to completely set all other intensive variables. For a metallic steel wool catalyst, calculation of the gas phase concentration in equilibrium with iron and iron oxide phases involves determining the particular iron oxide phase which is expected to be in equilibrium with the metallic phase at a given temperature. At 800K, the
stable iron oxide species determined from the Fe-O phase diagram (Muan and
gas equilibria are
3Fe + 4H20 + Fe304 + 4H2 4C0 2 + 3FE ÷ Fe 0 + 4C0
3H2 + CO Z CH4 + H20
Figure 2-1 is an equilibrium phase diagram for a gas phase of carbon dioxide, carbon monoxide, methane, hydrogen, and water at 1 atm and 800K. Both the iron-iron oxide-gas and the graphite-gas equilibrium lines are shown. Above the graphite-gas equilibrium line one expects to deposit carbon, while below the line one would expect carbon removal. The iron-iron oxide phase boundary reveals the stable species of iron which would be expected to be in equili-brium with an equiliequili-brium gas mixture. For a point representing a gas phase composition above the oxide phase boundary, iron is the stable species, below the boundary iron oxide is stable.
In experimental studies, Manning employed a gravimetric differential re-actor, which is similar to the one used in this thesis. The catalyst employed in the experiments was grade 2 steel wool supplied by the American Steel Wool Co., Long Island City, N.Y. The concentration of alloying elements in the
steel wool was 0.36 wt%C, 0.70wtMn, 0.04 wtP, 0.018 wt%S, and 0.4ppm N. The BET surface area of the catalyst was determined to be 389 cm2/g from the
ad-sorption of krypton at liquid nitrogen temperatures.
In one experiment, 250 mg of steel wool and approximately 700 mg of de-posited carbon at 823K were used to study the equilibrium of the reaction,
2 CO - C + CO2
Figure 2-2 gives the results in graphical form. Four gas mixtures were passed over the catalyst which resulted in three different phenomena. For a 50:50 CO:CO2 mixture, no carbon depostion was observed and a constant weight
measure-CARBON PRESSURE = IATM TEMPERATURE = 800K
X
SCO
X
Co
2
CH4, X
Xv
V
HYDROGEN H20UPPER CURVE, IRON-IRON OXIDE-GAS EQUILIBRIA LOWER CURVE: GRAPHITE-GAS EQUILIBRIA
FIG. 2-1
Phase Diagram for the Iron-Iron Oxide-Gas and Graphite-Gas Equilibria
823 K
1
ATM
250 mg
Fe Wool Catalyst
U)E
co
O c-l O uJ/0
I 0/00
00
0-I
I1 o
1
2
3
4
TIME.,
hours
5
6
Figure
2-2 Carbon Deposition
Mixtures
( Manning, 1976 )
From
CO-CO
2 //750
- 50 oloCO 53 0/60
50 /loC02 47 O/o 40725
700
675
7-
1-cO
SCO2
ment was obtainable for almost a two hour period. For the next two hours a 53:47 CO:CO2 and a 60:40 CO:CO2 mixture were passed over the catalyst which
resulted in the erratic weight gain and loss. These weight changes were of the order of 10-15% of the total weight. The final gas mixture was a 66:34 CO:CO2 which resulted in a rapid rate of carbon deposition.
To understand the phenomena occuring in this experiment, examine the two reactions, the iron oxidation reaction,
3Fe + 4C02 ÷ 4C0 + Fe304 and the disproportionation of carbon monoxide,
2 CO + CO2 + C
At 823K the equilibrium carbon monoxide gas phase compositions for the two re-actions are 53 and 13 mole%, respectively. Manning postulated that with a 66:34 mixture of CO:CO2 mixtures iron oxide is converted to its reduced from at which
point carbon deposition begins. In the intermediate zone, Manning indicated that the experimental technique did not allow one to differentiate between carbon deposition and catalyst oxidation.
For the most part, Manning's explanation for equilibrium phenomena is quite sound. Experimentally he has given good evidence for the interference of oxides on carbon deposition. Through careful coupling of both theoretical and experimental data, Manning was able to explain on thermodynamic grounds the prevention of carbon deposition on iron oxides which could explain the low water yields in Bosch reactors. Examining his results, it can be seen that during the intermediate phase there occurs no weight gain on loss over the base line which was established during the 50:50 CO:CO2 period. This indicates that there exists two kinds of reactions occuring which cause both weight increases and decreases. Manning believed that they were the
deposi-tion of carbon and the reducdeposi-tion of iron.
2.1.2 The Equilibrium of H, CO CO2, CH4, and H20 with Iron and Iron Oxide
Sacco studied the equilibria of gas mixtures containing carbon dioxide, carbon monoxide, methane, hydrogen, and water over an iron catalyst using the experimental apparatus described in this thesis. Water was added to the gas mixture by means of a saturator. The saturator consisted of three round
bottom flasks connected by glass tubes and bubblers. To set water content of the gas stream, the flasks were contained in a constant temperature bath. The partial pressure of water desired was set by the temperature of the bath. The gas was passed through a vertical bed packed with glass beads to remove any entrained liquid water.
Figure 2-3 shows the results of Sacco's experiments at 800K. The phase diagram shows the various equilibrium solid phases and the phase boundries which separate them. The triangles indicate gas compositions which were
passed over the catalyst, closed triangles representing weight gain, or carbon deposition, and open ones representing no weight change.
To determine the gas phase composition at which carbon deposition ceased, Sacco used the following logic and technique. Since a differential reactor was used, it was important that the compositions of the gas mixtures were close to equilibrium. Starting from such a point where carbon deposition was possible, the position of the carbon deposition boundary was determined by fixing the O/H ratio and decreasing the C/H ratio of the inlet gas mixture to a point where carbon deposition ceased. This was accomplished in the following manner. Two independent reactions which relate the gas phase components were chosen to be
TEMPERATURE =8000K
PRESSURE = I.OOATM
C
A WEIGHT GAIN
A SLOW WEIGHT GAIN
& NO WEIGHT LOSS OR GAIN
X
CO
CH4 X
H H20O 0
O/H = 0.17 O/H =0.50 O/H = 1.50
UPPER CURVE IRON-IRON OXIDE-GAS EQUILIBRIA MIDDLE CURVE IRON-IRON CARBIDE-GAS EQUILIBRIA LOWER CURVE GRAPHITE -GAS EQUILIBRIA
Fig. 2-3 INHIBITION OF CARBON DEPOSITION BY Fe3O4 AT VARIOUS
and
3H2 + CO = CH4 + H20
A phase rule analysis reveals that if the temperature, pressure, and O/H
ratio are set, and the C/H ratio varied, only one phase may be present at equilibrium. Using known equilibrium constants,the gas composition would then be calculated. The gas compositions calculated in this manner are not equilibrium compositions but ones which are close to equilibrium. Sacco then used a gas delivery system to make up gas mixtures of the
de-sired composition.
As can be seen from Figure 2-3, as long as the gas compositions were above the oxide equilibrium and therefore iron was the stable phase,
car-bon deposition occurred. Once below the line, carcar-bon deposition was stopped. The work by Sacco is very significant since it gives further evidence of Manning's hypothesis of the role of oxides in carbon deposition. With the
close approach of the oxide equilibrium line it becomes quite clear that Fe304 does not catalyze carbon deposition.
Sacco also investigated the carbon deposition boundary at 900K and various O/H ratios as shown in Figure 2-4. It was found that FeO inhibited
carbon deposition. Figure 2-4 shows how carbon deposition was controlled by adjusting the C/H ratio. Since the three different phase lines are very close together at 900K, it is easier to observe the experimental results in a form which is presented in Figure 2-5. Here the precentage of the theoreti-cal equilibrium PH2 /PH20 ratio is plotted against the experimental PH 2 /PH2 ratio, for various O/H values. Since the PH2 /PH 20 ratio is defined by the equilibrium constant for the oxide reaction,
TEMPERATURE 9000 K
PRESSURE = .0 ATM C
/EIGHT GAIN
LOW WEIGHT GAIN 0O WEIGHT GAIN
VEIGHT LOSS
CO
CH 4 X
H HO 4 4 O
O/H = 0.17 O/H = 1.50 O/H = 3.00
O/H = 0.50
UPPER CURVE IRON-IRON OXIDE-GAS EQUILIBRIA
MIDDLE CURVE IRON-IRON CARBIDE-GAS EQUILIBRIA LOWER CURVE GRAPHITE- GAS EQUILIBRIA
Fig. 2-4 DETERMINATION OF THE IRON/WUSTITE PHASE BOUNDARY
IN A FIVE COMPONENT GAS MIXTURE AT VAR IOUS O/H RATIOS. (Sacco, 1977)
O I.O 2.0 3.0 4. O 5. 6.0
EXPERIMENTAL PH2/PH20
Fig. 2-5 PERCENTAGE OF THEORETICAL PH2/PH20 eq VERSUS EXPERIMENTAL
PH2 PH20 FOR VARIOUS O/H VALUES (Sacco, 1977)
O cJ I 150 ICL m 100 -J 0 w I I-L_ o 5C w C-00 (0
at 900K, the equilibrium ratio is idependent of the gas phase composition.
Error bars which indicate the maximum possible error due to the experimental
me-thod are given. This error was calculated to be 11%. Most of the data fall with-in 10% of the equilibrium PH2 /PH20 ratio. Since a propagation of error analysis
indicates the maximum possible error, Sacco suggested that some of the scatter reflected another process.
Sacco suggested the possiblility of the formation and reduction of multiple
oxides phases. At 900K, under an atmosphere of carbon dioxide and water, he
de-tected the formation of both hematite (Fe203) and wustite (FeO) after an inlet leak
in reactor was detected and reactor shut down was necessitated. Although an
interesting phenomena, multiple oxide formations at this point do not seem reasonable.
2.2 Nickel and Cobalt as Catalysts in the Bosch Process
Due to the oxide limitations fo the iron catalyzed Bosch process an invest-igation of the process using either nickel or cobalt as a catalyst could possibly yield a more efficient design. Since the water concentration of the graphite-gas equilibrium is higher than that of the iron-iron oxide-gas phase boundary, a catalyst which achieved the conversion of gases to the graphite equilibrium would have an overall lower gas recycle ratio.
2.2.1 Thermodynamics of the Ni-0 2 and Co-02 Systems
A thermodynamic analysis of the nickel-nickel oxide-gas and the cobalt-cobalt
oxide-gas equilubria can be done in the same way as the onecarried out on the iron
system by Manning (1976). Figure 2-6 shows the phase diagram for the nickel-oxygen
system. The phase diagram reveals that in going from a reducing medium to an oxi-dizing one, NiO is the oxide species of nickel which will be formed first (Bo-gatski, 1951). No Co-O phase diagram exists, however,there do exist Gibbs energy data for two different species of cobalt oxide. Figure 2-7 shows a plot of In
2000
1600
1200
800
400
10
20
30
OXYGEN,
WEIGHT
PERCENT
2-6 Nickel - Oxygen Phase Diagram
( Bogatski,1951
)
1.5
103/T ( K)
2.0
Fig 2-7 Equilibrium Constant for the
ReQaction
2Co0
3O
4--6Co0O
02(Kubaschowski,
1967 )
-15
-10
-5
2 Co304 ÷ 6 CoO + 02
The equilibrium diagram reveals that CoO is formed at a lower partial pressure of oxygen than Co304. This indicates that in going from a reducing atmosphere to an oxidizing one, CoO will be formed before Co304. In other words in
de-termining whether or not cobalt oxide will interfere with the graphite-gas equilibria, the Co-CoO-gas equilibrium must be considered. Although another species, Co203, also exists, no thermodynamic data are available. In the next paragraph, calculations show that the equilibrium line is so far re-moved from the graphite line that any small differences in Gibbs energy of
Co203 would make very little change in the phase diagram of figure 2-8.
Three reactions may then be chosen to relate the components of the equilibrium system. Ni + H20 + NiO + H2 or Co + H 20 + CoO + H2 Ni + CO2 CO + NiO or Co + CO2 - CO + CoO and 3H2 + CO = CH4 + H20
Thermodynamic data on the oxide reactions are as follows Ni + 1/2 02 < NiO
InK = 2.905xlO4/T - 2.040 InT + 3.786x10⁻³ T
- 1.425x10⁻⁶T2 + 2.486xlO1 0-10T3 Co + 1/2 02 = CoO 4 2 .3 InK = 2.786x10l/T - 1.447 lnT + 2.452x10⁻³ T P -72 -103 - 7.9;6x10⁻⁷T2 + 1.055x10 T
NICKEL OR COBALT SYSTEM CARBON PRESSURE= I ATM TEMPERATURE =800K
X
CO
CO/
CH4 2 HYDROGEN H20 OXYGENUPPER CURVE:GRAPHITE -GAS EQUILIBRIA
LOWER CURVE: METAL -METAL OXIDE-GAS EQUILIBRIA
FIG. 2-8
Phase Diagram for the !,etal-Metal Oxide-Gas Equilibria for the Nickel or Cobalt System
it was assumed that the activity of the solid phases was unity and that no solid solution existed. By setting the temperature, pressure, and C/H or O/H ratio, the phase rule has been satisfied and a phase diagram may be constructed. Figure 2-8 shows the equilibrium phase boundaries for the
graphite-gas and either the nickel oxide or cobalt oxide systems. There is essentially no difference between the oxide boundaries. The gas compo-sition necessary to cross the oxide phase boundaries is a partial pressure of water plus carbon dioxide of greater than 99%. If the phase diagrams
for other temperatures between 600 and 900K are examined it is observed that the above condition for the oxidation of both nickel cobalt still holds.
If the nickel or cobalt system is compared with the iron Bosch system, the most obvious difference is the location of the oxide equilibria. In the nickel or cobalt system the oxide phase boundary never crosses the carbon de-position boundary; it is always below it. The significance of the calculations for the nickel and cobalt systems, making the assumption that the oxide forms of nickel and cobalt, as with iron, are not catalysts for carbon deposition is that the graphite-gas equilibrium can be reached.
2.2.2 Thermodynamics of the H2-CO-CH 4- C02-H20-Carbon System
Since it has been shown in the previous section that oxides of nickel or cobalt will not interfere with the Bosch process, an equilibrium study of the carbon-gas system should indicate their advantages over an iron catalyst. Manning (1976) has shown how to calculate equilibrium gas compositons
as-suming the gas is in equilibrium with graphite. A phase rule analysis revealed that the temperature, pressure, and some elemental ratio in the gas phase must be fixed in order to define completely the system.
Equilibrium studies of previous nickel and cobalt catalized carbon (or carbide) - gas systems have been carried out. These studies have included
the methane-hydrogen-carbon (or carbide) system, the carbon monoxide-carbon dioxide-carbon (or carbide) system, and one study which examined a five-component (H2,CO,CH 4,CO2 and H20) system. The results of these studies in-dicated that the equilibrium resulted from a reaction of the gas phase species with a solid phase which might range from s-graphite to a solid phase, which included carbon, which had a Gibbs energy 7.0 kcal/mole greater than B-graphite. In other words, the investigators believed they were studying an equilibrium with B-graphite, a carbon with a Gibbs energy greater than B-graphite, or a nickel or cobalt carbide.
Dent (1945) and Rostrup-Nielsen studied both the CO-C02-C and CH4-H2-C
equilibria over nickel catalysts. Dent included in his studies measurements of some five-component gas-carbon systems. These two investigations covered the temperature range from about 600 to 1200K. Although Dent only approached the equilibrium point from the carbon depositing side, Rostrup-Nielsen claims to have observed both sides of the equilibrium point in his experiments.
The other studies discussed in this chapter involve the methane-hydrogen equilibrium. The authors claimed that the solid phase in the system was either carbon or carbide. These studies include Schenck (1927), and Browning and Emmett (1952), and covered a temperature range of 450 to about 1000K.
In this thesis, a notation common to both Dent and Rostrup-Nielsen's results is AGc , the Gibbs energy of a carbon formed in a given experimental
system, where AGc for B-graphite is equal to 0.0 kcal/mole.
AG
cG
EXPERIMENTAL CARBON--
-Go
GGRAPHITEThe equilibrium constant for a given reaction is thus related to AGc
AG = -- RT InK -- RT InK
c PEXPERIMENTAL CARBON Pý-Graphite
For the systems of interest, the equilibrium constants may be calculated using any of the three carbon deposition reactions which are applicable.
PH20 H2 + CO < C + H20, K PH
P
p H
2 PCO
2 CH44
= C + 2H2, K 22 P PCH4
PCO2 CO2 2CO C + O2, Kp 2 PCOAlthough the function AGc was defined to represent the Gibbs energy change resulting from any stuctural or compositional differences between an experimentally observed carbon and graphite, it can also be used to represent the Gibbs energy change of the carbide formation reaction
Me + CB-graphite MenCn
where Me represents either cobalt or nickel. In this case, the Gibbs energy
change of the metal-carbide-gas equilibrium CH4 + nMe - MenC + 2H2
is equal to
AG = AGc + AG graphite
where AG' is the Gibbs energy change for the decomposition of methane to
Bgraphite
CH4 2H2 + Cs-graphite
C -graphite +nMe MenC
CH4 + nMe i< MenC + 2H2
As referred to in a previous section, Sacco (1977) determined the iron-iron oxide-gas phase boundary by choosing two independent reactions and setting the temperature, pressure, and O/H ratio in the feed stream, and then varying the C/H ratio. By starting a given experimental run with a high C/H ratio and proceeding to a lower one, the point at which iron oxide first appeared was determined by the cessation of carbon deposition. In this thesis, a mathematically equivalent method was used. Three reactions were chosen, one being a carbon deposition reaction. Then the temperature, pressure, and O/H ratio were set and the Gibbs energy of the carbon deposition reaction was varied according to the equation
AGc = - RT InK + RT InK
c Pobserved Pgraphite
The variation of AGc is equivalent to changing the C/H ratio in the gas feed. Since equilibrium calculations are based on AGc , (which is assumed to be
independent of gas phase) the results obtained from a two-component gas experiment can be applied to a five-component gas system.
2.2.2.1 Dent's Study of the Carbon-Gas Equilibrium
Dent (1945) studied the catalytic synthesis of methane from carbon monoxide and hydrogen to determine the conditions necessary to obtain an adequate
catalyst life and to avoid carbon deposition, typically referred to as coking. For this, an important factor is the carbon-gas equilibrium.
To study the equilibrium system, Dent employed a column reactor at a residence time of 30s. The nickel catalyst used was prepared by adding 25
parts by weight of china clay to an aqueous solution containing 100 parts of nickel nitrate, 20 parts maonganese nitrate and 13.6 parts aluminium nitrate. The metals were then precipitated as basic carbonates or hydroxides by the addition of a solution of 97 parts potassium carbonate to the catalyst so-lution. The solution was boiled and filtered. The filter cake was then washed, dried, crushed and sieved.
Dent's first experiments involved the measurement of CO-C02-C equilibrium at temperatures between 623 and 1173K, and pressures of 1.0 and 20 atm. Figure 2-9 gives the results in graphical form for an experiment at 773K and 1.0 atm. The experiments were run by passing a carbon monoxide-carbon dioxide mixture over fresh catalyst at constant space velocity while following the reactor out-let composition with time. The compositional change with time, as shown in Figure 2-8, resulted from the catalyst area change which occurred from the deposition of carbon. Gas mixtures of 16, 15, 14, and 13% carbon monoxide were passed over the catalyst bed. Close examination of the results indicate that the outlet composition resulting from the 16 and 15% carbon monoxide mix-tures arrived at a final outlet composition of 11.5%, while the 14% mixture finished at 11.0%. The explanation of the 13% mixture's failure to react was that the CO concentration was so low so that equilibrium constrants applied. An alternate explanation is that the reaction was not allowed to proceed for a long enough time so as to allow the area of the catalyst, and hence the kinetics, to increase from the deposition of carbon. Dent argued that since different initial gas compositions all arrived at the same final composition,
11.0% carbon monoxide was the equilibrium point. Upon analyzing the data, the question arises as to the validity of "the same final composition". Figure 2-10 give his results at the other experimental conditions.
16
14
12
10
0
5
10
15
20
25
30
TIME, hours
The Decomposition
of Carbon
Monoxide over
a
(Dent,1945)
Fig.2-9
I I I
I
ystems
Nickel SvstQmsDent
a
xCO-C0
2- C
CH -H
2-C
Multi -Component
E
0 U L. UZ
LJ LUi >-0 cr uJ Z Ui 00O
700
800
900
1000
1100
TEMPERATURE (K)
Fig. 2-10
Gibbs Energy Dif
ference for
Carbons
Formed
from Various Gas Mixtures
(Dent
1945 )