READ THESE TERMS AND CONDITIONS CAREFULLY BEFORE USING THIS WEBSITE.
https://nrc-publications.canada.ca/eng/copyright
Vous avez des questions? Nous pouvons vous aider. Pour communiquer directement avec un auteur, consultez la
première page de la revue dans laquelle son article a été publié afin de trouver ses coordonnées. Si vous n’arrivez pas à les repérer, communiquez avec nous à PublicationsArchive-ArchivesPublications@nrc-cnrc.gc.ca.
Questions? Contact the NRC Publications Archive team at
PublicationsArchive-ArchivesPublications@nrc-cnrc.gc.ca. If you wish to email the authors directly, please see the first page of the publication for their contact information.
NRC Publications Archive
Archives des publications du CNRC
This publication could be one of several versions: author’s original, accepted manuscript or the publisher’s version. / La version de cette publication peut être l’une des suivantes : la version prépublication de l’auteur, la version acceptée du manuscrit ou la version de l’éditeur.
Access and use of this website and the material on it are subject to the Terms and Conditions set forth at
Kinetic analysis of effects of adsorbed S-species on H sorption into Pd from UPD and OPD H
Qian, S. Y.; Conway, B. E.; Jerkiewicz, G.
https://publications-cnrc.canada.ca/fra/droits
L’accès à ce site Web et l’utilisation de son contenu sont assujettis aux conditions présentées dans le site LISEZ CES CONDITIONS ATTENTIVEMENT AVANT D’UTILISER CE SITE WEB.
NRC Publications Record / Notice d'Archives des publications de CNRC: https://nrc-publications.canada.ca/eng/view/object/?id=2f663508-9507-4285-a982-40e876fb31ee https://publications-cnrc.canada.ca/fra/voir/objet/?id=2f663508-9507-4285-a982-40e876fb31ee
Kinetic analysis of effects of adsorbed
S-species on H sorption into Pd from UPD and
OPD H
Qian, S.Y.; Conway, B.E.; Jerkiewicz, G.
A version of this paper is published in / Une version de ce document se trouve dans : Electrochemical Society Proceedings, v. 2000-16, 2000, pp. 98-114
www.nrc.ca/irc/ircpubs
NRCC-44281
KINETIC ANALYSIS OF EFFECTS OF ADSORBED S-SPECIES ON H SORPTION INTO Pd FROM UPD AND OPD H
S. Y. Qian
Institute for Research in Construction
National Research Council of Canada, Ottawa, K1A 0R6, Canada, B. E. Conway
Chemistry Department, University of Ottawa, Ottawa, Ontario, K1N 6N5, Canada
and G. Jerkiewicz
Département de Chimie, Université de Sherbrooke, Sherbrooke, Québec, J1K 2R1, Canada
Abstract
Studies of the effects of sulfide poison on H sorption into Pd can be conducted without the complications of processes involved in cathodic H2 evolution since UPD H can be generated as the initial chemisorbed source of H below the H2 reversible potential, unlike the situation at e.g. Fe, mild-steel, Ni, Ti, etc. By means of a previously developed kinetic fitting procedure, the effects of S2- and HS- ions on the rates of individual steps in the HER under OPD conditions resulting in H sorption, are compared with the situation involving only sorption from UPD states of H, i.e. at electrode potentials positive to that of the HER reversible potential.
It is shown that the expected 1:1 ratio correspondence between the H adsorption and H permeation rates arises almost quantitatively over the UPD region for which, in both the presence and absence of sulfide species, electrodeposition of H is found to be the rate-determining step in the overall H permeation process. Over the OPD potential region, sorption of H into Pd arises both from the OPD and the UPD H.
INTRODUCTION
The effects of adsorbed catalyst poisons, such as S-, or As- containing species, are of major interest in sorption of H into transition metals, e.g. Fe, Ni, Ti and their alloys with other metals (1). Normally, the sorption arises under conditions of cathodic polarization or corrosion, although direct sorption from gas-phase H2 can arise (2) through dissociative chemisorption. In electrolytic sorption of H, the initial species is usually electrolytically deposited H (H atoms initially electrosorbed on the metal’s surface), the coverage by which can be affected, usually diminished, by coadsorption of poison species (3).
In a number of papers (45-678) it is reported that coadsorbed S- or As-containing
catalyst poisons enhance the sorption of H into e.g. Fe or Ni while contrary results indicate inhibition effects in some cases. The mechanism of these effects has remained unclear (3,8) for some years especially as it is difficult to understand how diminished coverage by adsorbed H could increase absorption into metals. Controversial views on this question have been discussed in ref. (3) and summarized by Subramanyan (8).
In two recent papers (4,9) on poison effects on electrolytic sorption of H into Fe and mild-steel, we have sought to treat the effects of coadsorbed As-, and S- species in terms of the kinetics of the adsorption and absorption processes by means of a full kinetic-fitting procedure, including the process of interfacial transfer of H into a sub-surface state (3,10) from which further transfer of H into the metal’s bulk takes place by diffusion.
Palladium and its alloys, e.g. with Ag, have played a major role in characterizing H sorption processes as the extent of H sorption can be large, up to or greater than “PdH0.6”, and the sorption kinetics can be easily followed by the procedures of Frumkin and Aladjalova (11) or Devanathan and Stachurski (12) using the bielectrode/divided-cell technique.
In the present paper, we extend these kinetic-type investigations to the study of modification of H sorption rates into Pd by S-containing species (S2-, HS-) by the “kinetic-fitting” procedure using numerical computations described in the two previous papers (4,9). The case of Pd is of special interest as sorption of H from either underpotentially-deposited (UPD) H or overpotentially-deposited (OPD) H can be separately studied depending on the potential of the electrode relative to the reversible hydrogen electrode (RHE) potential in the same solution. Then, in the case of UPD conditions, UPD H coverage can be directly determined by fast cyclic voltammetry (cf. Refs. 11,12). Under OPD conditions, The H coverage can be indirectly evaluated from the computational fitting of the kinetics of the steps of the H2-evolution reaction in relation to the directly measurable rates of H transfer and sorption into the bulk metal by means of the Devanathan-Stachurski procedure using a Pd bi-electrode.
The present conference proceedings paper is a brief version of a full paper published elsewhere (J. Hydrogen Energy).
THEORY AND TREATMENT OF RESULTS
H Electrosorption Processes
In this paper we show that H can be sorbed into Pd both from UPD H and OPD H. Respective coverages of these species are designated θH, UPD and θH, OPD in the appropriate equations.
The processes of electrochemical adsorption and absorption at, into and through Pd membranes can be represented as follows. At Pd, as at Pt, UPD of H from alkaline solution takes place as follows:
(E > ERHE) − − −⇔ + + + k MH OH k e O H M ads(UPD) 1 1 2 [1a]
When the potential becomes negative to the RHE, ERHE, overpotential deposition (OPD) of H commences according to the Volmer step of the HER:
(E < ERHE) − − − + ⇔ + +H O e MH OH M ads(OPD) 1 1 2 k k [1b]
While Eqs. [1a] and [1b] are stoichiometrically the same, the H adsorption states at Pd (or Pt), as well as their standard chemisorption energies, can be quite distinct (13), except at the reversible potential.
The electrochemical (Heyrovsky) step of desorption of HOPD, leading to H2, is represented by − − −⇔ + + + +H O e M H OH MH 2 2 2 2 ads(OPD) k k [2]
Under certain conditions, OPD H species can chemically combine to form H2 (Tafel step) but it is thermodynamically impossible for this to occur from UPD states of H. However, interfacial transfer into Pd can take place either from the UPD or the OPD H to generate absorbed H.
The experimental results, derived below, indicate that transfer of H from its UPD states (cf. Ref. 6) can take place across the Pd interface into a sub-surface state (10):
− − → + + + →
⇔
MH MH OH M H O e k kMH abs diffusion exit 2
abs des
ads(UPD) [3]
A formally similar sequence of equations applies to sorption into Pd from OPD H (MHads (OPD)), i.e. for |η| > 0, also into a sub-surface state. Step [3] is important in the overall H sorption process, and provides the source of H which enters the bulk metal and diffuses to the exit side in a bi-electrode-cell measurement.
Sorption of H in the UPD region at Pd commences at ca. + 0.4 V RHE and continues through to the H2 reversible potential. For convenience in the kinetic fitting procedure, a potential scale (V) is taken relative to that for onset of UPD of H, i.e. + 0.4 V vs RHE. Beyond, i.e. at cathodic overpotentials, the H sorbed into Pd arises from the total θH, UPD + θH, OPD which are not distinguishable in the kinetics of the sorption process at finite HER overpotentials.
For the purposes of kinetic analysis by the fitting procedure (9) we use a surface occupancy function, θH, which is the fraction of the total θH, UPD + θH, OPD that can arise from processes [1a] and [1b] that are involved in the kinetics. Formally, one could write additional rate equations in θH, UPD and θH, OPD, and respective k1 and k-1 rate constants but then the kinetic fitting procedure would be inapplicable owing to the increase of variables. The H sorption into Pd arises from the total UPD + OPD H when |η| > 0.
The rate of each step, including forward and backward directions of the reactions, corresponding to the processes in Eqs. [1]–[3], can be expressed by a series of rate equations, as respectively designated by the subscript numbers; they are:
v1 = k1(1-θH)exp[-βF(V)/RT] - k-1θHexp[(1-β)F(V)/RT] [4] v2 = k2θHexp[-βF(V)/RT] - k-2(1-θH)exp[(1-β)F(V)/RT] [5] v3 = kabsθH (Cmax - C0) - kdes C0(1-θH) [6] where k1, k2 and k-1, k-2 are the respective rate constants of the reaction steps (1 and 2), for both forward (e.g. k1) and backward (e.g. k-1) directions of the process. kabs and kdes are rate constants for step [3]. The H+H recombination step in H2 evolution (OPD conditions) is found not to be significantly involved at Pd. The β value in Eqs. [4] and [5]* is the usual barrier symmetry factor, taken the same for UPD H and OPD H processes and C0 is the concentration of H in the metal at the sub-surface lamina. Cmax is the saturation concentration for H accommodation in the interstitial sites.
The Faradaic current-density, jc, is proportional to the rate of electron consumption, r0, in the usual way and is equal to the sum of v1, v2, the latter when |η| > 0. Thus
jc/F = r0(θH, η) = v1 + v2 [7] Likewise, dθH/dt is proportional to the rate of production of MHads, r1; dθH/dt will be zero in the steady-state, so that
(q1/F)(dθH/dt) = r1(θH, η) = v1 - v2 – v3 = 0 [8] where q1 is the monolayer charge density of the UPD H species per real cm2 of the substrate surface, corresponding to θH = 1 on the sites available for H adsorption.
For the anode reaction, the permeation current, ja, is proportional to the H concentration gradient along the direction, x, normal to the entry surface; so that:
L FDC x C FD j L x a ÷ = 0/ ø ö ç è æ ∂ ∂ − = = [9]
which applies when the concentration of H at x = L is limitingly zero (Cexit = 0) where L is the thickness of the metal membrane (measured from the H-entry side) and D is the H diffusion coefficient. The permeation flux also corresponds to the rate of H entry, v3, in Eq. [6]. Thus θ θ θ H abs H des H abs k + L D + -(1 k k C = C ) max 0 [10] *
Strictly, the kinetically relevant coverage for step 2, in the HER, is θH,OPD in relation to the definition of θH given previously.
Bringing Eq. [10] into Eq. [9], the permeation current, ja, can then be calculated as: θ θ θ H H H max + ) -(1 + 1 = D L k D L k k FC j abs des abs a [11]
Carrying all the rates in Eqs. [4] – [6] into Eq. [8], the steady-state H coverage, θH, can be calculated. By fitting both the experimental currents at the cathode side (jc vs V) and the H sorption currents at the anode side (ja vs V) simultaneously to Eqs. [7] and [11], using a matrix of values of the rate constants and optimizing the fit by means of the non-linear least squares method, the kinetic parameters involved in the reaction can be obtained. The details of the procedure for the kinetic best fitting of the experimental results have been presented in detail in a previous paper (4) (q. v.) on sorption of H into iron and mild-steel, and will not be repeated here.
The Processes of H Adsorption and Absorption in the Presence of HS-; Relation to OPD of H
In the presence of HS- as the catalyst poison species in the 0.2 M NaOH solution, the electrons consumed at the electrode, and any H coverage change caused by the poison species on the Pd membrane surface, have also to be considered in the reaction.
Recent work on adsorption of sulfur species at Pt(111) (14,15) from S2- ion in solution indicates that the actual chemisorbed species derived from such ions is chemisorbed “S”. This conclusion is based (14) on ex situ Auger electron spectroscopy and core-level electron energy loss spectroscopy studies on the species derived from S 2-ion; then the chemisorption of S2- (or HS-) ions, as S, must have involved substantial charge-transfer. In the alkaline solution used (0.2 M NaOH), the concentration of HS- is much larger than that of S2- or H2S; therefore processes involving principally HS- at the electrode have to be taken into account as follows:
O H ) M ( e 2 MS k ) HS / M ( OH HS M+ −soln + − → −dl →pa ads + − + 2 [12] This is an electrosorption process involving non-continuous charge-transfer. When the potential shifts to values negative to the RHE, reductive desorption can arise (the reverse of [12]), as observed (with S-species derived from adsorbed thiourea):
− − − + + → + +2e (M) H O k M HS OH MSads 2 pd soln [13]
coupled with rapid readsorption of H at the freed M site: −
−→ +
+
+H O e MH OH
M 2 ads [14]
− −
− + → + +
+3e (M) 2H O k MH HS 2OH
MSads 2 pd ads soln [15]
In the above, kpa and kpd represent rate-constants for poison adsorption and desorption processes, respectively. In the steady-state, the coverage by adsorbed S is invariant with time, so that dθp/dt = 0; thus
kpa(1-θP) = kpdθP exp[-βFV/RT] [16] giving θP = kpa / (kpa + kpd exp[-βFV/RT]) [17] so that θP should be a function of polarization potential (V). The rate equation for the desorption of poison species is:
vp = kpdθP exp[-βFV/RT] [18] The Faradaic current-density, jc, should include the electron consumption due to the process [15] involving HS-, thus
jc/F = r0(θH, V) = v1 + v2 + 3vp [19] and the dθH/dt also has to include the rate for H readsorption (Eq. [15]) caused by desorption of poison species (rate vp), so that
(q1/F)(dθH/dt) = r1(θH, V) = v1 - v2 - v3 + vp = 0 [20] θH can be calculated by carrying all the rates that appear in Eqs. [4]-[6] into Eq [20]. Then both the experimental currents at the cathode and anode sides can be fitted simultaneously to Eqs. [11] and [19] by means of the non-linear least squares method, enabling the kinetic parameters involved in the reaction in the presence of HS- to be evaluated in a way similar to that in ref. (4).
In the presence of poison species, the modification of the rate constants due to induced heterogeneity caused by communal interactions between the adsorbed P and H atoms also has to be taken into account.
EXPERIMENTAL
Electrochemical Measurements and Data Acquisition
The electrochemical permeation measurements of H adsorption and permeation were based on the procedure of Frumkin and Aladjalova (11) and Devanathan and Stachurski (12), using two, three-compartment electrochemical cells with a common, metal membrane bi-electrode as the working electrode. Experiments were conducted at 298 K. On all figures in this paper, the potentials are versus RHE and, except for cyclic voltammograms, have been corrected for IR-drop.
Membrane and Electrodes
The Pd membrane (Aesar Puratronic 99.98% (metals basis)), 0.1 mm in thickness, was annealed in vacuum at ~ 700 oC for 3 h, then cooled down within the furnace to room temperature. The membrane was polished by #2400 silicon carbide paper and then cleaned in an ultrasonication bath, first with acetone then Millipore water. Before H permeation experiments were conducted, the cathodic side of the Pd membrane was cycled between 0.2 and 1.5V vs RHE until sharp peaks for reduction of previously formed surface oxide at Pd, and a “flat” double-layer charging region were observed.
Solution and Gases
The electrolyte solution was 0.2 M NaOH (BDH, Aristar grade) made up in 18.2 MΩ⋅cm Millipore water. H2 and N2 gases used for bubbling in the cell compartments for removal of dissolved oxygen were purified, especially deoxygenated. HS- ions at 8.8 x 10⁻⁴ M were introduced as the P species into the 0.2 M NaOH solution in the cathode cell from Na2S of 99.9% purity (taking into consideration the equilibrium constants for the two stages of ionization of H2S and the pH of the 0.2 M NaOH solution).
RESULTS AND DISCUSSION
Cyclic Voltammetry at Pd in the Presence of HS
-As with Pt electrodes, cyclic voltammetry at Pd exhibits a well defined, quasi-irreversible surface oxide formation/reduction region and an almost reversible region corresponding to the UPD of H (observable at very thin electrodes and/or at high sweep-rates (16)). However, the current associated with the UPD process is additively increased by that arising from H sorption into the metal lattice.
Comparison of the cyclic voltammograms for Pd electrodes in the poison-free (Fig.1, line 1) and HS--containing 0.2 M NaOH (Fig. 1, line 2) clearly shows that UPD of H on the Pd surface and subsequent H sorption, is largely suppressed by the adsorbed S species (Eq. [12]). When the potential scan in the positive-going direction reaches ca. 1.1 V, currents due to the oxidative desorption of the chemisorbed S species and to Pd surface oxidation arise.
When the upper reversal potential limit has been changed to 0.55 V with the lower one kept at 0.05 V, the fractional poison coverage on the Pd surface increases, approaching unity. The currents for the coupled H adsorption and absorption processes are largely suppressed over the H UPD range (see Fig. 1, curve 3). Sulfide poison adsorption and desorption is slow so steady-state experiments required each potential to be held for about 1200-1400 s.
Fitting of the Data for the Processes of H UPD and H Permeation
Unlike the situation (4,8) at Fe, mild-steel and Ni, where UPD of H seems thermodynamically possible but is obscured by onset of surface oxidation near the RHE potential, sorption from UPD states of H can be controllably observed and studied at Pd; it is coupled with adsorption of UPD H species (12).
The steady-state H adsorption (absorption) and the H permeation currents in the UPD region were recorded simultaneously at the Pd membrane bi-electrodes and plotted comparatively on a log scale for the Pd electrode in the presence and absence of 8.8 x 10⁻⁴ M HS- as shown in Fig. 2; symbols are defined in the caption. The currents in the presence of HS- are significantly smaller than those for the poison-free solution, as the cyclic voltammograms in Fig. 1 also show. Clearly, chemisorbed HS- blocks surface sites otherwise available for binding of H and thus diminishes the H adsorption and resulting absorption. The permeation currents commence at around 0.4 V vs RHE then gradually increase as the positive potential decreases, eventually approaching the cathodic H adsorption currents corresponding to virtually all of the UPD H being absorbed into the Pd lattice and diffusing to the anode side, then becoming oxidized. Recall that consumption of MHads through reaction [2] cannot arise at UPD potentials.
The H adsorption and the H permeation currents for the Pd electrode in the 0.2 M NaOH aqueous solution were fitted to the Eqs. [7], [8] and [11], while for the currents arising in the presence of HS-, Eqs. [19], [20] and [11] [with the exponential terms βg(θH + θP), cf. Ref. 9] were used, employing the non-linear least-squares method.
In both the absence and presence of sulfide poison (P), the H adsorption currents around 0.4 V are bent towards larger values (Fig. 2) which makes satisfactory fitting difficult. This effect could be due to currents (~10-7 A cm-2) for reduction of traces of oxygen (v4) which, when allowed for, lead to the good kinetic-fitting results shown in Fig. 2.
The kinetic parameters and rate constants that result from this procedure for the Pd electrodes in the poison-free and HS--containing solutions show that the rate constant of the H adsorption step, k1, becomes reduced and that for its back-reaction step, k-1, becomes increased by P. The equilibrium constant for H adsorption, K = k1/k-1, becomes reduced from 1x10⁻³ to 6x10⁻⁵ in the presence of HS-, corresponding to θH being diminished by S adsorption (see following discussion).
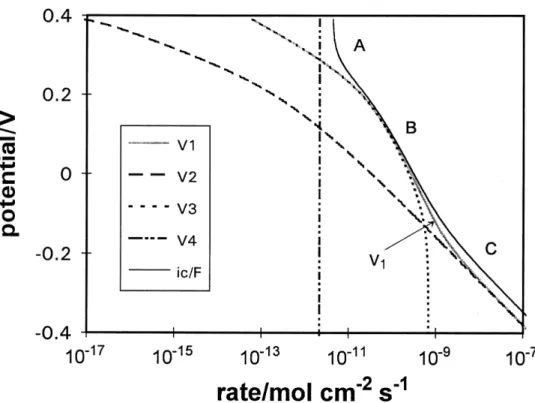
Fig. 3 shows the rates of H adsorption (absorption) processes and of each individual step calculated from the fitting parameters for Pd electrodes in the poison-free, 0.2M aqueous NaOH solution. Three regions of the cathodic behavior can be distinguished: in region A, at the most positive potentials (0.4 - 0.3 V), the H adsorption rate, v1, and the H permeation rate, v3, increase in the same way. The H desorption rate, v2, is much smaller (by about 1000 times, as expected) than the rates of all other steps (Fig.3). In region B, the H adsorption and permeation rates still increase in a parallel way. The cathodic current is almost entirely contributed by the v1 UPD rate since no H2 evolution can arise. An important conclusion is that UPD H, despite its adsorption energies at low θH being large and comparable with that for chemisorption of H from the
gas phase, can easily become sorbed into Pd through its interface; thus H sorption does not require overpotential-deposition of the H intermediate in the HER. In region C, the potential is in the OPD region and sorption arises from the total θH which is approaching its full value; therefore the H permeation rate (v3) also approaches a limiting value. Then the H adsorption (rate v1) and desorption (rate v2) steps on the electrode surface become dominant in the overall cathodic reaction under OPD conditions.
Fig. 4 shows the rate of the H adsorption and permeation processes, and the rates of each individual step calculated from the fitting parameters for Pd electrodes in the presence of the HS- poison species. In region A, the overall reaction is dominated by the reductive desorption of poison species and influenced a little by reduction of any remaining traces of O2. When the potential shifts to more negative values, the θp becomes decreased; then the dominant steps are similar to those for the poison-free case. An important effect, brought about by the P species, is that the potential for θH→ 1 is shifted towards more negative values (see the v3 line in Figs. 3 and 4).
It is important to note that the H adsorption rate, v1, and the H permeation rate, v3, are almost exactly in the same ratio over the UPD potential region in both the absence (Fig. 3) and presence (Fig. 4) of the poison species. The 1:1 correspondence between the H adsorption and H permeation rates indicates that the rate of transfer of H inside the metal is not the process limiting the rate of steady-state diffusion of H through the membrane, but it is directly related to the kinetics of the H entry at the polarization side determined by the rate-constant, k1, for H UP deposition. Comparing the rate constant for H adsorption (reaction [1]), k1, with the rate constant of the H absorption, kabs, it is found that k1 is 4 orders smaller than kabs. Therefore H adsorption is the rate-determining step.
Relation Between C0, θH and the H Permeation Current-Density, ja
According to Eq. [9], the H permeation current-density, ja, should be proportional to the sub-surface H concentration, C0, (Eq. [6] and ref. (10)), as emphasized in our previous paper (9). C0, given by Eq. [21]:
abs diff des abs max 0 v v v v + + = C C [21]
is determined by the ratio of the rate of H absorption, vabs, to the sum of the rates of H desorption, vdes, H diffusion, vdiff and H absorption, vabs. Each of these terms can be calculated using the parameters obtained from the fitting procedure together with the values of θH and θp, over the potential range V= 0.4 to -0.4V (not considering any possible effects of “Pd-H” phase change). Figs. 5 and 6 show these terms for Pd electrodes in the absence and presence of HS- species, respectively. vabs is much smaller than vdiff or vdes over all the potential range, and hence can be neglected in the denominator of the Eq. [21]. Since vdes is larger than vdiff over the more positive potential region, it therefore dominates the denominator, so that C0 ≅Cmax vabs/vdes. Consequently, ja is proportional to θH (1-θH)-1 with change of potential in the absence of poison species, while it is proportional to θH (1-θH -θP)-1 in the presence of poison [cf. Eq.
[6c] in ref. (9)]. From Figs. 5 and 6, it is seen that the curves for θH (1-θH)-1 (in the absence of poison) and θH (1-θH -θP)-1 (in its presence) coincide well with curve ja (the value of ja being divided by FD/L) in the positive potential range. When the potential goes further negative, vdes become smaller; then both vdes and vdiff become dominant in the denominator of Eq. [21], so that
diff des abs max 0 v v v + ≅ C C .
The H diffusion coefficient, D, in Pd is 2.8 x10⁻⁷ cm2 s-1, much smaller than that in Fe (4.5 x 10⁻⁵ cm2 s-1). Thus, the vdiff is much smaller than vdes in the Pd electrode (vdiff = 2.8 x 10⁻⁵ cm2 s-1) over the more positive potential region and can become relatively negligible when vdes is larger. For the Fe electrode (see ref. (9)) the vdiff is much larger (vdiff =9 x 10⁻⁴ cm2 s-1) than that in the Pd electrode and hence dominates the denominator of Eq. [21] in the presence of poison species where the vdes become reduced by the chemisorption of the latter (vdes = 1.3 x 10⁻⁸ cm2 s-1 in the presence of AsO2- in ref. (9)).
In relation to potential of the Pd electrodes, Fig. 7 shows that C0 in the presence of HS- is smaller over the less negative potential range because of the effect of P. However, as the potential becomes decreased, C0 in the presence of P rapidly increases and then surpasses its values without HS- present. This causes the H permeation current to be correspondingly enhanced at appreciable negative overpotentials where the adsorbed poison has become progressively desorbed from the surface, as was observed at Fe and mild-steel electrodes over the OPD H region in our previous work (4,9).
θH values in relation to the potential, with and without HS- present, were calculated from the kinetic-fitting procedure as shown in Fig. 8. In the poison-free solution, θH increases with |η|, then approaches a limiting value at a potential slightly negative to 0 V (this is expected for UPD of H). In the presence of HS-, θH increases at a much slower rate due to the poison effect. The H coverage fraction attains a value of only 0.3 at 0 V (the reversible potential), while in the poison-free solution, θH already reaches 0.9 at that potential.
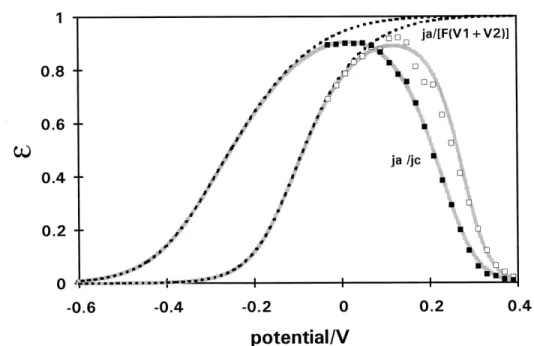
H Permeation Efficiency
The efficiency (ε) of H entry and permeation is calculated as: ε = ja / jc, where ja is the permeation current-density and jc is the cathodic polarization current-density leading to UPD of H or further H deposition (OPD) forming H2. ε values at Pd electrodes in the absence and presence of HS- are shown in Fig. 9 and increase with more negative potential in the UPD region until they reach a maximum value at about 0.1 V RHE in the poison-free solution and at ~ 0 V in the presence of P. Then ε decreases with more negative potential, exponentially in both cases.
Pseudocapacitance and H Coverage
The adsorption pseudocapacitance Cφ, as a function of potential, provides a means for evaluation the H coverage as a function of potential. The adsorption pseudocapacitance is
defined as the product of the charge-density for monolayer coverage, q1, and the derivative of coverage with potential:
(
d dV)
q
Cφ =− 1 θH/ [22]
as has been treated elsewhere. Here the steady-state value of θH is obtained by setting the rate of production of MHads, r1, equal to zero at any dc potential and solving for θH as a function of potential (17). From Fig. 8, the θH vs V relation, the steady-state dθH /dV at the Pd electrode in the absence and the presence of P can be calculated. Therefore Cφ in relation to potential can be obtained using Eq. [22] as shown in Fig. 10. It can be seen that the peak pseudocapacitance is shifted to more negative potentials in the presence of P species. The values of Cφ are also significantly reduced over the H UPD region because of the competitive adsorption between the P and H.
CONCLUSIONS
Electrochemical sorption of H into Pd is shown to take place both from the UPD and OPD states of bound H, the former in spite of its substantially stronger bond strength of chemisorption to the metal surface.
The UPD coverage by H, on a Pd electrode surface is largely suppressed by the adsorption of HS- from an aqueous NaOH solution, but the resulting chemisorbed S species can be oxidatively desorbed by cycling the potential to relatively high positive values.
A kinetically-treated model for both UPD and OPD of H in the presence and absence of adsorbed sulfide poison satisfactorily represents the H adsorption and permeation behavior at a Pd electrode in 0.2 M aqueous NaOH solution. The H adsorption and the H permeation rates have a 1:1 ratio in the UPD region, both in the absence and presence of poison in solution.
A 100% permeation efficiency, ε, arises at the Pd surface in the H UPD region, as may be intuitively expected. However, at cathodic overpotentials, i.e. into the H OPD region, ε decreases exponentially because the H permeation current reaches its limiting value, but the HER current continues to increase exponentially.
ACKNOWLEDGMENTS
Grateful acknowledgment is made to the Governments of Ontario and Québec for support of this work on an Ontario/Québec program to promote cooperative research between universities in these two Provinces. Grant support from the Natural Science and Engineering Research Council of Canada is also acknowledged.
REFERENCES
1 M. Smialowski, “Hydrogen in Steel”, Pergamon Press (1962).
2 F. A. Lewis, “The Hydrogen-Palladium System”, Academic Press, New York (1967).
3 B. E. Conway and G. Jerkiewicz, J. Electroanal. Chem., 357, 47 (1993); see also G. Jerkiewicz, J. J. Borodzinski, W. Chrzanowski and B. E. Conway, J.
Electrochem. Soc., 142, 3755 (1995).
4 S. Y. Qian, B. E. Conway and G. Jerkiewicz, J. Chem. Soc., Faraday Trans., 94, 2945 (1998).
5 R. D. McCright and R. W. Staehle, J. Electrochem. Soc., 121, 609 (1974). 6 J. McBreen, J. Electroanal. Chem., 287, 279 (1990).
7 G. Zheng, B. N. Popov and R. E. White, J. Electrochem. Soc., 141, 1526 (1994). 8 P. K. Subramanyan, in Comprehensive Treatise of Electrochemistry, J. O’M.
Bockris, B. E. Conway, E. Yeager and R. E. White, Editors, vol. 4, p. 435, Plenum, New York (1980).
9 S. Y. Qian, B. E. Conway and G. Jerkiewicz, PCCP (Incorporating Faraday Transactions), 11, 2805 (1999).
10 A. Lasia and D. Grégoire, J. Electrochem. Soc., 142, 3395 (1995). 11 A. Frumkin and N. Aladjalova, Acta Physicochim. URSS, 19, 1 (1944). 12 M. A. V. Devanathan and Z. Stachurski, Proc. Roy. Soc., London, A270,
90 (1962).
13 G. Jerkiewicz and A. Zolfaghari, J. Electrochem. Soc., 143, 1240 (1996).
14 Y. –E. Sung, W. Chrzanowski, A. Zolfaghari, G. Jerkiewicz and A. Wiechowski, J. Amer. Chem. Soc., 119, 194 (1997).
15 Y. –E. Sung, W. Chrzanowski, A. Wiechowski, A. Zolfaghari, S. Blais and G. Jerkiewicz, Electrochim. Acta, 44, 1019 (1998).
16 M. Baldauf and D. M. Kolb, Electrochim. Acta, 38, 2145 (1993).
Fig. 1 Cyclic voltammograms of Pd electrodes in 0.2 M aqueous NaOH solution (line 1) and in the presence of 8.8 x 10⁻⁴ M HS- (lines 2 and 3). Scan-rate, 50 mV s-1, T=298 K.
Fig. 2 The current-density at polarization side (jc, o, n) and H permeation current-density (ja, ¡, l) recorded simultaneously at the Pd electrode in 0.2 M aqueous NaOH solution (open symbols) and in the presence of 8.8 x 10⁻⁴ M HS- (filled symbols). The solid lines represent the behavior derived from the fitting model.
Fig. 3 The individual reaction rates, calculated from the parameters derived from the fitting of the experimental results for an Pd electrode in 0.2 M aqueous NaOH solution.
Fig. 4 The individual reaction rates, calculated from the parameters derived from the fitting of the experimental results for an Pd electrode in 0.2 M aqueous NaOH solution in the presence of 8.8 x 10⁻⁴ M HS-.
Fig. 5 The individual rates, calculated from the parameters derived from the fitting of the experimental results for an Pd electrode in 0.2 M aqueous NaOH solution.
Fig. 6 The individual rates, calculated from the parameters derived from the fitting of the experimental results for an Pd electrode in 0.2 M aqueous NaOH solution in the presence of 8.8 x 10⁻⁴ M HS-.
Fig. 7 The H concentration, C0, calculated from the parameters obtained from the fitting procedure for an Pd electrode in the 0.2 M aqueous NaOH solution in the presence and absence of poison species.
Fig. 8 The relationship of θH and θp to overpotential in the presence and absence of poison species, using rate constants derived from the fitting of experimental results in Fig. 1 for a Pd electrode in 0.2 M aqueous NaOH solution.
Fig. 9 The H permeation efficiency vs. potential relation for a Pd electrode in 0.2 M aqueous NaOH solution in the presence (n) and absence (o) of HS- species. The symbols are the experimental results. The solid and dashed lines are calculated from parameters derived from the kinetic fitting procedure.
Fig. 10 The psuedocapacitance vs potential relation for Pd electrodes in 0.2 M aqueous NaOH solution in the presence (●) and absence (o) of HS- species; The solid lines are calculated from the H coverage data obtained from the kinetic fitting procedure. The symbols represent the results obtained from a.c. impedance measurements, described elsewhere.