Characterization of a Hot Cathode Helimak
Plasma
by
Dexter FitzGeoffreys Beals
B.S. Mechanical Engineering, (1991)
Submitted to the Department of Electrical Engineering and Computer
Science
in partial fulfillment of the requirements for the degree of
Master of Science in Electrical Engineering
at the
MASSACHUSETTS INSTITUTE OF TECHNOLOGY
May 1994
@
Massachusetts Institute of Technology 1994. All rights reserved.
A u th or ...
...
...
Department of Electrical Engineering and Computer Science
May 1994
C ertified by ... ...
.
...
Prof. Ronald R. Parker
Director MIT Plasma Fusion Center
Thesis Supervisor
Accepted by...
....
...
Leonard A. Gould
Chairman, Departmental Committee on Graduate Students
Characterization of a Hot Cathode Helimak Plasma
by
Dexter FitzGeoffreys Beals
Submitted to the Department of Electrical Engineering and Computer Science on May 1994, in partial fulfillment of the
requirements for the degree of Master of Science in Electrical Engineering
Abstract
Electron beam plasmas have been generated using LaBs hot cathode emitters in the Versatile Toroidal Facility (VTF) at the MIT Plasma Fusion Center. Measurements from both a horizontal scanning langmuir probe at the midplane, and a vertical, top mounted scanning langmuir probe have been used to measure electron temperature and ion density in the electron beam plasma. These measurements as well as the total emitted current have been used to optimize the operating conditions for the generation of e-beam plasmas in VTF. The optimization has shown that the thirty-two kilowatt plasma has a maximum Te of 5 eV across the mid-radius, varying little with height from the midplane to the chamber top. The maximum ion density ni is 3x10¹⁷m- 3 at R=105 cm radius, varying with height to 1.5x10⁷m- 3 at the chamber top. The
plasma conditions are strongly dependent on neutral H2 fill pressure, magnetic field strength, magnetic field helix angle, cathode temperature, and cathode voltage. Thesis Supervisor: Prof. Ronald R. Parker
Acknowledgments
I am both fortunate and grateful to have had the opportunity to pursue graduate studies at MIT. Compiling an exhaustive list of those who supported, guided, en-couraged, motivated and otherwise aided and abetted my efforts to perpetrate this thesis would prove nearly as taxing as the actual thesis itself.
I would like to acknowledge however, the support of my fellow students at VTF most notably Randy West, Dan Moriarty, and J. Chris Rost. Despite my occasional bouts of stupidity and bullheadedness, their support was unfailing and critical to the near timely completion of this thesis.
Thanks also to Dave Gwinn who provided support, sensible advice and assistance almost before I asked.
Contents
1 Introduction
1.1 Overview . . . . . 1.2 Thesis Outline . . . . .. 2 Versatile Toroidal Facility Overview
2.1 Magnetic Field Coils ...
2.1.1 Control and Data Acquisition ....
2.1.2 Magnet Power Supply Capabilities 2.1.3 Field Configurations ...
2.2 Lanthanum Hexaboride Emitters . . . . 2.2.1 Mechanical Design ...
2.2.2 Filament and Arc Power Supplies and 2.2.3 Temperature vs. Voltage ...
2.3 Langmuir Probes ...
2.3.1 Top Langmuir Probe ... 2.3.2 Side Langmuir Probe ... 2.4 Target Plate ... 9 . . . . 10 . . . . 10 . . . . 11 . . . . 11 . . . . 11 . . . . 12 Fault Protection . . . . 12 . . . . 14 . . . . 14 . . . . 16 . . . . 16 . . . . 17 3 Theory of Operation 3.1 Hot Cathode Emitters ... 3.2 Langmuir Probes In VTF ... 3.2.1 Radial Scanning Langmuir Probe (Side Probe) . . 3.2.2 Vertically Scanning Langmuir Probe (Top Probe) 18 . . . . . 18
. . . . . 19
. . . . . 20
3.3 Energy Confinement Time ... 3.4 Radial Power Loss ... 4 Procedure And Results
4.1 Optimization of Operating Parameters . . . . 4.1.1 Pressure Variation ...
4.1.2 Magnetic Field Helix Angle . . . . 4.1.3 Magnetic Field Magnitude Variation . . . . 4.1.4 Cathode Bias Voltage Variation . . . . 4.1.5 Cathode Temperature Variation . . . . 4.2 Langmuir Probe Measurements . . . . 4.2.1 Radial Langmuir Probe Measurements . . . . 4.2.2 Vertical Langmuir Probe Measurements . . . . 4.2.3 Two Cathodes v.s. One Cathode . . . . 5 Summary of Results
5.1 Plasma Electron Temperature . . . 5.2 Plasma Ion Density ...
5.3 Emitted Current ... 5.4 Energy Confinement Time ... 5.5 Power Loss ...
5.6 Conclusions and Recommendations
22 22 23 26 26 30 30 30 35 38 43 45 45 45 . . . . . 45 . . . . . 46 . . . . . 46 . . . . . 47
List of Figures
2-1 VTF Lanthanum Hexaboride Hot Cathode Emitter Assembly .... 13
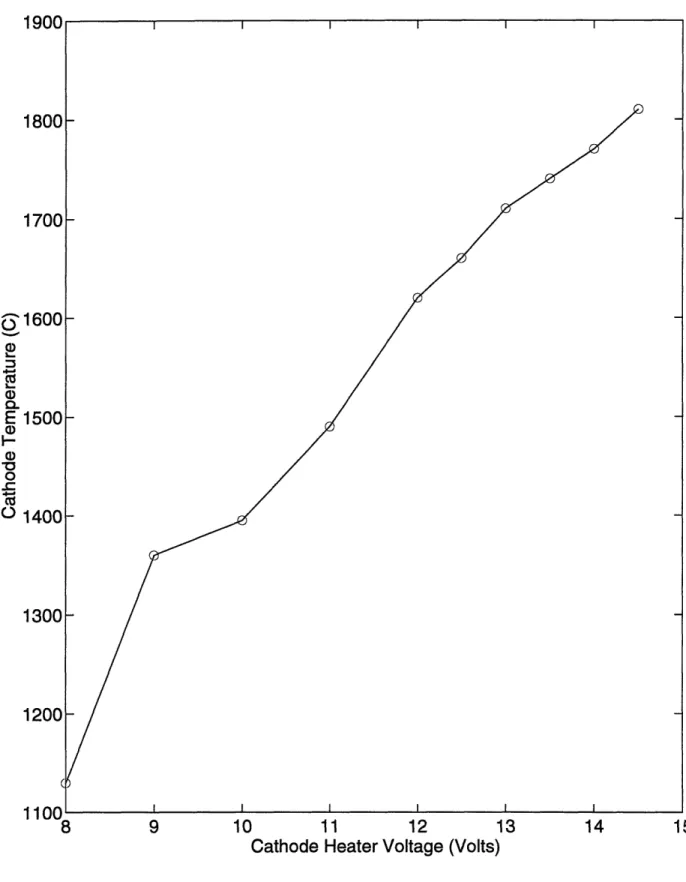
2-2 Cathode Temperature v.s. Voltage Across the Copper Posts .... . 15
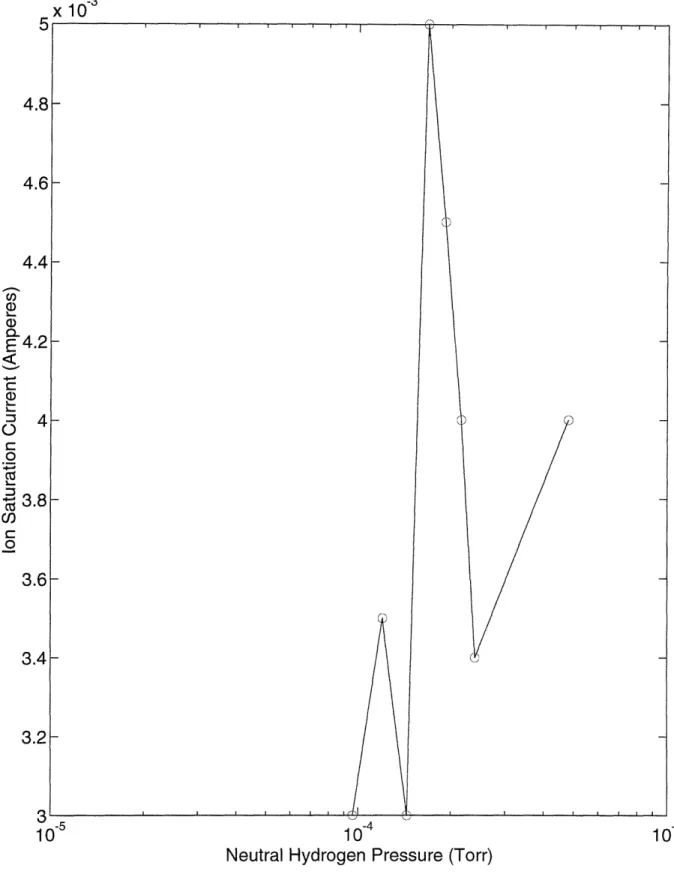
4-1 Ion Saturation Current v.s. Neutral Hydrogen Pressure ... 24
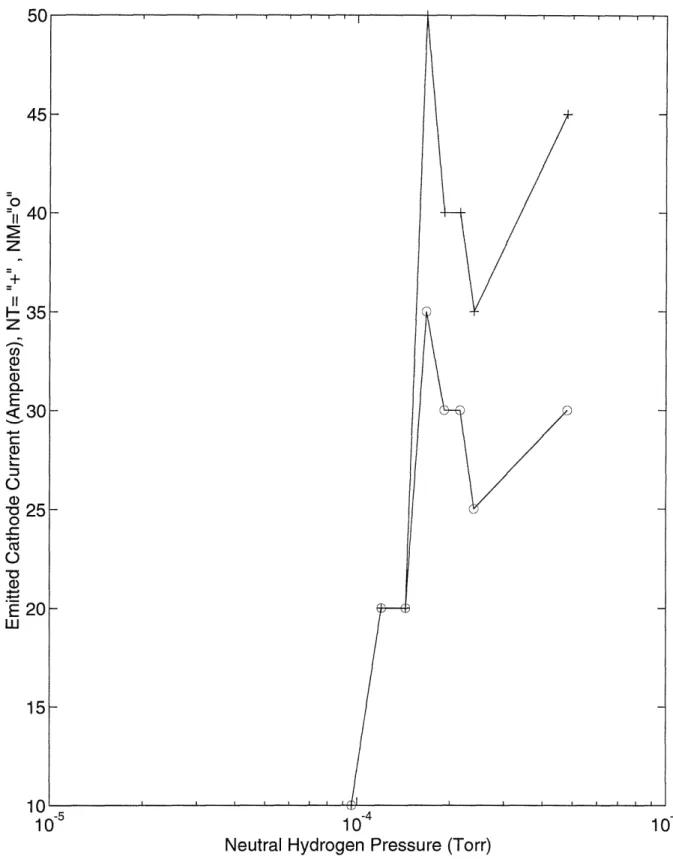
4-2 Emitted Cathode Current v.s. Hydrogen Pressure . ... 25
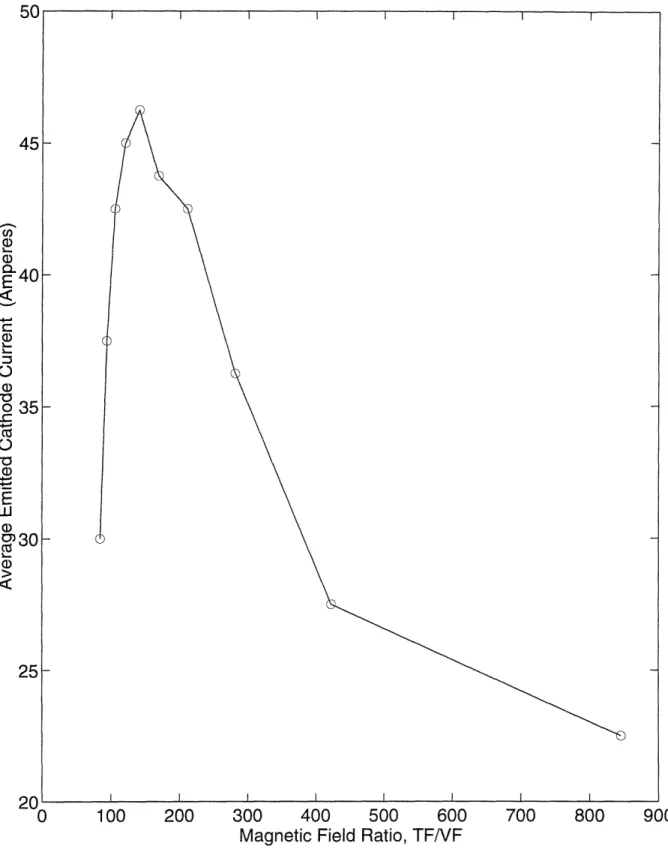
4-3 Cathode Emission Current v.s. Field Ratio,- TF/VF . ... 27
4-4 Ion Saturation Current v.s. B Field Magnitude . ... . . . 28
4-5 Cathode Emitted Currents v.s. B Field Magnitude . ... 29
4-6 Vertical Probe Ion Saturation Current (Z=20 cm) v.s. Cathode Bias Voltage . . . .. . 31
4-7 Cathode Emission Current v.s. Cathode Bias Voltage ... 32
4-8 Langmuir Probe Ion Saturation Current v.s. Cathode Temperature 33 4-9 Cathode Emitted Current v.s. Cathode Temperature . ... 34
4-10 Plasma Floating Potential at the Midplane v.s. Major Radius . . . . 36
4-11 Plasma Ion Density at the Midplane v.s. Major Radius ... 37
4-12 Plasma Langmuir Probe I-V Curve at the Midplane . ... 39
4-13 In(I - Isat) v.s. V, along with a first order least square fitted line, where the Electron Temperature is the inverse slope, Te = = 3.8eV 40 4-14 Plasma Floating Potential v.s. Distance from the Midplane ... 41
4-15 Plasma Density v.s. Distance from the Midplane . ... 42 4-16 Plot of In(I - Ist) along with a first order least-squares fitted line,
Chapter 1
Introduction
The next generation of fusion machines will require divertor materials capable of withstanding power fluxes of the order of 1000 -. At the MIT Plasma Fusion center, the Versatile Toroidal Facility (VTF) has been configured to simulate the plasma and magnetic field configuration in a tokamak divertor region; i.e. a ground plane at the end of an open magnetic field line plasma. This configuration has been dubbed a Helimak due to the helical nature of the magnetic field lines. Experiments have been performed to simulate divertor regions but VTF is one of the first to do so in a more realistic toroidal geometry. Whether the VTF machine can produce plasma with the high temperature and density necessary to provide a realistic simulation is of great interest to those researchers involved in divertor design.
1.1
Overview
In the VTF plasma machine, plasma parameters vary both along the magnetic field lines (helically, around the torus) and along the radius. Plasma parameters also vary strongly as a function of magnetic field configuration, neutral gas fill pressure, vacuum impurity levels, emitter bias voltage, emitter temperature and the number of emitters operating. Using a radial scanning langmuir probe mounted at the midplane, and a vertically scanning langmuir probe mounted at the top of the chamber at mid radius, the plasma electron temperature and ion density can be measured as a function of
position. By using the probe measurements as well as the total emitted current as a crude measure of the plasma properties, the machine operating parameters can be varied to find both an optimum operating point in terms of high plasma temperature and density, and to empirically understand the functionality between the parameter settings and the plasma characteristics.
1.2
Thesis Outline
Chapter two describes the VTF machine, the lanthanum hexaboride electron emit-ters, and the probe apparatus used to measure the plasma. Chapter three describes the relevant probe theory as it applies in the VTF machine, and the theory of hot cathode emitters. Chapter four describes the experimental procedure used to vary the operating parameters of the VTF and shows the results of the parameter scans, as well as floating potential, ion density, and electron temperature measurements from both the radial scanning probe, and the vertical scanning probe. Chapter five contains the analysis of results, and recommendations for further study.
Chapter 2
Versatile Toroidal Facility
Overview
The Versatile Toroidal Facility (VTF) is located at the M.I.T Plasma Fusion Center. The VTF machine consists of a toroidal, rectangular cross section, 5.4 m3 stainless steel vacuum chamber surrounded by eighteen toroidal field (TF) coils. The outer radius of the VTF chamber is 126 cm, the inner radius is 60 cm, and the height is 105 cm. There are two vertical field coils, upper and lower, located at the outer radius of the chamber. Inner and outer torque cylinders support the TF coils and vacuum chamber against the Lorentz loads. The VTF machine is capable of tokamak oper-ation in that an ohmic heating coil and equilibrium field coils are present, although they are not used as such.
The VTF chamber is evacuated by a 500 1/s turbomolecular pump. The typical base pressure is 3x10- 7 Torr, with major residual gas analyzer impurity peaks of mass 18 (H20 ) at a partial pressure of 7x10- 8 Torr, and mass 28 (N2) at 2x10- 8 Torr. All other partial pressures are the 10- 9 range or less. The H2 neutral pressure
is controlled by a commercial pressure regulator, and pressure is monitored using nude type Bayard-Alpert ionization gauges calibrated for N2.
Within the VTF chamber, there are two Lanthanum Hexaboride (LaB6) electron emitters located on the chamber floor, 180 degrees apart. The emitters are mounted on aluminum ports which are displaced outwards by 10 cm from mid- radius between
the chamber walls. The emitters, each having a total LaB6 area of 91 cm2, are heated to temperatures in the 1000 - 1600 C range, and biased at voltages ranging from 150 to 400 volts with respect to the stainless steel chamber. The emitted electrons follow the magnetic field lines and spiral upwards ionizing the neutral H2 fill gas and creating a plasma.
2.1
Magnetic Field Coils
Eighteen toroidal field coil units of four turns each generate the VTF toroidal field. The copper coils are rectangular in cross section, having outside dimensions of 1.35 m wide by 1.68 m tall. The coils are equally spaced at 20 degree intervals. The seventy-two turns generate a calculated on-axis (R= m) toroidal field of approximately 144 gauss/kA, which varies inversely with major radius.
The vertical field (VF) coil set consists of two circular coils of two turns each, equally spaced above and below the vacuum chamber. The coils are 3.83 m in diam-eter, and are equally spaced 0.82 m above and below the midplane of the machine. The on-axis field resulting from this coil configuration can be calculated using the following formula for a single coil of N turns [2].
,aoNIa2
B
=
(2.1)
z
2(a
2 + z2)3/2Where yo is the permittivity of free space, N is the number of turns, I is the current,
a is the coil radius, and z is the on-axis distance from the coil. Using N=2, a=1.92,
and z=0.82, as well as the fact that there are two coils, the vertical field coils generate a calculated on-axis field of 10.22 gauss/kA.
2.1.1
Control and Data Acquisition
The VTF machine uses two separate systems for control and data acquisition. An Allen-Bradley Programmable Logic Controller (PLC) interfaced with Paragon 1 user interface software controls all timing and sequencing tasks, as well as machine area
access control, voltage and current programming and some slow time scale (100 ms) data aquisition such as residual gas analysis trend data.
All fast time scale data acquisition tasks are performed using two separate CA-MAC crates with Lecroy model 8212 data loggers. One crate logs all "Engineering" data such as power supply currents and voltages at a 200 Hz sampling rate. A second crate logs all "physics" data such as probe voltages and currents at sampling rates up to 14 KHz. All of the probe data used was sampled at a 1 khz sampling rate.
2.1.2
Magnet Power Supply Capabilities
The TF coils are driven by four six-pulse, three phase power supplies, each capable of driving up to 7 kA each, thus producing a maximum current of 28 kA, and a maximum calculated TF field of 4 kGauss.
The VF field coils are driven by one power supply capable of a maximum current of 2.8 kA, producing a maximum on-axis vertical field of 28.6 Gauss.
2.1.3
Field Configurations
By varying the ratio of vertical field to toroidal field, the pitch angle of the helix can be varied. The angle from the horizontal of the helix can be found as:
0 = Tan- 1 (B) (2.2)
(BT
Where By and BT are the vertical and toroidal field magnitudes respectively. Typical angles are in the range 0.270 to 0.540.
2.2
Lanthanum Hexaboride Emitters
The emitters used in VTF are constructed using Lanthanum Hexaboride (LaB6), a thermionic emitter material characterized by a high emission density. LaB6 has been extensively researched, [1] [7] [4] [6] and has been found to have emission current densities ranging from 20 to 50 A/cm2, more than an order of magnitude higher than
other common emitter materials such as tantalum or tungsten. Since the LaB6 must be heated to temperatures of 1200 C or higher, but has a fairly low resistivity, it was required that the lanthanum be heated externally, rather than directly by I2R heating. The emitter mechanical design used is outlined in the following section, 2.2.1.
2.2.1
Mechanical Design
The LaB6 emitters used in VTF are constructed of sixteen, 1.91 cm diameter by 0.95 cm wide rings of LaB6 slipped over a 0.95 cm diameter carbon rod. The carbon rod is connected to carbon endplates via a snug fitting socket joint which allows axial expansion of the rod while maintaining a good electrical contact. The endplates are bolted to copper plates which are in turn connected to copper current feedthroughs. The copper feedthroughs pass through an aluminum port cover, to the outside current inputs. The feedthroughs are cooled by constant flow deionized water.
In operation, heater voltage is applied to the copper feedthroughs, heating the carbon rod which in turn heats the LaB6 rings. The entire emitter assembly is then biased with respect to the vacuum chamber. The emitter assembly is shown in figure 2-1.
2.2.2 Filament and Arc Power Supplies and Fault Protection
The power required to heat and bias each cathode is supplied by the "Filament" and "Arc" supplies respectively. Thus for each cathode, a pair of power supplies is required. Each pair of supplies is contained within a single physical cabinet, anddesignated by "North Top" (NT) and "North Middle" (NM).
The filament supplies generate the current required to heat the LaB6 emitters. In their present configuration, the supplies are voltage regulated, and typically supply currents of 425 amperes at 10 volts. The emitters thus dissipate approximately 4.25 kW in steady state.
The arc supplies provide the bias power to the emitters. These supplies are capable of supplying currents of up to 1200 amperes, and a maximum voltage of 375 volts.
---- a
6.03
x Cu Posts, 5.08 Dia.
\Water Cooling Passage
Note: Drawing not to scale All dimensions in centimeters
Typically, the emitters operate at loaded voltages ranging from 100 to 250 volts, and currents ranging from 20 to 150 amperes. Therefore, the emitted power into the plasma ranges from 6 kW to 24 kW with both emitters operating.
The are supplies have fault protection circuitry designed to protect the vacuum chamber and emitters from damage in the event of a power arc. In an arc condition, past experience has shown that the voltage between the chamber and the hot cathode is less than 50 volts. The arc protection circuit monitors the arc voltage and, if the voltage is less than the low voltage setpoint, disables the arc supply for a period of 30 ms allowing the arc to extinguish. After the timeout period the supply is again enabled. The arc protection circuit does not eliminate power arcing, but it does substantially decrease the input power to the arc, thus virtually eliminating arc damage within the chamber.
2.2.3
Temperature vs. Voltage
Using an optical pyrometer, the LaB6 cathodes have been monitored during heatup to establish a calibration between the input voltage and the temperature of the cathode. It was found that the time to reach thermal equilibrium for this emitter design is approximately 60 s. The calibration curve of the emitter temperature versus the voltage drop is shown in figure 2-2.
2.3
Langmuir Probes
Measurements of plasma properties within the vacuum chamber such as plasma float-ing potential, Vf, ion density, ne and the electron temperature, Te, are made usfloat-ing langmuir probes. The VTF machine has been equipped with two such probes. The "side probe" is mounted on the side of the vacuum chamber at the midplane of the machine, and is capable of radial motion from the inner to the outer wall. The sec-ond, the "top probe", is mounted on top of the machine and extends downwards into the vacuum along the outer wall. A tubular ceramic right angle extension at the end extends radially to mid radius within the plasma region. The top probe is capable of
1 1 1 El
6"1
E1 1) L.. 1 1LCathode Heater Voltage (Volts)
Figure 2-2: Cathode Temperature v.s. Voltage Across the Copper Posts
motion and will traverse from the midplane up to the top of the vacuum chamber. Both probes are fully automated and can be driven and reset remotely via the PLC.
2.3.1
Top Langmuir Probe
The top Langmuir probe is mounted at the top of the VTF chamber on the 340 degree port, at the extreme outer radius. The probe has a total vertical travel of 58 cm and is motor driven at 6.6 cm/s, traveling from full extension to full compression in approximately 8.9 seconds. The probe extends vertically into the VTF chamber to a 30 cm ceramic right angle extension which extends radially, into the plasma region, and is terminated with a 1.46 cm diameter copper ball. In addition, the top probe can be rotated about the Z-axis to move the probe tip to various radii. During optimization, the probe tip was set at mid-radius, (R=95 cm). This configuration allows the plasma to be probed at mid radius at any height from the midplane of the chamber up to the chamber top. Since the typical E-beam plasma lasts only 2 seconds, spacial scans of the upper half of the chamber with this probe require several plasma pulses to complete.
2.3.2
Side Langmuir Probe
The side Langmuir probe is mounted on the 140 degree side port at the midplane, and has a total horizontal travel of 63.5 cm from the chamber inner wall out to the outer wall. The probe is terminated with a small copper square measuring 0.4 cm2 per side (6.35 mm square), which is oriented normal to the helical magnetic field lines. The motor drive on the side probe will drive the probe from full extension, 11.4 cm from the inner wall to full retraction, into the chamber port extension and beyond the outer wall in approximately 2.5 seconds. This probe requires one three second plasma pulse to complete a radial parameter scan.
2.4
Target Plate
A stainless steel plate located within the VTF chamber acts (along with the vacuum chamber) as the anode for the plasma current. The plate has dimensions 50.8 cm wide, by 20.3 cm tall, by 0.95 cm thick, and is oriented approximately normal to the helical magnetic field lines. The plate is grounded to the vacuum chamber, and is equipped with a hall sensor which measures the current flowing in the ground lead. Nominal plate currents are 40 % of the total emitted cathode current, the remainder collected by the vacuum chamber walls. The low percentage of plasma current collected by the plate is most likely due to the off-center radial position of the plasma. As shown in chapter 4, the peak density of the plasma is displaced outboard from the center of the vacuum chamber (R=95 cm) by 10 cm, most likely causing significant current collection at the outer chamber wall (R=128 cm) before the plasma reaches the plate. This radial offset is discussed in section 4.2.1. It is possible that the magnetic field angle (helix pitch) could affect the amount of plate current collected, but the current collected by the plate was not one of the quantities that was optimized in this run.
Chapter 3
Theory of Operation
3.1
Hot Cathode Emitters
The Lanthanum hexaboride emitters in VTF have a surface area of 91.2 cm2, and are heated to temperatures ranging from 1100 C to 1600 C. The physical basis for electron emission arises from the "work function" of the material. The work function, O(eV), is defined as the potential rise of an electron as it moves from the Fermi level to a potential V=0. LaB6 has been found to have a work function of 2.52 to 3.35 eV [4]. An expression can be derived for the number of electrons per unit area at a particular temperature excited enough to escape from the metal surface; the basis for electron emission. The current density can be found to be [4]:
-P ( Amperes
Jo = AT2 W (m (3.1)
Where Jo is the emission current density, T is the absolute temperature of the emitting surface, q is the material work function in electron volts, WT is the electron energy
in eV (T(K)/11,600), and A is a positive constant, A = 120 .amp"e
Using € = 3.0 eV, and T=2200 C, Jo can be found to be 230 A. Multiplying Jo by the cathode area, Io, the total emitted current per cathode (in the absence of any space charge limit) can be found to be in excess of 20 kA. As will be shown later, the space charge limit severely limits the total current drawn from the cathodes in the VTF machine. Hot cathode emission has been thoroughly investigated, an excellent
summary may be found in [3].
3.2
Langmuir Probes In VTF
Langmuir probe theory is extremely complex, but several simplifications can make the theory manageable. If the plasma has cold ions (Ti < Te), no magnetic field, and is assumed to be quasineutral (ni - nf) away from the probe, the probe current can be found to be [5]:
I=
nooeAp
ni
)
[
2 7rm,
(2m:)1
exp
e(Vo- Vf)
Te
A,
exp -i
2
(3.2)
(3.2)
Where no, is the plasma density at an infinite distance, e is the electron charge in coulombs, A, is the probe area, Te is the electron temperature, mi and me are the ion and electron masses, Vo is the probe potential, Vf is the plasma floating potential,
and A, is the area of the sheath surrounding the probe. In all further calculations, it is assumed that the sheath is thin enough that the sheath area is approximately equal to the probe area.
If the probe is biased such that the electron current is negligible, then the ion saturation current dominates:
Ji = e exp - nT (3.3)
Note that since the ion current density is dependent on the square root of Te , the density calculation is not extremely sensitive to errors in the electron temperature.
If the electron temperature is desired, it can be found from the full equation. by taking the natural logarithm of the current characteristic:
In(I- Iat) = e(V- V) + n(a) (3.4)
Where I is the probe current, Isat is the ion saturation current, Vo is the probe voltage,
Te is the electron temperature, and a is a function of Vfnle, but independent of Vf.
The original assumptions can be relaxed with little error, other than recognizing that the plasma is strongly magnetized, by using the projected area of the Langmuir
probe tip along the magnetic field lines, and by recognizing that the probe diameter is much larger than the larmor radius.
3.2.1
Radial Scanning Langmuir Probe (Side Probe)
The radially scanning Langmuir probe has a probe tip consisting of a 6.35 mm per side copper square. Since the square is normal to the helical field lines, the area of both sides is used, and the total area is Ap = 8.06x10⁻⁵m2. Using this area, as well as the electron temperature (T,), (assumed to be 5 eV, verified in chapter 4) the ion density can be found from equation 3.3 as a function of the probe current:
ni(m3) = (5.8x101s)I,(A) (3.5)
3.2.2
Vertically Scanning Langmuir Probe (Top Probe)
The vertically scanning Langmuir probe has a ball at the probe tip which measures 1.46 cm in diameter. Using the area of a disk of the same diameter gives the effective area of the probe, Ap = 3.35 cm2. From equation 3.3, the density as a function of theprobe current can be found:
ni(m3) = (1.39x1O18)Ip(A) (3.6)
3.3
Energy Confinement Time
If the power input to the VTF plasma is known from the voltage and current at the emitters, and the plasma temperature and density are known, then the energy confinement time can be calculated. Defining the power input to the plasma as:
Pin = Vohmiclemission
(3.7)
Where Vohmic is voltage drop between the sheaths along the plasma column , and emission is the current emitted into the plasma. Since the total voltage drop from the cathode to the chamber must be the sum of the sheath drops plus the plasma drop,
Defining the energy stored in the plasma as:
Estored (niTi + neTe) Volplasma (3.8)
Where ni, ne and Ti, T, are the ion and electron temperature and density respectively, and Volplasma is the total volume of the plasma helix. If the simplifying assumptions are made that nfi - ne, and that Ti _ 0.1Te, then the stored energy takes the simplified form:
Estored - 2niTeVolplasma (3.9) Using the two previously defined quantities, the energy confinement time can be crudely estimated:
Estored _ niTeVolplasma (3.10)
Pin Vohmic•emission
3.4
Radial Power Loss
The radial power loss can be estimated from the plasma temperature and density, and from the input power as defined in equation 3.8.
3
Pradial loss = Pin - 3niTeCsAxsect (3.11) 2
Where C, is the ion sound speed, defined as /, and A.sect is the cross-sectional area of the plasma helix. Using the input power as defined by equation 3.8 and assuming that the energy confinement time remains constant, the input power to reach a specified plasma temperature and density (such as tokamak divertor conditions) could be estimated.
Chapter 4
Procedure And Results
After the two LaB6 filaments were installed in the VTF machine, the initial run period allowed a qualitative overview of the "best" operating conditions for filament plasmas. These plasma conditions were not ideal in any sense, but they were a good starting point for a systematic optimization of the operating parameters.
4.1
Optimization of Operating Parameters
Optimization of the plasma was based on current emitted from the cathodes measured at the bias power supplies, and ion saturation current measured using the vertically scanning langmuir probe (top probe) at the top of the machine. As discussed in the following sections, these two parameters usually tracked closely, and are a good indicator of plasma conditions. The top probe was biased at -200 v with respect to the vacuum chamber, and set at 20 cm above the midplane. The top probe tip, a 1.46 cm diameter ball, was positioned at a major radius R=95 cm; mid radius in the vacuum chamber. The langmuir probe remained at Z=20 cm and mid radius for the entire optimization to provide a stable reference, as previous scans had shown large, single humped density peaks near mid radius. Preliminary results showed that variations in neutral H2 fill pressure, magnetic field intensity, and magnetic field direction (helix angle) were highly influential in determining the emitted current. These parameters were varied first in an attempt to optimize both the emitted current and the ion
saturation current; two parameters which had shown strong corellation in early runs. Next, cathode bias voltage and cathode temperature were varied on both filaments to establish their effect on emitted cathode current and ion saturation current. While it was clear that these inputs would have some effect on the plasma, no clear functional dependence had been shown in previous runs.
The initial parameters were set as follows:
* Toroidal Field Current: 6.0 kA (BT=864 Gauss) * Vertical Field Current: 800 A (Bv=8.2 Gauss) * Neutral Hydrogen fill pressure: 2.4x10- 4 Torr * Cathode Heater Voltage: 10 V (1400 C) * Cathode Bias Voltage: 300 V
* Emission Current Limit: 100 A * Cathode Heatup Time: 60 s * Shot Length: 2 s
4.1.1
Pressure Variation
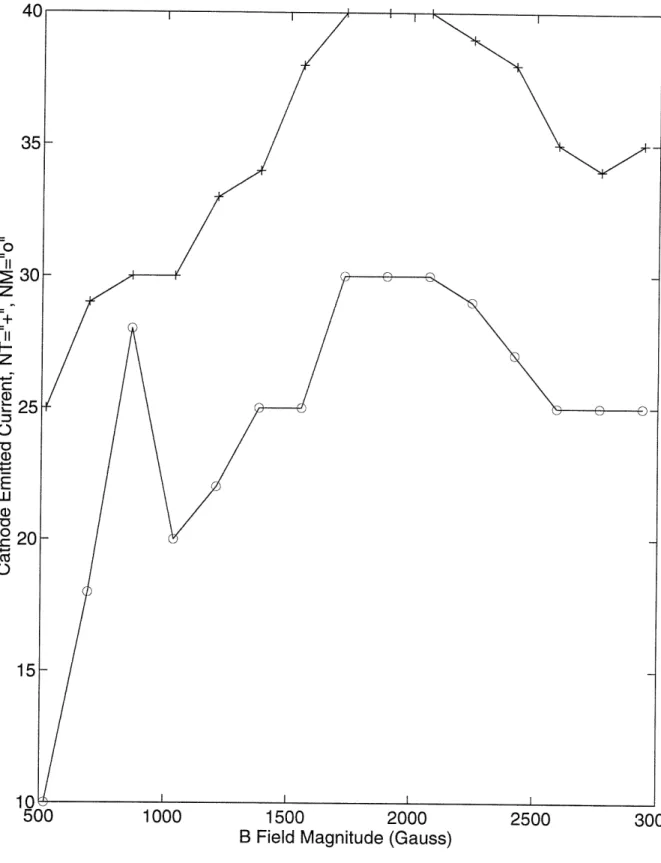
The first Parameter varied was the neutral H2 fill pressure. The pressure was varied from a low value of 9.6x10⁻⁵ Torr to a maximum of 4.8x10- 4 Torr.1 At pressures below 9.6x10- 5 , the gas in the chamber would not ionize. Pressures higher than 4.8x10⁻⁴ were not possible with the present pumping configuration. The Ion satu-ration currents were measured using the top langmuir probe, offset 20 cm up from the midplane of the machine (Z=+20 cm). Three shots were fired at each pressure, and the average of the ion saturation current, as well as the average of the cathode emission over the three shots was plotted versus pressure. The plots are shown in figures 4-1 and 4-2. The curve designations in figure 4-2 refer to the power supply which drives the cathode, i.e. North Top (NT), or North Middle (NM).
x 10-3
105 10-4
Neutral Hydrogen Pressure (Torr)
Figure 4-1: Ion Saturation Current v.s. Neutral Hydrogen Pressure
103
10-5 10
Neutral Hydrogen Pressure (Torr)
Figure 4-2: Emitted Cathode Current v.s. Hydrogen Pressure
-Both the cathode emission current and the ion saturation current show clear max-ima at pressures near 1x10- 4 Torr. For the remainder of the plasma shots, the pressure was set to this maximum.
4.1.2
Magnetic Field Helix Angle
The next quantity to be maximized was the angle of the helix. By varying the ratio of vertical field to toroidal field (v), the angle of the helix from the horizontal can be varied. The toroidal field was kept constant at 800 Gauss (6kA), while the vertical field was varied over a range from 1 Gauss to 10 Gauss (0.1 kA to 1 kA). The results of the field ratio variation are shown in figure 4-3. While optimizing the plasma during changes in magnetic field angle, only the emitted current was used as a measure of plasma properties. If the pitch angle of the magnetic field changes, the Z location of the plasma also changes. Since this would affect the probe measurements, only the emitted current was valid as a stable measure of plasma properties. As shown in figure 4-3 the optimum field ratio is B v 144. This field ratio creates a helix angle
of 0.390. At this angle, the plasma rises 4 cm for every (One revolution=5.97 m) pass around the torus.
4.1.3
Magnetic Field Magnitude Variation
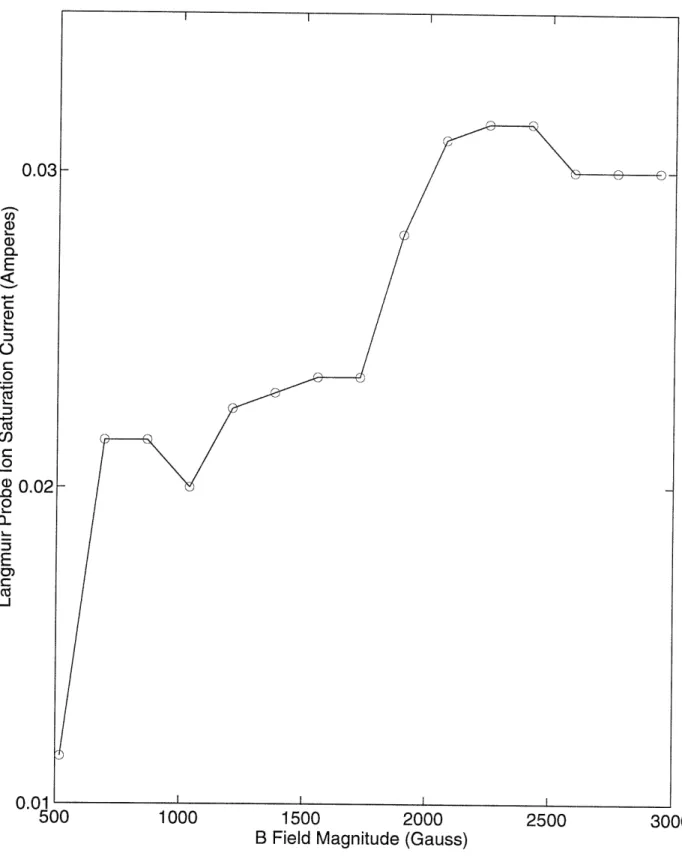
After the pressure and helix angle were optimized, the magnitude of the total magnetic field was varied. Since an optimum helix angle had been found, both the toroidal field and the vertical field were varied in proportion, thus varying the total field strength. The relative magnitude of the toroidal field is much stronger than the vertical field, so all of the plots of total magnetic field are essentially plots of toroidal field magnitude. As shown in figure 4-4 and figure 4-5, the ion saturation current and the cathode emission current are both maximized at B _ 2000 Gauss.
100 200 300 400 500 600 700 800 900
100 200 300 400 500 600 700 800 900
Magnetic Field Ratio, TF/VF
Figure 4-3: Cathode Emission Current v.s. Field Ratio,- TF/VF
45 a, a) a40
E
0•C:
a)
0) o 35 0 4-a a) E w a) 0130 25 01 0 I r I · E E E0.02
a) C0 E L. 0 C 0 4-0 E cm) _J 0.01 1000 1500 2000 2500B Field Magnitude (Gauss)
Figure 4-4: Ion Saturation Current v.s. B Field Magnitude
--
o
IIz
II I-z t L 0 O uj -z 0B Field Magnitude (Gauss)
4.1.4
Cathode Bias Voltage Variation
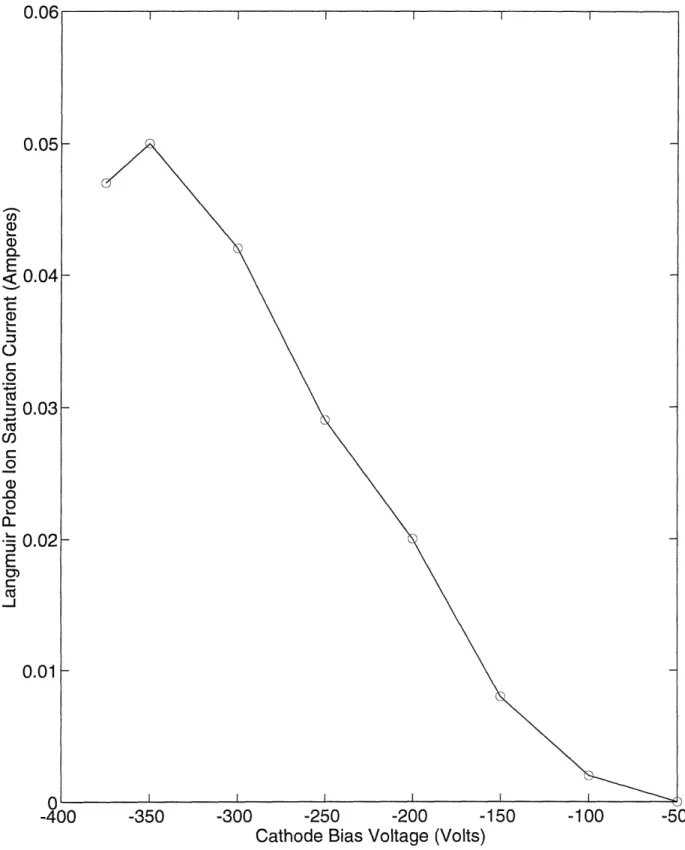
After setting the pressure, helix angle, and B field strength at "best" values found previously, the cathode bias voltage was varied. The cathode bias voltage can be varied on both emitters from 0 to 375 volts. With all other quantities held constant, the bias voltage was changed in increments of 50 volts while emitted current and ion saturation current were monitored. Plots of the cathode emission current, and vertical probe ion saturation current are shown in figures 4-6, and figure 4-7. As shown in the plots, increasing the bias voltage increased both the cathode emission current, and the ion saturation current. The maximum cathode bias voltage that the supply can presently produce is -375 V, thus the bias was set to this value.
4.1.5
Cathode Temperature Variation
With all other quantities set to their optimized levels, the last parameter to be varied was the cathode temperature. While it was clear from the theory that the cathodes should be limited not by emission, but rather by space charge limitations, it was a good exercise to verify that the emission limit could be reached at some temperature. Although the temperature was not measured directly (via optical pyrometry) during this run, it was assumed that the previous temperature calibrations were valid.
The voltage drop across the cathode was varied from 5 volts to 12.5 volts in increments of 1 volt. This varied the temperature from less than 800 C to greater than 1600 C. A plot of Langmuir probe current versus cathode temperature is shown in figure 4-8. Plots of cathode emission current versus cathode temperature are shown in figure 4-9.
4.2
Langmuir Probe Measurements
Upon completion of the optimization the "best" operating parameters were found to be:
C)
Cz
0 0 E -j r--400 -350 -300 -250 -200 -150 -100Cathode Bias Voltage (Volts)
Figure 4-6: Vertical Probe Ion Saturation Current (Z=20 cm) v.s.
Voltage
Cathode Bias -50 I
OU 50 -o II S40
z
-+
III--z
r-0-4(
30 E - 20 0 10 0 -4(Cathode Bias Voltage (Volts)
800 900 1000 1100 1200 1300 1400 1500 1600 1700
Cathode Temperature (C)
Figure 4-8: Langmuir Probe Ion Saturation Current v.s. Cathode Temperature
0, E 1-a U 0 O E5 c/)
c
o-L..Q 0 3cn
E -j .. 700 I800 900 1000 1100 1200 1300 1400 1500 1600 1700
Cathode Temperature (C)
Figure 4-9: Cathode Emitted Current v.s. Cathode Temperature 700
* Magnetic Field Ratio: - - = =144
* Magnetic Field Magnitude: B=2000 Gauss * Cathode Bias Voltage: Maximum, -375 V * Cathode Temperature: 1500 C
Using these values for the operating parameters of the VTF machine, it was possi-ble to get extremely repeatapossi-ble and consistent cathode emission currents of 80 and 60 Amperes from the NT and NM cathodes, respectively. Langmuir probe measurements of the plasma floating potential, Vf/, plasma ion density, ni, and electron temperature,
Te were made, and were also found to be extremely repeatable. The Langmuir probe
measurement data is shown in the following sections.
4.2.1
Radial Langmuir Probe Measurements
Three separate measurements of the plasma variation with radius were made. The first, the floating potential, Vf was measured during a three second plasma pulse with the radial probe moving from the inner radius at R=74.4 cm (11.4 cm from the inner wall) to beyond the outer wall (R= 127.8 cm). Plots of the floating potential variation with respect to major radius (R) are shown in figure 4-10
The plasma floating potential varies strongly with radius, from -120 V at R=108 cm to near zero at R= 125 cm. This shows that a strong radial electric field must exist in the plasma, on the order of 700 V/m. Note also that the peak floating potential is at R= 108 cm, 12 cm outboard of the chamber centerline (R= 95 cm).
Having measured the floating potential, the probe was now biased into ion sat-uration by setting the probe bias at -170 V, and monitoring the probe current. As seen in figure 4-11, the ion density reaches a peak of 3.5x0 17m- 3 at a major radius of 105 cm, 10 cm outboard from the midplane. This is consistent with the placement of the cathodes within the chamber; the cathodes are in the center of the port cover plate, but the port is offset outwards from the center of the chamber by 10 cm.
90 100 110 Major Radius (cm)
Figure 4-10: Plasma Floating Potential at the Midplane v.s. Major Radius 0 -20 -40 -60 -80 a. -c 0) Q.c-0 U, -100 -120 -140 80 120 130 140 ___ ~ I _1 \ | I f ... i ii f ... . • T I I E + -70
3.5 3 2.5 2 1.5 1 0.5 0 0 x 1017 I I I I I I 90 100 110 120 130 Major Radius (cm)
Figure 4-11: Plasma Ion Density at the Midplane v.s. Major Radius
140 I I . I I · L4 r H H -_0 = 7
The discontinuity in the density at R=118 cm is consistent from shot to shot, and could be due to a broken or missing lanthanum ring on one of the emitters, but this has not been verified. The density plot also shows the plasma near the outer wall (R= 127.8 cm) as a sharp drop-off in the density as the plasma scrapes the outer wall. The electron temperature was found at several radii across the plasma by posi-tioning the probe at a particular radius, and sinusoidally varying the bias voltage at 20 hz from 10 Volts above the floating potential where the probe collects electrons, to 40 Volts below the floating potential, where the probe is in ion saturation, and repels electrons. The electron temperature was found to be constant at approximately 4 eV across the radius. A representative plot of the I-V curve of the Langmuir probe is shown in figure 4-12. A plot of In(I - Is,,t) v.s. V, as well as a least-squares fit to the curve is shown in figure 4-13 to illustrate the 4 eV electron temperature, where the temperature is the inverse of the curve slope.
4.2.2
Vertical Langmuir Probe Measurements
The vertical langmuir probe plots were constructed using the data from three separate shots for the floating potential and density plots. The temperatures were measured using data collected at discrete points on the Z-axis. The radial position of the tip was set to R=107 cm, the peak density and potential as shown on the radial probe scans.
The floating potential plots show a linearly decreasing potential above the mid-plane, dropping off quickly from -120 V at Z=0 cm, to -20 V at the bottom of the target plate Z=40 cm. The slight discontinuities at Z=20 cm and Z=38 cm are a result of joining together data from three separate shots. The density profiles show densities of 2x10¹⁷ at the midplane, with peak densities of 2.8x10¹⁷ at Z=20 cm. Slight density fluctuations can be seen on a length scale of 4 cm, which is the calcu-lated distance between turns of the helix. Since the plasma radial position is offset outwards, the plasma scrapes the outer wall of the chamber as it spirals upwards. The density drops off quickly at Z=40 cm, as expected, due to the target plate.
mid-E
<0 L c--0> E ¢-. C -o -150 -145 -140 -135 -130 -125 -1Langmuir Probe Bias Voltage (V)
Figure 4-12: Plasma Langmuir Probe I-V Curve at the Midplane
20 -115 I
Ui, UI)
v,
ra
Probe Bias Voltage (V)
Figure 4-13: ln(I - Isat) v.s. V, along with a first order least square fitted line, where the Electron Temperature is the inverse slope, T, = 0.26261 = 3.8eV
0
CO
0)2
E
-, o, 0 (z 1.a-
"5E
0W) o,, r - 1 > -1 -1)Z-Axis Distance from the Midplane (cm)
Figure 4-14: Plasma Floating Potential v.s. Distance from the Midplane
41
10
20
30
40
10 20 30 40
E
Z-Axis Distance from the Midplane
Figure 4-15: Plasma Density v.s. Distance from the Midplane x 1017
LI
plane (Z=0 cm) up to the top of the chamber (Z=58 cm) and little variation was found between Z=0 cm, and Z=40 cm. A representative plot is shown in figure 4-16.
4.2.3
Two Cathodes v.s. One Cathode
The relative merits of operating two cathodes or one were investigated. It was found that a single cathode emits only 10 A maximum, versus 80 A with both operating. The peak floating potential in the plasma with one cathode operating was -20 V maximum, and in terms of density, the plasma density with one cathode was 2.9x10¹⁶, more than an order of magnitude less than the density with both cathodes operating. Possibly, the space charge limited emission of one cathode is enhanced by the presence of plasma from the other cathode.
U,
WO
Probe Bias Voltage
Figure 4-16: Plot of n(I-I,,sat) along with a first order least-squares fitted line, where the electron temperature is the inverse slope Te = -- 0.2724 1 - 3.67eV.
-Chapter 5
Summary of Results
5.1
Plasma Electron Temperature
The maximum electron temperature in the plasma was found to be 4 eV. The dis-tribution of temperature through the plasma was fairly uniform, despite changes in density and floating potential.
5.2
Plasma Ion Density
The maximum ion density in the plasma was found to be 3.5x10¹⁷m-3 at a radius of R=105 cm. The ion density showed strong variation with Z axis, dropping to
1x10¹⁷m- 3 at Z=40 cm. It is likely that the density is even higher below the midplane, but below-midplane probes have not yet been installed.
5.3
Emitted Current
The emitted cathode current is at present approximately 80 A per cathode. Attempts to increase the emitted current have had only limited success; increases in current are usually accompanied by partial vacuum contamination from the carbon used in the cathode structure. Evidence of contamination can be seen on the residual gas analyzer (RGA) where both carbon (mass 12), and carbon compounds (masses 14,15,16) show
an order of magnitude increase followed by a slow pumpout.This results in poor repeatability for the next few shots.
5.4
Energy Confinement Time
Using the results of the radial floating potential scans, the voltage drop across the plasma can be estimated. From figure 4-14, it can be seen that the floating potential near the top of the chamber is -20 v. The loaded cathode voltage during an 80 A shot is -250 V, and the floating potential at the midplane is -120 V, as shown in figure 4-10. If the drop in floating potential from the chamber top to the midplane is extrapolated downwards, the lower sheath voltage can be estimated at 20 V. This gives the voltage drop across the plasma as approximately 200 V. From equation 3.8, the input power to the plasma can be estimated as: (200 V) (80 A) (2 cathodes) = 32 kW.
The plasma temperature and density are known from figures 4-13 and 4-11, thus the plasma stored energy can be estimated. Estimating the plasma volume as 0.2 m wide by 0.012 m thick (the cathode diameter), by 150 m long (25 turns at 6 m per turn), gives the plasma volume as 0.36m3. This yields a stored energy of (0.288j~)(0.36m3) = 0.1 J, where twice the volume of a single beam was used, since two beams were operating.
Using equation 3.10, the energy confinement time is _' 3.1 microseconds.
5.5
Power Loss
From equation 3.11, the power loss can be estimated by assuming particle loss, at the sound speed, out of both ends of the helix. Using the previously calculated value of 32 kW as the input power, the ion sound speed as 20 km per second, and the cross sectional area of the plasma beam as (0.2 m)(0.012 m) = 2.4x10- 3 m2, the end loss is found to be 9.2 W. From equation 3.11, the remaining loss can now be estimated as 32 kW - 9.2 W = 31.9 kW. Virtually all of the power is lost through radiation loss,
charge exchange or radial particle flux.
5.6
Conclusions and Recommendations
Although the VTF machine is not at present capable of producing fusion grade tem-peratures and densities, some improvements could possibly be made. From the radial Langmuir probe scans, the low percentage of target plate current and from discol-oration of the vacuum chamber walls at the outer radius it is clear that a large majority of the plasma current is collected at the outer wall as it spirals upwards. Repositioning the cathodes to move the plasma to the center of the chamber would certainly help this problem. Adding more cathodes will most likely increase tempera-ture and density, but whether the increase is as dramatic as it was from one cathode to two remains to be seen. It is likely that radiation by recombination, excitation, and impurities as well as charge exchange losses play an important role in the power loss equation, and these should be investigated.
Bibliography
[1] H. Ahmed and A.N. Broers. Lanthanum hexaboride electron emitter. Journal of
Applied Physics, 43(5), May 1972.
[2] Thomas James Dolan. Fusion Research, volume 3 of Fusion Research. Pergamon Press, Elmsford, New York, first edition, January 1980.
[3] J.W. Gewartowski and H.A. Watson. Principles of Electron Tubes, volume 1. D. Van Nostrand Company, Inc., Princeton, New Jersey, first edition, 1965.
[4] D.M. Goebel, Y. Hirooka, and T.A. Sketchley. Large-area lanthanum hexaboride electron emitter. Review of Scientific Instruments, 56(9), September 1985.
[5] I.H. Hutchinson. Principles of Plasma Diagnostics, volume 1. Cambridge Univer-sity Press, Cambridge, first edition, 1987.
[6] K.N. Lueng, D. Moussa, and S.B. Wilde. Directly heated lanthanum hexaboride cathode. Review of Scientific Instruments, 57(7), July 1986.
[7] K.N. Lueng, P.A. Pincosy, and K.W. Ehlers. Directly heated lanthanum hexa-boride filaments. Review of Scientific Instruments, 55(7), July 1984.